Towards Rapid Prototyping and Comparability in Active Learning for
Deep Object Detection
Tobias Riedlinger
1,∗ a
, Marius Schubert
2,∗ b
, Karsten Kahl
2 c
, Hanno Gottschalk
1 d
and
Matthias Rottmann
2 e
1
Institute of Mathematics, Technical University Berlin, Germany
2
School of Mathematics and Natural Sciences, IZMD, University of Wuppertal, Germany
Keywords:
Active Learning, Deep Object Detection, Prototyping.
Abstract:
Active learning as a paradigm in deep learning is especially important in applications involving intricate per-
ception tasks such as object detection where labels are difficult and expensive to acquire. Development of
active learning methods in such fields is highly computationally expensive and time consuming which ob-
structs the progression of research and leads to a lack of comparability between methods. In this work, we
propose and investigate a sandbox setup for rapid development and transparent evaluation of active learning
in deep object detection. Our experiments with commonly used configurations of datasets and detection ar-
chitectures found in the literature show that results obtained in our sandbox environment are representative of
results on standard configurations. The total compute time to obtain results and assess the learning behavior
can be reduced by factors of up to 14 compared to Pascal VOC and up to 32 compared to BDD100k. This
allows for testing and evaluating data acquisition and labeling strategies in under half a day and contributes to
the transparency and development speed in the field of active learning for object detection.
1 INTRODUCTION
Deep learning requires large amounts of data, typi-
cally annotated by vast amounts of human labor (Zhan
et al., 2022; Budd et al., 2021; Li and Sethi, 2006). In
particular in complex computer vision tasks such as
object detection (OD), the amount of labor per im-
age can lead to substantial costs for data labeling.
Therefore, it is desirable to avoid unnecessary label-
ing effort and to have a rather large variability of
the database. Active learning (AL, see e.g., (Settles,
2009)) is one of the key methodologies that aims at
labeling the data that matters for learning. AL al-
ternates model training and data labeling as illus-
trated in Fig. 1. At the core of each AL method is
a query strategy that decides post-training which un-
labeled data to query for labeling. The computation
cost of AL is in general at least an order of magnitude
a
https://orcid.org/0000-0002-1953-8607
b
https://orcid.org/0000-0002-9410-8949
c
https://orcid.org/0000-0002-3510-3320
d
https://orcid.org/0000-0003-2167-2028
e
https://orcid.org/0000-0003-3840-0184
*
Equal contribution.
L
object detector
training
U
Q
query
labeling by oracle
t = 1, . . . , T
t
evaluation
testing
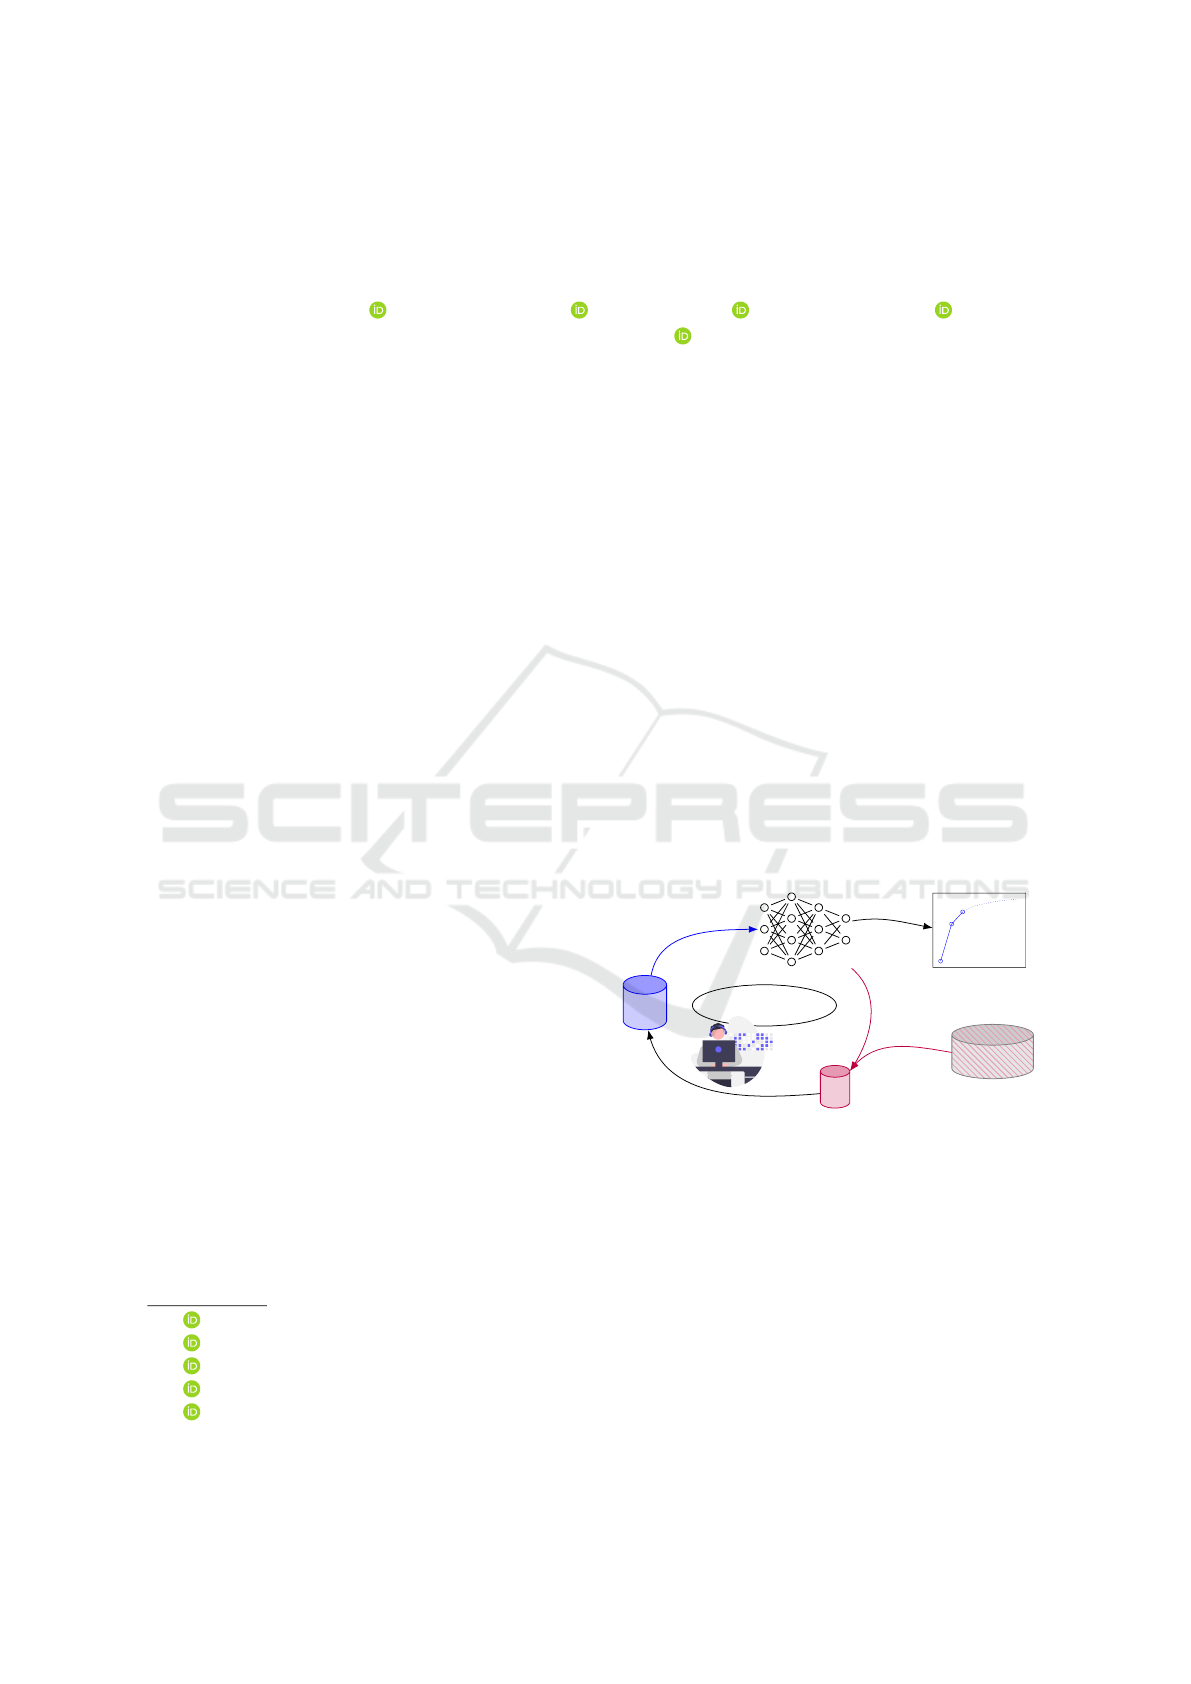
Figure 1: The generic pool-based AL cycle consisting of
training on labeled data L, querying informative data points
Q out of a pool of unlabeled data U and annotation by a
(human) oracle. In practice, training compute time is orders
of magnitude larger than evaluating the AL strategy itself or
the query step.
higher than ordinary model training and so is its de-
velopment (Tsvigun et al., 2022; Li and Sethi, 2006),
which comprises several AL experiments of T query
steps with different parameters, ablation studies, etc.
Hence, it is notoriously challenging to develop new
AL methods for applications where model training it-
self is already computationally costly. In the field of
366
Riedlinger, T., Schubert, M., Kahl, K., Gottschalk, H. and Rottmann, M.
Towards Rapid Prototyping and Comparability in Active Learning for Deep Object Detection.
DOI: 10.5220/0012315400003660
Paper published under CC license (CC BY-NC-ND 4.0)
In Proceedings of the 19th International Joint Conference on Computer Vision, Imaging and Computer Graphics Theory and Applications (VISIGRAPP 2024) - Volume 2: VISAPP, pages
366-374
ISBN: 978-989-758-679-8; ISSN: 2184-4321
Proceedings Copyright © 2024 by SCITEPRESS – Science and Technology Publications, Lda.

OD, a number of works overcame this cumbersome
hurdle (Yoo and Kweon, 2019; Brust et al., 2018;
Roy et al., 2018; Haussmann et al., 2020; Schmidt
et al., 2020; Choi et al., 2021; Yuan et al., 2021; Elezi
et al., 2022; Papadopoulos et al., 2017; Desai et al.,
2019; Subramanian and Subramanian, 2018). How-
ever, these works did so in highly inhomogeneous set-
tings which makes their comparison difficult. Besides
that, AL with real-world data may suffer from other
influencing factors, e.g., the quality of labels to which
end fundamental research is conducted on AL in pres-
ence of label errors (Bouguelia et al., 2015; Bouguelia
et al., 2018; Younesian et al., 2020; Younesian et al.,
2021). These observations demand for a develop-
ment environment enabling rapid prototyping, cutting
down the huge computational efforts of AL in OD and
fostering comparability and transparency.
Contribution. In this work, we propose a devel-
opment environment that drastically cuts down the
computational cost of developing AL methods. To
this end, we construct (a) two datasets that general-
ize MNIST (LeCun et al., 1998) and EMNIST (Co-
hen et al., 2017) to the setting of OD making use
of background images from MS-COCO (Lin et al.,
2014) and (b) a selection of suitable small-scale mod-
els. We conduct experiments showing that results on
our datasets generalize to a similar degree to com-
plex real-world datasets like Pascal VOC (Evering-
ham et al., 2010) or BDD100k (Yu et al., 2020), as
they generalize among each other. We also demon-
strate a reduction of computational effort of AL ex-
periments by factors of up to 32. Further, a nuanced
evaluation protocol is introduced in order to prevent
wrong conclusions from misleading evidence encoun-
tered in experiments. We summarize our contribu-
tions as follows:
• We propose a sandbox environment with two
datasets, three network architectures, several AL
baselines and an evaluation protocol. This allows
for broad, detailed and transparent comparisons at
lowered computational effort.
• We analyze the generalization ability of our sand-
box in terms of AL rank correlations. We find
similar performance progressions indicating that
results obtained by our sandbox generalize well
to Pascal VOC and BDD100k, i.e., to the same
extent as results generalize between Pascal VOC
and BDD100k.
• We contribute to future AL development by
providing an implementation of our pipeline
in a flexible environment as well as an auto-
mated framework for evaluation and visualiza-
tion of results. This involves configurations
with hyperparameters, as well as checkpoints and
seeded experimental results (see https://github.
com/tobiasriedlinger/al-rapid-prototyping).
The remainder of this work is structured as follows:
Section 2 contains a summary of the literature in
fully-supervised AL for OD and explains how the
present work relates to it. In Section 3 we introduce
our motivation, methods investigated and our pro-
posed evaluation metrics. Section 4 first introduces
our experimental setup. We investigate the compara-
bility of AL methods in OD in different cases. Af-
terwards, we compute rank correlations for different
datasets to measure the degree of similarity between
the AL results for different datasets. Finally, we
show time measurements to estimate the speed-ups
achieved. We close with concluding remarks which
we draw from the empirical evidence in Section 5.
2 RELATED WORK
Numerous methods of AL have been developed in the
classification setting (Settles, 2009) and largely fall
into the categories of uncertainty-based and diversity-
based query strategies. While uncertainty methods
make use of the current model’s prediction, diversity
methods exploit the annotated dataset together with
the current model and seek representative coverage
of the data generating distribution. Due to increased
complexity in annotations in OD, AL plays a large
role in OD which has been addressed by some au-
thors. (Yoo and Kweon, 2019) present a task-agnostic
method based on a loss estimation module. (Brust
et al., 2018) estimate prediction-wise uncertainty by
the probability margin and aggregate to image uncer-
tainty in different ways. (Roy et al., 2018) follow a
similar idea using classification entropy. Moreover,
a white-box approach similar to query-by-committee
in introduced. (Haussmann et al., 2020) utilize en-
sembles to estimate classification uncertainty via mu-
tual information while (Schmidt et al., 2020) use
combinations of localization and classification uncer-
tainty. But in particular, as training a variety of de-
tector heads in each step is very costly, ensemble
query methods tend to be approximated by Monte
Carlo (MC) Dropout (Gal and Ghahramani, 2016;
Gal et al., 2017). Other works investigate special
AL-adapted OD architectures or loss functions (Choi
et al., 2021; Yuan et al., 2021). In this paper we
compare uncertainty-based methods with each other
that are exclusively based on fully supervised training
of non-adapted object detectors (Brust et al., 2018;
Roy et al., 2018; Haussmann et al., 2020; Choi et al.,
2021). The preceding literature is difficult to compare
since datasets, models, frameworks and hyperparame-
Towards Rapid Prototyping and Comparability in Active Learning for Deep Object Detection
367
amount of training data
test performance
458.83
461.42
1074.79
1075.95
reference to max performance
t
1
t
2
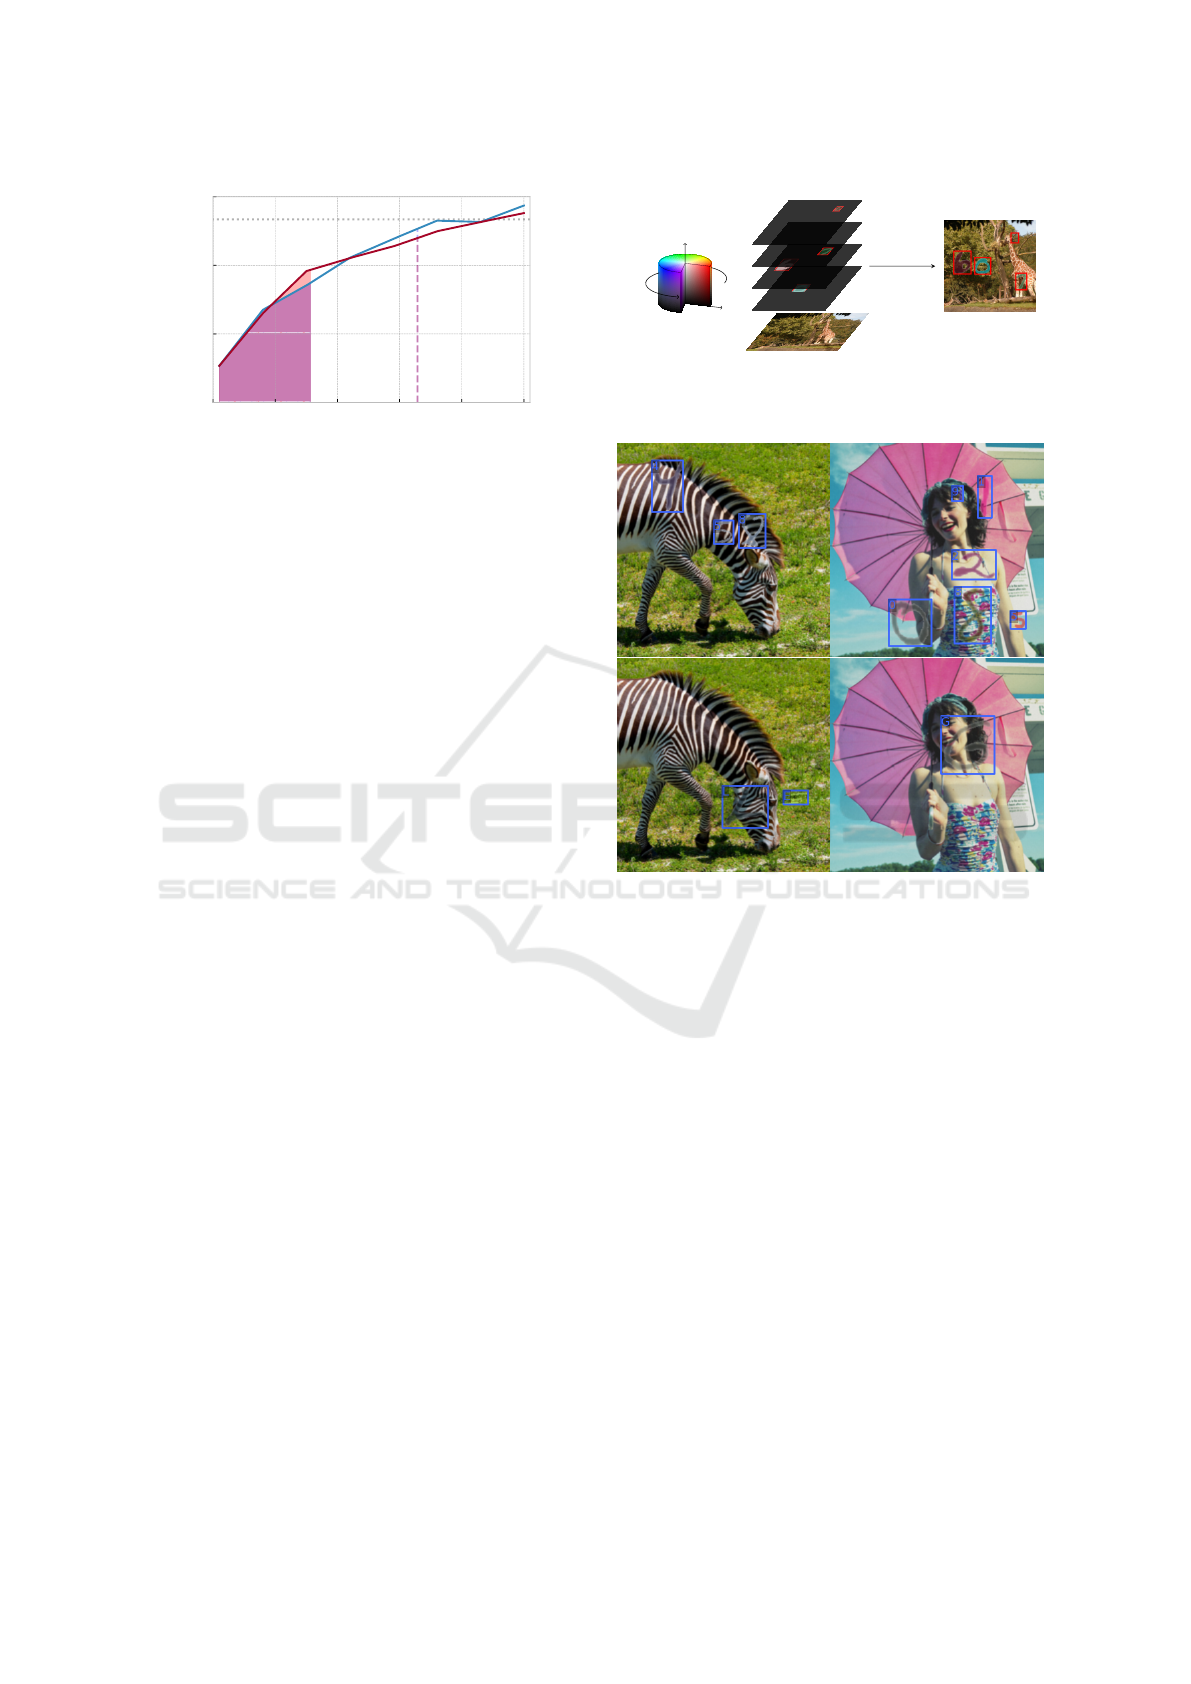
Figure 2: Area under AL curve (AUC) metric at different
stages of an AL curve for two different query strategies (av-
eraged, taken from experiments in Fig. 5).
ters for training and inference heavily differ from each
other. Unlike the works mentioned, we aim at putting
the AL task itself on equal footing between different
settings to improve development speed and evaluation
transparency. In our work, we compare a selection
of the above-mentioned methods to each other with
equivalent configurations for frequently used datasets
and architectures. Comparative investigations of this
kind has escaped previous research in the field.
3 A SANDBOX ENVIRONMENT
WITH DATASETS, MODELS
AND EVALUATION METRICS
In this section we describe the objective of AL and
our sandbox environment. The main setting we pro-
pose consists of two semi-synthetic OD datasets and
down-scaled versions of standard OD models leaving
the detection mechanism unchanged. Additionally,
we introduce evaluations capturing different aspects
of the observed AL curve.
Active Learning. The term active learning refers to
a setup (cf. Fig. 1) where only a limited amount of
fully annotated data L is available together with a
task-specific model. In addition, there is a pool (or
a stream, however, we focus on pool-based AL) of
unlabeled data U from which the model queries those
samples Q which are most informative. Afterwards,
Q is annotated by an oracle, which in practice is usu-
ally a human worker, added to L and the model is
fine-tuned or fitted from scratch again. Success of the
query strategy is measured by observing an increase
in test performance after training on L ∪Q . Eval-
uation of the current model performance measured
before each query step leads to graphs like the ones
shown in Fig. 2. Querying data can take diverse algo-
rithmic forms, see some of the methods described in
Section 2 or (Settles, 2009).
COCO background
MNIST numbers:
transformed and colorized
S
V
H
Figure 3: Generation scheme of semi-synthetic OD data
from MNIST digits on a non-trivial background image from
MS-COCO.
Figure 4: Dataset samples from MNIST-Det (top) and
EMNIST-Det (bottom) including annotations.
Datasets. We construct an OD problem by build-
ing a synthetic overlay to images from the real-world
MS-COCO dataset (cf. Fig. 3), which constitutes the
data of our sandbox, see Fig. 4 for samples. COCO
images with deleted annotations provide a realistic,
feature-rich background on which foreground objects
are spawned to be recognized. We utilize two sets of
foreground categories: MNIST digits and EMNIST
letters. We apply randomized coloration (uniform
(h, s, v) ∼ U([0.0, 1.0] ×[0.05, 1.0] ×[0.1, 1.0])) and
opacity (α ∼ U ([0.5, 0.9])) to foreground instances
such that trivial edge detection becomes unfeasible.
In addition, we apply image translation, scaling and
shearing to all numbers/letters. The number of in-
stances per background image is Poisson-distributed
with mean λ = 3. Tight bounding box (and instance
segmentation) annotations are obtained from the orig-
inal transformed gray scale versions and the category
label are inherited. Compared to simple OD datasets
such as SVHN (Netzer et al., 2011), the geometric va-
riety in our datasets is more similar to those of large
OD benchmarks such as Pascal VOC or MS-COCO,
VISAPP 2024 - 19th International Conference on Computer Vision Theory and Applications
368

Table 1: Standard deviations of center coordinates, width
and height (all relative to image size) of bounding boxes, as
well, as number of categories in the training split for several
object detection datasets.
Dataset c
x
c
y
w h # categories
SVHN 0.099 0.059 0.048 0.161 10
Pascal VOC 0.217 0.163 0.284 0.277 20
MS COCO 0.254 0.209 0.220 0.234 80
KITTI 0.229 0.080 0.067 0.157 8
BDD100k 0.224 0.133 0.059 0.086 10
MNIST-Det 0.233 0.233 0.054 0.054 10
EMNIST-Det 0.233 0.233 0.066 0.065 26
Table 2: Exemplary OD architectures with backbone con-
figurations employed in the experiments and associated
number of parameters.
Detector Backbone # params Backbone # params
RetinaNet ResNet50 36.5M ResNet18 20.1M
Faster R-CNN ResNet101 60.2M ResNet18 28.3M
YOLOv3 Darknet53 61.6M Darknet20 10.3M
see Table 1. The reduction in the dataset complex-
ity allows for high performance even for small archi-
tectures and leads to quickly converging training and
low inference times. In the following we term these
datasets “MNIST-Det” and “EMNIST-Det”.
Models. Modern OD architectures utilize several
conceptually different mechanisms to solve the de-
tection task. Irrespective of the amount of accessible
data, some applications of OD may require high in-
ference speed while others may require a large degree
of precision or some trade-off between the two. The
underlying detection mechanism is, however, disjoint
to some degree from the depth of the backbone. The
latter is mainly responsible for the quality and resolu-
tion of features. We use models with reduced network
depth while keeping the detection head unchanged.
Table 2 shows the choices for a YOLOv3 (Redmon
and Farhadi, 2018), RetinaNet (Lin et al., 2017) and
Faster R-CNN (Ren et al., 2015) setup, which we have
adapted. The parameter count is reduced by up to a
factor of around 6 leading to a significant decrease in
training and inference time.
Active Learning Methods in Object Detection. The
frequently used uncertainty-based query strategies
from image classification, such as entropy, probabil-
ity margin, MC dropout, and mutual information, de-
termine instance-specific but not image-wise scores.
However, the query strategies here involve image-
wise selection for annotation. It is, therefore, useful
to introduce an aggregation step like in (Brust et al.,
2018) to obtain image-wise query scores.
For a given image x, a neural network predicts a
fixed number N of bounding boxes
ˆ
b
(i)
x
= {x
min
, y
min
, x
max
, y
max
, s, p
1
, . . . , p
C
}, (1)
where i = 1, . . . , N, x
min
, y
min
, x
max
, y
max
represent
the localization, s the objectness score (or ana-
log) and p
1
, . . . , p
C
the class probabilities for the C
classes. Only the set of boxes post-non-maximum-
suppression (NMS) and score thresholding are used
to determine prediction uncertainties. The choice
of threshold parameters for NMS significantly influ-
ences the queries, since they decide surviving predic-
tions. Given a prediction
ˆ
b we compute its classifica-
tion entropy H(
ˆ
b) = −
∑
C
c=1
p
c
·log(p
c
) and its prob-
ability margin score
PM(
ˆ
b) = (1 −[p
c
max
− max
c̸=c
max
p
c
])
2
. (2)
Here, c
max
denotes the class with the highest prob-
ability. We implement dropout layers in order to
draw Monte-Carlo (MC) Dropout samples at infer-
ence time where activations of the same anchor box
ˆ
b
1
, . . . ,
ˆ
b
K
are sampled K times. The final prediction
under dropout is the arithmetic mean
ˆ
b =
1
K
∑
K
i=1
ˆ
b
i
.
Moreover, MC mutual information is estimated by
MI(
ˆ
b) = H(
ˆ
b) −H(
ˆ
b) (3)
with the second term being the average entropy over
MC samples. We also regard the maximum feature
standard deviations within
ˆ
b by standardizing vari-
ances (denoted by σ(φ) 7→
e
σ(φ)) over all query pre-
dictions to treat localization and classification fea-
tures on the same footing. The dropout uncertainty
is then D = max
φ∈
ˆ
b
(i)
x
e
σ(φ). Note that for all these
methods, uncertainty is only considered in the fore-
ground instances. Therefore, either the sum, average,
or maximum is taken over predicted instances to ob-
tain a final query score for the image. Summation, for
instance, tends to prefer images with a high amount
of instances while averaging is strongly biased by the
thresholds (e.g., large amounts of false positives could
be filtered by a higher threshold).
Additionally, random acquisition serves as a com-
pletely uninformed baseline for us. Diversity-based
methods make use of latent activation features in neu-
ral networks which heavily depend on the OD archi-
tecture. Since purely diversity-based methods have
been far less prominent in the literature, we focus on
the more broadly established uncertainty baselines.
Evaluation. In the literature, methods are frequently
evaluated by counting the number of data samples
needed to cross some fixed reference performance
mark. For OD, performance is usually measured in
terms of mAP
50
(Everingham et al., 2010) for which
there is a maximum value mAP
max
50
known when train-
ing on all available data. Some percentage, 0.x ·
mAP
max
50
needs to be reached with as few data points
as possible. Collecting performance over amount of
Towards Rapid Prototyping and Comparability in Active Learning for Deep Object Detection
369

queried data gives rise to curves such as in the top
right of Fig. 1, called AL curves in the following.
“Amount of training data” usually translates to the
number of images which acts as a hyperparameter
and is fixed for each method. Considering that each
bounding box needs to be labeled and there tends to
be high variance in the number of boxes per image in
most datasets, it is not clear whether to measure anno-
tated data in terms of images or boxes. Therefore, we
stress that the scaling of the t-axis is particularly im-
portant in OD. Both views, counting images or boxes,
can be argued for. Therefore, we evaluate the perfor-
mance of each result not only based on images, but
also transform the t-axis to the number of annotated
boxes. By interpolation between query points and av-
eraging over seeds of the same experiment, we obtain
image- or box-wise error bars for the performance.
In light of the complexity of the AL problem,
we adopt the area under the AL curve (AUC). It
constitutes a more robust metric compared to hori-
zontal or vertical cross-sections through the learning
curves. Figure 2 shows two AL curves on the right
and corresponding AUC at two distinct points t
1
and
t
2
. Note that in practice, mAP
max
50
is not a quantity that
is known. Therefore, the AL experiment may be eval-
uated at any given vertical section of t training data
points. Knowing mAP
max
50
(or the 0.9 ·mAP
max
50
-mark
shown in Fig. 2) may lead to wrong conclusions in
the presented case which is taken from the scenario in
Fig. 5. Ending the experiment at t
1
clearly determines
the red curve (which also has a higher AUC) as prefer-
able. Ending the experiment at t
2
favors blue by just
looking at the current mAP
50
. However, the AUC still
favors red, since it takes the complete AL curve into
account. This is in line with our qualitative judgement
of the curves when regarded up to t
2
. We use AUC for
calculating rank correlations in Section 4.
4 EXPERIMENTS
In this section, we present results of experiments
with our sandbox environment as well as established
datasets, namely Pascal VOC and BDD100k, in the
following abbreviated as VOC and BDD. We do so
by presenting AL curves, summarizing benchmark
results and discussing our observations for different
evaluation metrics. We then show quantitatively that
our sandbox results generalize to the same extent to
VOC and BDD as results obtained on those datasets
generalize between each other. In other words, we
demonstrate the dataset-wise representativity of the
results obtained by our sandbox. Afterwards, this
is complemented by a study on the computational
Table 3: Maximum mAP
50
values achieved by the models
in Table 2 on the respective datasets (standard-size detectors
on VOC and BDD; sandbox-size on (E)MNIST-Det). The
entire available training data is used.
YOLOv3 RetinaNet Faster R-CNN
MNIST-Det 0.962 0.908 0.937
EMNIST-Det 0.959 0.919 0.928
Pascal VOC 0.794 0.748 0.797
BDD100k 0.426 0.464 0.525
speedup achieved.
Implementation. We implemented our pipeline in
the open source MMDetection (Chen et al., 2019)
toolbox. In our experiments for VOC, U initially con-
sists of “2007 train” + “2012 trainval” and we evalu-
ate performance on the “2007 test”-split. When track-
ing validation performance to assure convergence, we
evaluate on “2007 val”. Since BDD is a hard detec-
tion problem, we filtered frames with “clear” weather
condition at “daytime” from the “train” split as ini-
tial pool U yielding 12,454 images. We apply the
same filter to the “val” split and divide it in half to get
a test dataset (882 images for performance measure-
ment) and a validation dataset (882 images for con-
vergence tracking). For the (E)MNIST-Det datasets
we generated 20,000 train images, 500 validation im-
ages and 2,000 test images. For reference, we collect
in Table 3 the achieved performance of the respective
models for each dataset which determines the 90%
mark investigated in our experiments.
Benchmark Results. We first investigate differences
in AL results w.r.t. the datasets where we fix the de-
tector. This comparison uses the YOLOv3 detector on
Pascal VOC, BDD100k and our EMNIST-Det dataset.
We investigate the five query methods described in
Section 3. We obtain AL curves averaged over four
random seeds and evaluated in terms of queried im-
ages as well as in terms of queried boxes, respec-
tively. Fig. 5 shows the AL curves with shaded re-
gions indicating point-wise standard deviations ob-
tained by four averaged runs each. The top row shows
performance according to queried images while the
bottom row shows the same curves but according
to queried boxes. We observe that the uncertainty-
based query strategies tend to consistently outperform
the Random query in image-wise evaluation. How-
ever, when regarding the number of queried bounding
boxes, the separation vanishes or is far less clear. For
EMNIST-Det, the difference between the Random
and the uncertainty-based queries decreases substan-
tially, such that only a small difference in box-wise
evaluation is visible. For VOC and BDD, the Ran-
dom baseline falls roughly somewhere in-between the
uncertainty baselines in box-wise evaluation. This in-
dicates that greedy acquisition with highest sum of
VISAPP 2024 - 19th International Conference on Computer Vision Theory and Applications
370

500 1000 1500 2000
0.45
0.50
0.55
0.60
0.65
0.70
0.75
Pascal VOC mAP
50
Random
Entropy
Probability Margin
MC Dropout
Mutual Information
2000 4000
2000 3000 4000 5000 6000
0.275
0.300
0.325
0.350
0.375
0.400
BDD100k mAP
50
25000 50000 75000 100000 125000
200 400 600 800
# Images
0.4
0.5
0.6
0.7
0.8
0.9
EMNIST-Det mAP
50
500 1000 1500 2000
# Bounding Boxes
Figure 5: Comparison of YOLOv3 AL curves on three dif-
ferent datasets.
uncertainty tends to prioritize images with a large
amount of ground truth boxes. Obtaining a large
number of training signals improves detection perfor-
mance in these cases, while giving rise to a higher
annotation cost in the bottom panels. From this obser-
vation, we conclude that comparing AL curves based
only on the number images gives an incomplete im-
pression of performance and annotation costs. Ad-
ditionally, instance-wise evaluation should be consid-
ered. We attribute the smoother curve progression in
EMNIST-Det and VOC compared with BDD to the
fact that BDD is a far more complicated detection
problem with many small objects. However, the AL
curve fluctuations on BDD tend to average out in the
AUC metric. This becomes clear in light of results in
the following section, where we study generalization
across datasets.
In Table 4 we show additional results. For each
detector to reach 0.9 ·mAP
max
50
, the table shows the
number of images required, resp. the number of boxes
per method. We see the rankings often favor the
Entropy baseline, however, the overall rankings are
rather unstable throughout the table. Note in partic-
ular, that for (arguably the hardest detection prob-
lem) BDD, Random beats the Mutual Information for
YOLOv3. The same goes for the experiment using
RetinaNet for Pascal VOC. In the analog setting for
Faster R-CNN the image-wise margin of the Mutual
Information merely becomes slim. This observation
also holds for box-wise evaluation and is more pro-
nounced. In six cases, Random beats some informed
method. We conclude that in order to assess the via-
bility of a method, AL curves should be viewed from
both angles: performance over number of images and
over number of boxes queried.
Generalization of Sandbox Results. Instead of eval-
uating the pure performance at each AL step we
have proposed computing the corresponding AUC as
a more robust metric of AL performance. With re-
spect to the final method ranking at mAP
max
50
, we com-
pute Spearman rank correlations with the mAP
50
met-
ric at each point t. We compare these with the anal-
ogous correlations with the respective AUC at each
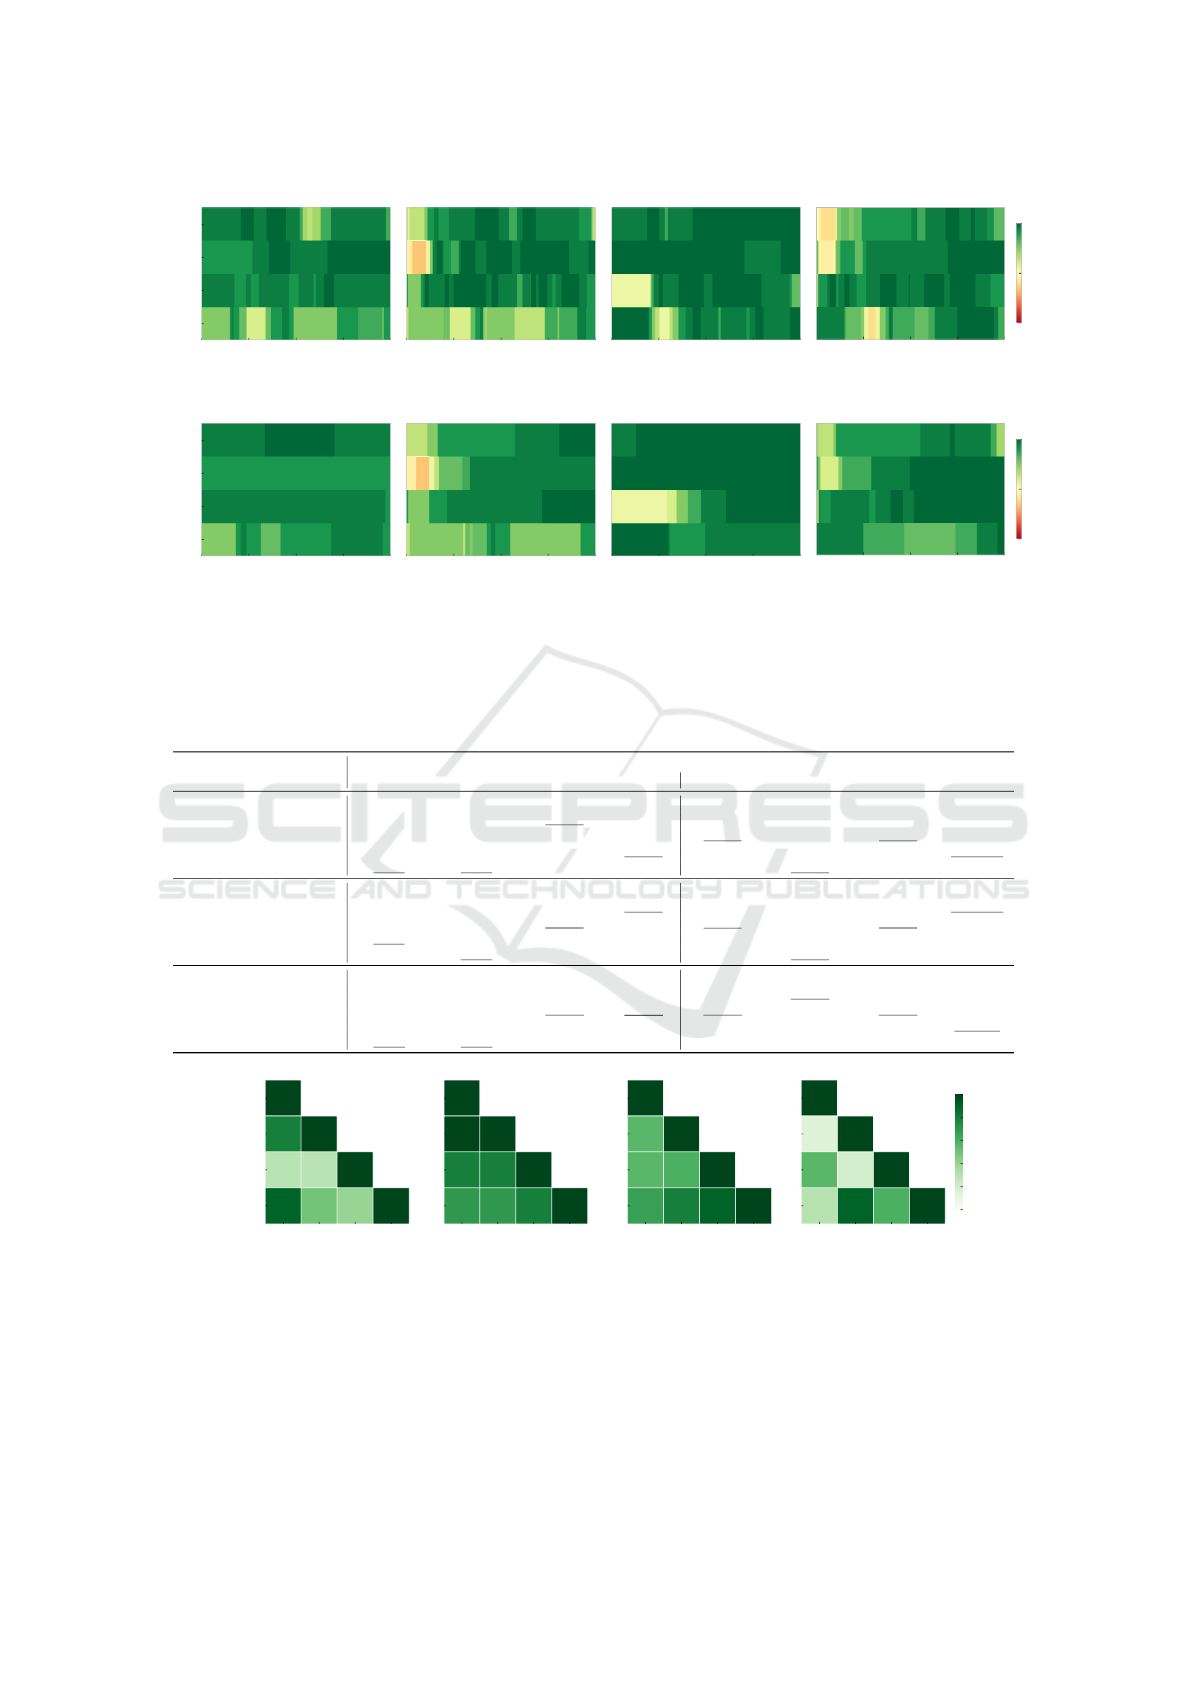
point. Fig. 6 shows intensity diagrams representing
the rank correlations both, in terms of image-wise and
box-wise evaluation. The t-axes are normalized to the
maximum number of images, resp. bounding boxes
queried, color indicates the Spearman correlation of
the rankings. In Fig. 6 both, mAP
50
and AUC show
overall high correlation with the method ranking, es-
pecially towards the end of the curves. We see that
the correlations for AUC fluctuates far less. More-
over, the average correlation across entire AL curves
tends to be larger for AUC than mAP
50
. Note that
the final ranking of either method does not need to
be perfectly correlated with the mAP
max
50
-ranking for
two reasons. Firstly, the latter does not take into con-
sideration early performance gains and secondly, the
mAP
max
50
-ranking is a horizontal section through the
curves while mAP
50
and AUC are vertical sections.
We conclude that AUC tends to be highly correlated
with the mAP
max
50
-ranking and is more stable w.r.t. t
than mAP
50
.
Next, we study comparability of AL experiments
between the sandbox setting and full-complexity
problems (VOC and BDD). To this end, we consider
the cross-dataset correlations of the AUC score when
fixing the detection architecture. Fig. 7 shows cor-
relation matrices for image- and instance-wise eval-
uation on the left for the YOLOv3 detector. VOC-
BDD correlations tend to be similar to EMNIST-Det-
VOC and EMNIST-Det-BDD correlations in image-
wise evaluation. However, when correcting for vari-
ance in instance-count per image in box-wise evalua-
tion on the right, we find correlations are generally
high. In particular, results for BDD and VOC are
roughly equally correlated with results on any other
dataset. We conclude that comparing methods in the
simplified setting yields a similar amount of informa-
tion about relative performances of AL as the full-
complexity setting.
Towards Rapid Prototyping and Comparability in Active Learning for Deep Object Detection
371
0 25 50 75 100
# Images in %
MNIST
EMNIST
VOC
BDD
Min: 0.2, Avg: 0.814
0 25 50 75 100
# Boxes in %
Min: -0.3, Avg: 0.759
0 25 50 75 100
# Images in %
Min: 0.0, Avg: 0.885
0 25 50 75 100
# Boxes in %
Min: -0.2, Avg: 0.789
−1
0
1
(a) mAP
50
0 25 50 75 100
# Images in %
MNIST
EMNIST
VOC
BDD
Min: 0.5, Avg: 0.847
0 25 50 75 100
# Boxes in %
Min: -0.3, Avg: 0.729
0 25 50 75 100
# Images in %
Min: 0.1, Avg: 0.883
0 25 50 75 100
# Boxes in %
Min: 0.2, Avg: 0.826
−1
0
1
(b) AUC
Figure 6: Intensity diagrams of rank correlations between the mAP
50
, resp. cumulative AUC and the final rankings obtained
at the 0.9 ·mAP
max
50
-mark. Left: YOLOv3; Right: Faster R-CNN.
Table 4: Amount of queried images and bounding boxes necessary to cross the 90% performance mark during AL. Lower
values are better. Bold numbers indicate the lowest amount of data per experiment and underlined numbers are the second
lowest.
# queried images # queried bounding boxes
MNIST-Det EMNIST-Det Pascal VOC BDD100k MNIST-Det EMNIST-Det Pascal VOC BDD100k
YOLOv3
Random 327.9 595.6 2236.8 5871.2 1079.1 1825.3 5344.2 116362.1
Entropy 245.5 398.8 1732.8 5389.3 1004.9 1583.0 4695.4 110694.9
Prob. Margin 256.2 429.0 1858.5 4895.2 1013.7 1617.1 4787.6 100376.3
MC Dropout 256.3 416.2 1679.4 5200.5 1115.3 1671.6 4875.1 110427.6
Mutual Inf. 249.8 399.5 1884.2 5912.9 1061.9 1602.7 5527.0 125050.1
Faster R-CNN
Random 450.0 843.4 1293.7 6434.3 2140.0 2891.7 3125.2 129219.0
Entropy 384.5 561.6 1030.6 5916.7 1608.4 2156.4 2707.0 123008.6
Prob. Margin 408.7 626.2 1036.5 5761.6 1622.9 2285.1 2711.6 117889.3
MC Dropout 390.5 647.4 1127.5 6296.4 1818.1 2773.8 3624.7 130533.8
Mutual Inf. 395.3 572.6 1080.2 6385.7 1695.6 2235.3 3026.5 132855.7
RetinaNet
Random 390.3 950.4 2555.4 3616.2 1283.8 2957.7 6220.0 69842.0
Entropy (sum) 288.6 687.7 1961.2 2866.5 1292.0 2708.6 5421.6 64939.7
Prob. Margin (sum) 310.8 733.9 2087.3 2901.5 1277.5 2721.5 5445.6 64794.9
MC Dropout (sum) 293.3 749.6 2745.3 3027.7 1317.4 2926.4 7047.9 62395.5
Mutual Inf. (sum) 289.6 719.0 2881.9 3124.9 1248.0 2677.4 7389.0 61712.9
MNIST-Det
EMNIST-Det
BDD100k
Pascal VOC
MNIST-Det
EMNIST-Det
BDD100k
Pascal VOC
1
0.8 1
0.3 0.3 1
0.9 0.5 0.4 1
MNIST-Det
EMNIST-Det
BDD100k
Pascal VOC
1
1 1
0.8 0.8 1
0.7 0.7 0.8 1
(a) YOLOv3
MNIST-Det
EMNIST-Det
BDD100k
Pascal VOC
1
0.56 1
0.56 0.6 1
0.67 0.8 0.9 1
MNIST-Det
EMNIST-Det
BDD100k
Pascal VOC
1
0.15 1
0.56 0.2 1
0.31 0.9 0.6 1
0.0
0.2
0.4
0.6
0.8
1.0
Spearman Correlation
(b) Faster R-CNN
Figure 7: Ranking correlations between AUC values for YOLOv3 and Faster R-CNN. Left: Image-wise; Right: Instance-wise
evaluation.
VISAPP 2024 - 19th International Conference on Computer Vision Theory and Applications
372
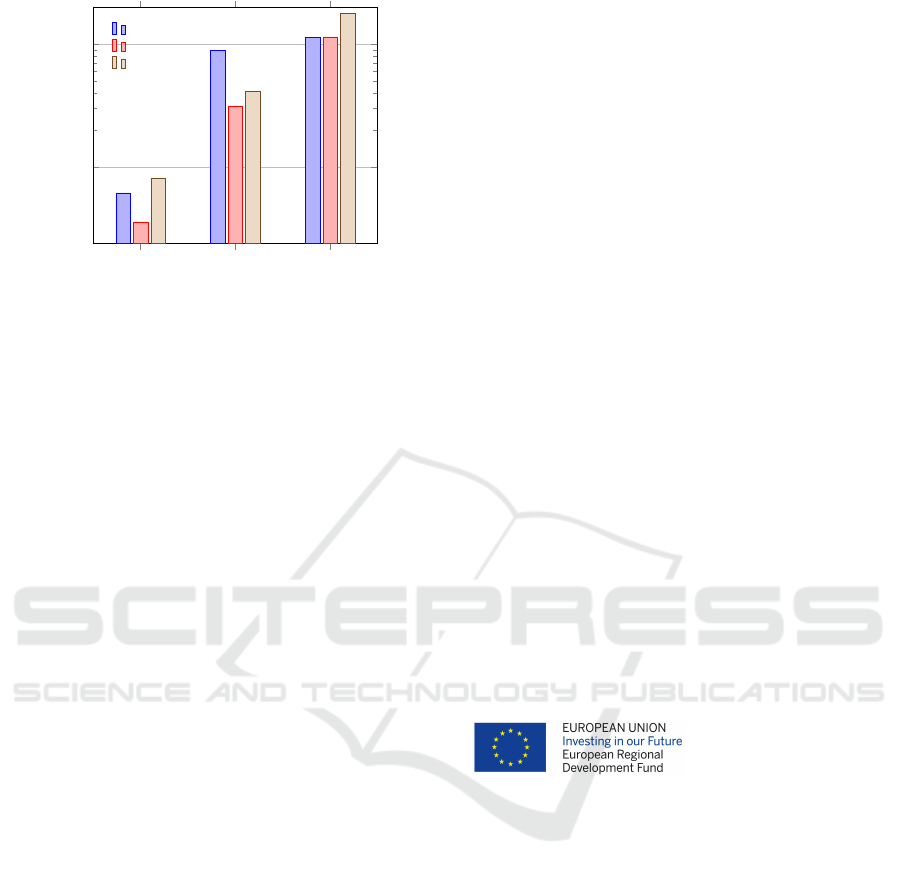
EMNIST-Det Pascal VOC BDD100k
1
10
time in hours
YOLOv3
RetinaNet
Faster R-CNN
0.62
0.36
0.82
8.91
3.16
4.15
11.43
11.48
17.87
Figure 8: Utilized time for one AL step (training to conver-
gence + query evaluation) for investigated settings in hours.
Compute Time. AL for advanced image percep-
tion tasks tends to be highly time intensive, compute-
heavy and energy consuming. This is due to the fact
that at each AL step the model should be guaran-
teed to fit to convergence and there are multiple steps
of several random seeds to be executed. Fig. 8 on
the right shows the time per AL step used in our
setting when run on a Nvidia Tesla V100-SXM2-
16GB GPU with a batch size of four. The time-
axis is scaled logarithmically, so the experiments on
EMNIST-Det are always faster by at least half an or-
der of magnitude. Training of YOLOv3 on VOC
does not start from COCO-pretrained weights (like
YOLOv3+BDD) since the two datasets VOC and
COCO are highly similar. In this case, we opt for
an ImageNet (Russakovsky et al., 2015)-pretrained
backbone like for the other detectors. Overall, we
save time up to a factor of around 14 for VOC and
around 32 for the BDD dataset. Translated to AL in-
vestigations, this means that the effects of new query
strategies can be evaluated within half a day on a sin-
gle Nvidia Tesla V100-SXM2-16GB.
5 CONCLUSION
In this work, we investigated the possibility of simpli-
fying the active learning setting in object detection to
accelerate development and evaluation. We found that
for a given detector, active learning results, in partic-
ular on instance level, generalize well between differ-
ent datasets, including (E)MNIST-Det. Particularly,
we find a representative degree of result comparabil-
ity between our sandbox datasets and full-complexity
active learning. In our evaluation, we included a more
direct measurement of annotation effort in counting
the number of boxes in addition to queried images.
Meanwhile, we can save more than an order of mag-
nitude in total compute time by the down-scaling
of the detector and reducing the dataset complexity.
Our environment allows for consistent benchmarking
of active learning methods in a unified framework,
thereby improving transparency. We hope that the
present sandbox environment, findings and configu-
rations along with the implementation will lead to
further and accelerated progress in the field of active
learning for object detection.
ACKNOWLEDGMENTS
The research leading to these results is funded by
the German Federal Ministry for Economic Af-
fairs and Climate Action” within the projects “KI-
Absicherung - Safe AI for Automated Driving”, grant
no. 19A19005R and “KI Delta Learning - Scalable
AI for Automated Driving”, grant no. 19A19013Q as
well as by the German Federal Ministry for Education
and Research within the project “UnrEAL” grant no.
01IS22069. We thank the consortia for the success-
ful cooperation. We gratefully acknowledge financial
support by the state Ministry of Economy, Innovation
and Energy of Northrhine Westphalia (MWIDE) and
the European Fund for Regional Development via the
FIS.NRW project BIT-KI, grant no. EFRE-0400216.
The authors gratefully acknowledge the Gauss Cen-
tre for Supercomputing e.V. for funding this project
by providing computing time through the John von
Neumann Institute for Computing on the GCS Super-
computer JUWELS at J
¨
ulich Supercomputing Centre.
REFERENCES
Bouguelia, M.-R., Bela
¨
ıd, Y., and Bela
¨
ıd, A. (2015). Identi-
fying and mitigating labelling errors in active learning.
In International Conference on Pattern Recognition
Applications and Methods, pages 35–51. Springer.
Bouguelia, M.-R., Nowaczyk, S., Santosh, K., and Verikas,
A. (2018). Agreeing to disagree: Active learning
with noisy labels without crowdsourcing. Interna-
tional Journal of Machine Learning and Cybernetics,
9(8):1307–1319.
Brust, C.-A., K
¨
ading, C., and Denzler, J. (2018). Active
learning for deep object detection. arXiv preprint
arXiv:1809.09875.
Budd, S., Robinson, E. C., and Kainz, B. (2021). A survey
on active learning and human-in-the-loop deep learn-
ing for medical image analysis. Medical Image Anal-
ysis, 71:102062.
Chen, K., Wang, J., Pang, J., Cao, Y., Xiong, Y., Li, X.,
Sun, S., Feng, W., Liu, Z., Xu, J., Zhang, Z., Cheng,
Towards Rapid Prototyping and Comparability in Active Learning for Deep Object Detection
373

D., Zhu, C., Cheng, T., Zhao, Q., Li, B., Lu, X., Zhu,
R., Wu, Y., Dai, J., Wang, J., Shi, J., Ouyang, W., Loy,
C. C., and Lin, D. (2019). MMDetection: Open mm-
lab detection toolbox and benchmark. arXiv preprint
arXiv:1906.07155.
Choi, J., Elezi, I., Lee, H.-J., Farabet, C., and Alvarez,
J. M. (2021). Active learning for deep object detec-
tion via probabilistic modeling. In Proceedings of the
IEEE/CVF International Conference on Computer Vi-
sion, pages 10264–10273.
Cohen, G., Afshar, S., Tapson, J., and Van Schaik, A.
(2017). Emnist: Extending mnist to handwritten let-
ters. In 2017 international joint conference on neural
networks (IJCNN), pages 2921–2926. IEEE.
Desai, S. V., Lagandula, A. C., Guo, W., Ninomiya, S., and
Balasubramanian, V. N. (2019). An adaptive supervi-
sion framework for active learning in object detection.
In Sidorov, K. and Hicks, Y., editors, Proceedings
of the British Machine Vision Conference (BMVC),
pages 177.1–177.13. BMVA Press.
Elezi, I., Yu, Z., Anandkumar, A., Leal-Taix
´
e, L., and Al-
varez, J. M. (2022). Not all labels are equal: Rational-
izing the labeling costs for training object detection.
In Proceedings of the IEEE/CVF Conference on Com-
puter Vision and Pattern Recognition (CVPR), pages
14492–14501.
Everingham, M., Van Gool, L., Williams, C. K. I., Winn,
J., and Zisserman, A. (2010). The pascal visual ob-
ject classes (voc) challenge. International Journal of
Computer Vision, 88(2):303–338.
Gal, Y. and Ghahramani, Z. (2016). Dropout as a bayesian
approximation: Representing model uncertainty in
deep learning. In international conference on machine
learning, pages 1050–1059. PMLR.
Gal, Y., Islam, R., and Ghahramani, Z. (2017). Deep
bayesian active learning with image data. In Interna-
tional Conference on Machine Learning, pages 1183–
1192. PMLR.
Haussmann, E., Fenzi, M., Chitta, K., Ivanecky, J., Xu, H.,
Roy, D., Mittel, A., Koumchatzky, N., Farabet, C., and
Alvarez, J. M. (2020). Scalable active learning for ob-
ject detection. In 2020 IEEE intelligent vehicles sym-
posium (iv), pages 1430–1435. IEEE.
LeCun, Y., Bottou, L., Bengio, Y., and Haffner, P. (1998).
Gradient-based learning applied to document recogni-
tion. Proceedings of the IEEE, 86(11):2278–2324.
Li, M. and Sethi, I. K. (2006). Confidence-based active
learning. IEEE transactions on pattern analysis and
machine intelligence, 28(8):1251–1261.
Lin, T.-Y., Goyal, P., Girshick, R., He, K., and Doll
´
ar, P.
(2017). Focal loss for dense object detection. In
Proceedings of the IEEE international conference on
computer vision, pages 2980–2988.
Lin, T.-Y., Maire, M., Belongie, S., Hays, J., Perona, P.,
Ramanan, D., Doll
´
ar, P., and Zitnick, C. L. (2014).
Microsoft coco: Common objects in context. In Euro-
pean conference on computer vision, pages 740–755.
Springer.
Netzer, Y., Wang, T., Coates, A., Bissacco, A., Wu, B., and
Ng, A. Y. (2011). Reading digits in natural images
with unsupervised feature learning.
Papadopoulos, D. P., Uijlings, J. R., Keller, F., and Ferrari,
V. (2017). Training object class detectors with click
supervision. In Proceedings of the IEEE Conference
on Computer Vision and Pattern Recognition, pages
6374–6383.
Redmon, J. and Farhadi, A. (2018). Yolov3: An incremental
improvement. arXiv preprint arXiv:1804.02767.
Ren, S., He, K., Girshick, R., and Sun, J. (2015). Faster
r-cnn: Towards real-time object detection with region
proposal networks. Advances in neural information
processing systems, 28.
Roy, S., Unmesh, A., and Namboodiri, V. P. (2018).
Deep active learning for object detection. In BMVC,
page 91.
Russakovsky, O., Deng, J., Su, H., Krause, J., Satheesh,
S., Ma, S., Huang, Z., Karpathy, A., Khosla, A.,
Bernstein, M., Berg, A. C., and Fei-Fei, L. (2015).
ImageNet Large Scale Visual Recognition Challenge.
International Journal of Computer Vision (IJCV),
115(3):211–252.
Schmidt, S., Rao, Q., Tatsch, J., and Knoll, A. (2020).
Advanced active learning strategies for object detec-
tion. In 2020 IEEE Intelligent Vehicles Symposium
(IV), pages 871–876. IEEE.
Settles, B. (2009). Active learning literature survey. Com-
puter Sciences Technical Report 1648, University of
Wisconsin–Madison.
Subramanian, A. and Subramanian, A. (2018). One-click
annotation with guided hierarchical object detection.
arXiv preprint arXiv:1810.00609.
Tsvigun, A., Shelmanov, A., Kuzmin, G., Sanochkin, L.,
Larionov, D., Gusev, G., Avetisian, M., and Zhukov,
L. (2022). Towards computationally feasible deep ac-
tive learning. In Carpuat, M., de Marneffe, M.-C.,
and Meza Ruiz, I. V., editors, Findings of the Asso-
ciation for Computational Linguistics: NAACL 2022,
pages 1198–1218, Seattle, United States. Association
for Computational Linguistics.
Yoo, D. and Kweon, I. S. (2019). Learning loss for active
learning. In Proceedings of the IEEE/CVF conference
on computer vision and pattern recognition, pages 93–
102.
Younesian, T., Epema, D., and Chen, L. Y. (2020). Active
learning for noisy data streams using weak and strong
labelers. arXiv preprint arXiv:2010.14149.
Younesian, T., Zhao, Z., Ghiassi, A., Birke, R., and Chen,
L. Y. (2021). Qactor: Active learning on noisy la-
bels. In Asian Conference on Machine Learning,
pages 548–563. PMLR.
Yu, F., Chen, H., Wang, X., Xian, W., Chen, Y., Liu, F.,
Madhavan, V., and Darrell, T. (2020). Bdd100k: A
diverse driving dataset for heterogeneous multitask
learning. In Proceedings of the IEEE/CVF conference
on computer vision and pattern recognition, pages
2636–2645.
Yuan, T., Wan, F., Fu, M., Liu, J., Xu, S., Ji, X., and Ye,
Q. (2021). Multiple instance active learning for ob-
ject detection. In Proceedings of the IEEE/CVF Con-
ference on Computer Vision and Pattern Recognition,
pages 5330–5339.
Zhan, X., Wang, Q., Huang, K.-h., Xiong, H., Dou, D., and
Chan, A. B. (2022). A comparative survey of deep
active learning. arXiv preprint arXiv:2203.13450.
VISAPP 2024 - 19th International Conference on Computer Vision Theory and Applications
374
