
Monitoring Pain in Patients with Chronic Pain with a Wearable
Wristband in Daily Life: A Pilot Study
E. Pattyn
1,2
, E. Vergaelen
3
, E. Lutin
2
, R. Van Stiphout
4
, H. Davidoff
1,2
, W. De Raedt
2
and C. Van Hoof
1,2,4
1
Department of Electrical Engineering, KU Leuven, Leuven, Belgium
2
Imec, Leuven, Belgium
3
Center for Mind-Body Research, KU Leuven, Leuven, Belgium
4
OnePlanet Research Centre, Wageningen, The Netherlands
Keywords: Chronic Pain, Machine Learning, Physiological Signals, Pain Classification.
Abstract: Chronic pain is a complex and personal condition that imposes a substantial burden on both individuals and
society. Potentially, wearable technology could enable continuous monitoring of pain in real-world settings,
offering insights into the complex relationship between physiological states and chronic pain. In this pilot
study, we evaluated the practicability of collecting physiological data, from ten individuals with chronic pain
and ten healthy controls, using wearable wristbands and digital pain diaries for one week in their everyday
lives. Additionally, we trained various machine learning classifiers to classify pain levels and evaluated which
feature modalities, e.g., heart rate-derived features, yielded the highest balanced accuracy. Our results
demonstrated satisfactory data quantity, with wristband data being available for patients and controls
approximately 92% to 82% of the time, and data quality, with high-quality physiology ranging from 80% to
72% for the respective groups. The median balanced accuracies in distinguishing pain intensity classes ranged
between 0.27 and 0.40. Furthermore, we found that individual modalities did not outperform the combined
modalities. Nonetheless, further research with larger sample sizes is necessary to elucidate these relationships
and improve pain management strategies for individuals with chronic pain.
1 INTRODUCTION
Pain is defined by the International Association for
the Study of Pain (IASP) as “An unpleasant sensory
and emotional experience associated with, or
resembling that associated with, actual or potential
tissue damage.” Chronic pain is pain that persists or
reoccurs for minimally three months and affects about
20% of the global population (IASP, 2018). It is
characterized by pronounced emotional distress, e.g.,
anxiety, and a decline in functional ability (ICD-11,
2023). Furthermore, chronic pain is associated with
significant productivity loss and increased healthcare
costs (Mayer et al., 2019).
Pain can be assessed by using verbal self-report,
questionnaire-based self-report, or physiological
signal monitoring (Fernandez Rojas et al., 2023).
Among these approaches, verbal self-report is the
gold standard in clinical assessment due to its
simplicity and speed, although it relies on the
patient’s memory. To mitigate recall bias,
questionnaire-based self-reports like pain diaries or
ecological momentary assessment (EMA) enable
prolonged pain tracking (Gendreau et al., 2003).
However, a trade-off exists between comprehending
pain dynamics and the effort needed to complete the
questionnaire. Alternatively, pain could be monitored
by physiological signals. This approach assumes that
acute pain triggers a physiological stress response,
characterized by an increase in sympathetic autono-
mous nervous system (ANS) activation and a decrease
in parasympathetic ANS activation. Consequently,
observable changes such as increased heart rate (HR),
increased skin conductivity (SC), elevated blood
pressure, and muscle tension occur (Koenig and
Thayer, 2016). Some of these physiological
parameters, like SC and HR, can be monitored using
wearable sensors (Storm, 2008; Loggia et al., 2011).
However, it is important to note that these physiolo-
gical signals are not exclusive to pain but also correlate
with other types of arousal (Schmidt et al., 2019).
Existing research has indicated that patients with
chronic pain often exhibit a dysregulation of the ANS,
characterized by increased tonic sympathetic activity
330
Pattyn, E., Vergaelen, E., Lutin, E., Van Stiphout, R., Davidoff, H., De Raedt, W. and Van Hoof, C.
Monitoring Pain in Patients with Chronic Pain with a Wearable Wristband in Daily Life: A Pilot Study.
DOI: 10.5220/0012315300003657
Paper published under CC license (CC BY-NC-ND 4.0)
In Proceedings of the 17th International Joint Conference on Biomedical Engineering Systems and Technologies (BIOSTEC 2024) - Volume 2, pages 330-339
ISBN: 978-989-758-688-0; ISSN: 2184-4305
Proceedings Copyright © 2024 by SCITEPRESS – Science and Technology Publications, Lda.

and/or decreased parasympathetic tone (Koenig et al.,
2016). Nevertheless, the robustness of this evidence
varies depending on the specific type of chronic pain
(Wyns et al., 2023). Furthermore, there is evidence
for a blunted physiological stress response after active
psychosocial, mental, or physical stress induction in
patients with chronic pain (Nilsen et al., 2007; Van
Middendorp et al., 2013; Coppens et al., 2018), which
indicates reduced autonomic flexibility and
adaptability (Reyes del Paso et al., 2021). The extent
of the blunting varies depending on the type of
chronic pain and is most pronounced in chronic
widespread pain, while other types exhibit moderate or
even absent blunting. Moreover, the exact
physiological and biological mechanisms between the
stress response and pain remain unknown (Wyns et al.,
2023).
The monitoring of acute pain using physiological
signals has already been researched. For example,
thermal heat pain (Jang et al., 2012; Gruss et al., 2015;
Lopez-Martinez and Picard, 2018; Thiam et al., 2019;
Werner et al., 2019; Kong et al., 2021; Gouverneur et
al., 2023), electrical pain (Jiang et al., 2019; Werner
et al., 2019; Kong et al., 2021), and pressure pain
(Jang et al., 2012) have been modeled with random
forests, support vector machines, neural networks,
and deep learning models. These models obtained
accuracies between 37-61% for 4- or 5-class pain
classification, 63-83% for 3-class pain classification,
74-94% for binary pain classification (Gruss et al.,
2015; Walter et al., 2015; Lopez-Martinez and Picard,
2018; Jiang et al., 2019; Thiam et al., 2019; Werner
et al., 2019; Kong et al., 2021; Gouverneur et al.,
2023), and an R² between 0.24-0.46 for regression
(Lopez-Martinez and Picard, 2018; Kong et al., 2021)
in a healthy population and controlled settings.
There are, to the best of our knowledge, no
previous studies that looked at daily-life pain
modeling based on wristband-captured physiological
data in patients with chronic pain as the primary
complaint. However, pain intensity has been
previously classified with 72.9% accuracy using
about 4 hours of physiological data, captured with the
Microsoft band 2, in 20 patients with sickle cell
anemia during a visit to the hospital. More
specifically, pain was questioned via an application
and additionally evaluated by an experienced nurse
(Johnson et al., 2019). More recently, Stojancic et al.
(2023) obtained an accuracy of 84.5% for classifying
pain in patients with sickle cell anemia during a vaso-
occlusive crisis with a random forest model based on
physiological data captured with an Apple watch of
about 2 hours. Finally, Moscato et al. (2022)
monitored pain in 21 patients with cancer with an
Empatica E4 wristband during virtual reality sessions
for four days in their daily lives and obtained an
accuracy of 73% for pain classification.
The objectives of the present study were two-fold.
First, this study aimed to evaluate the practicability,
i.e., the quantity and quality, of recording
physiological signals with a wearable wristband, in
conjunction with a digital pain diary, within the daily
lives of patients with chronic pain. Given the
heightened sensitization and notable fatigue
frequently experienced by these patients, evaluating
the practicality of this approach was important.
Secondly, we wanted to explore the classification of
acute pain intensity using wearable technology and
evaluate the relevance of the different feature
modalities as wearable sensors could provide a
convenient, non-invasive, and cost-efficient method
to monitor pain in daily life.
2 METHODS
2.1 Data Collection
This observational pilot study collected physiological
and pain diary data of ten patients with chronic pain
and ten healthy controls for 7 consecutive days from
September 2021 until November 2022. Patients were
recruited at the Psychiatry department of the
University Hospital of Leuven and included in their
second week of the functional disorders and somatic
mental disorders treatment program. Healthy controls
were recruited using flyers. The study criteria
required participants to be aged between 18 and 65
years, and patients required a diagnosis of chronic
pain. Healthy controls were excluded if they had any
functional, somatic, or psychiatric disorders, or if
they were taking medications that specifically
targeted the nervous system. Patients were excluded
if they were taking sympathomimetic drugs,
benzodiazepines, or if they had endocrinological or
neurological disorders known to influence the
physiological stress response. Initially, 23
participants were recruited. However, one patient
dropped out because they stopped treatment at the
hospital. Furthermore, two healthy controls dropped
out due to technical issues with the Empatica E4
(Empatica, Milano, Italy). The trial was approved by
the Ethical Committee of the UZ Leuven (S65126).
The study consisted of an intake session, in which
the informed consent was signed, eligibility criteria
were checked, demographic information was
collected, multiple questionnaires were completed,
and participants were briefed regarding the
Monitoring Pain in Patients with Chronic Pain with a Wearable Wristband in Daily Life: A Pilot Study
331

ambulatory monitoring. Specifically, participants
completed the Positive Negative Affect Scale
(PANAS), the Patient Health Questionnaire (PHQ)
containing the PHQ somatic symptom severity scale
(PHQ-15), the PHQ depressive symptom severity
scale (PHQ-9), and the Generalized Anxiety Disorder
scale (GAD-7), the Pain Sensitivity Questionnaire
(PSQ), the International Physical Activity
Questionnaire (IPAQ), the Pittsburgh Sleep Quality
Index (PSQI), and the 4-dimensional symptom
questionnaire (4DSQ) (Buysse et al., 1989; Craig et
al., 2003; Engelen et al., 2006; Terluin et al., 2008;
Donker et al., 2011; De Vroege et al., 2012; Van
Steenbergen-Weijenburg et al., 2015; Van Boekel et
al., 2020). The total scores of the questionnaires were
used to characterize the study population and detect
potential confounders. During the 7 days of
ambulatory monitoring, participants continuously
wore the Empatica E4 wristband on their non-
dominant wrist, with exceptions for showering,
charging the wristband, or synchronizing the data.
The Empatica E4 monitors photoplethysmography
(PPG) at 64 Hz, electrodermal activity (EDA) at 4 Hz,
skin temperature at 1 Hz, three-axis accelerometery
(ACC) at 32 Hz, and the HR from the PPG signal at
1 Hz. Additionally, the participants received a pain
diary prompt every hour between 8 a.m. and 10 p.m.
on their smartphones via m-Path (Mestdagh et al.,
2022). The diary involved reporting momentary and
hourly pain and stress levels on an 11-point numeric
rating scale (NRS) scale, their activity level (1: lying,
2: sitting, 3: standing, 4: walking, 5: cycling, 6:
running), and the location of their pain (open
question) if applicable. During the briefing, the
participants were instructed to complete the diary
promptly. However, to prevent disruption of therapy
sessions for the patients, participants were given an
hour to complete the diary (Schultchen et al., 2019).
2.2 Pre-Processing
Data preprocessing and feature extraction procedures
were conducted to ensure the quality of the collected
data. First, non-wear windows, in which the device
was on but was not worn, were identified and
removed. Non-wear detection occurred in rolling
two-second windows with a one-second step and was
empirically based on a combination of stationary
ACC (maximum difference lower than 0.1 g), low
EDA (median lower than 0.1 µS), and changing skin
temperature (mean absolute difference larger than
0.003°C). Subsequently, segments containing at least
5 minutes of consecutive non-wear sub windows were
removed to minimize the occurrence of false positives.
Next, the EDA signal was processed as
ambulatory EDA accommodates various types of
artifacts. Therefore, EDA was filtered using a 3
rd
-
order Savitzky-Golay (savgol) filter applied in 1-
second windows (Thammasan et al., 2020).
Additionally, for flat segments, which were
empirically defined as 5-second windows where 80%
of data points exhibited a difference smaller than 0.01
μS with their adjacent data points, a 2
nd
-order savgol
filter was applied to prevent overfitting in these
specific regions. Then, EDA quality was assessed in
rolling 5-second windows with a 1-second step,
employing an EDA-quality indicator developed
through transfer learning based on Gashi et al. (2020)
(Pattyn et al., 2023). EDA was afterward decomposed
into the phasic, driver, and tonic components using
Ledapy (Filetti, 2020) in 5-minute high-quality
windows, defined as having an average quality higher
than 80%. Before decomposition, low-quality
segments in high-quality windows were removed and
reconstructed by linear interpolation based on Pattyn
et al. (2023b). Additionally, SC responses were
detected in both the EDA and the phasic component,
using the response detector within EDAexplorer
(Taylor et al., 2015) with the minimal amplitude
threshold set to 0.02 µS.
Finally, a quality indicator for the PPG-derived
HR signal was computed as the PPG signal is also
susceptible to motion artifacts. The quality indicator
is based on the agreement of two internally retrained
and validated HR estimation algorithms: one in the
Table 1: Overview of the extracted features per data
modality.
Signal Features
HR from PPG Mean, median, std, IQR, min, max,
range, mean slope per minute, coverage
EDA Mean, median, std, IQR, min, max,
range, mean slope per minute,
coverage, responses per minute,
response amplitude, response width.
Phasic Mean, median, std, IQR, min, max,
range, responses per minute, response
amplitude, response width
Tonic, driver Mean, median, std, IQR, min, max,
range
Skin
temperature
Std, mean slope per minute, quality
ACC
ACC magnitude
Mean, std, median, range
Pain diary Momentary pain, momentary stress,
hourly pain, hourly stress
Demographic
information
Age, gender, BMI
HEALTHINF 2024 - 17th International Conference on Health Informatics
332

time domain (Fedjajevs et al., 2021) and one in the
frequency domain (Temko, 2017). Before HR
estimation, the PPG signal was filtered with a finite
impulse response low-pass filter. The threshold for
high quality was empirically set to an average SQI of
at least 50%. The ACC magnitude was calculated as
the square root of the sum of the squared signals from
the x, y, and z-axes and its standard deviation was
considered as an activity index (Smets et al., 2018).
2.3 Feature Extraction
To investigate if momentary pain is related to
momentary physiology, we centered and scaled the
signals within each participant, removed low-quality
EDA and HR data in 5-second windows, and
extracted features from the signals captured 10
minutes before the pain diary prompts (Table 1) (Can
et al., 2019; Schultchen et al., 2019). Prompts
containing less than 50% high-quality data were
excluded from the analysis to improve the data’s
reliability and enhance the model’s accuracy in
capturing meaningful patterns related to pain. The
EDA, tonic, and phasic features, with a right-skewed
distribution, were logarithmically transformed and
added to the feature dataset.
2.4 Data Analysis
Data were statistically modeled using R (R-4.2.0). To
assess differences between data collection-related
variables between patients and healthy controls, we
first used a Shapiro-Wilk test to check for a Gaussian
distribution. If the Shapiro-Wilk test was significant
(p-value<0.05), the median, interquartile range
(IQR), and Wilcoxon signed rank test output (W)
were reported. Otherwise, the mean, standard
deviation (SD), and t-test output (t) were reported.
Moreover, using the physiological and pain diary
features as input, we explored the classification of
pain by training a Random Forest (RF), XGBoost
(XGB), Supported Vector Machine classification
(SVM), k-nearest neighbors (kNN), and logistic
classification model as these classifiers have been
proven to be effective in previous research (Lopez-
Martinez and Picard, 2018; Gouverneur et al., 2023).
Before modeling, we reclassified pain into four
intensity classes: no pain (NRS: 0), mild pain (NRS:
1-3), moderate pain (NRS: 4-6), and high pain (NRS:
7-10) to improve class balance (Table 2) (Johnson et
al., 2019; Treede et al., 2019). Furthermore, we
removed features that had a positive or negative
correlation higher than 0.95 with other features before
training the classifiers and standardized the remaining
features (Gruss et al., 2015). All classifiers were
trained using the scikit-learn library in Python 3.8.10.
Within the training phase, the model hyperparameters
(Table 3) were optimized using 5-fold cross-
validation. To test the trained classifiers, we opted for
leave-one-subject-out cross-validation and evaluated
the classifier’s performance on the test data using
both accuracy and balanced accuracy. The test scores
were summarized independently for the tested patient
and the healthy control group, as well as for both
groups combined.
Table 2: The class distribution within the patient, healthy
control, and both groups.
Number of
data points
No
pain
Mild
pain
Moderate
pain
Severe
pain
Total
Patients 29 168 285 184 666
Healthy
controls
402 78 3 0 483
Total 431 246 288 184 1149
Table 3: Chosen hyperparameter ranges per classifier.
Model Hyperparameters
RF criterion: gini, entropy – min_samples_split:
2, 4, 8 – n_estimators: 20, 50, 100, 200
XGB learning_rate: 0.1, 0.01, 0.05 – max_depth:
2, 4, 8 – n_estimators: 20, 50, 100, 200
SVM kernel: linear, rbf, sigmoid – C: 0.1, 1, 10,
100, 1000 – gamma: 1, 0.1, 0.001, 0.0001
kNN n_neighbors: 3, 5, 7, 9, 11
Logistic
regression
C: 0.1, 1, 10, 100, 1000 – penalty: l1, l2,
elasticnet
Finally, we evaluated the different feature
modalities, i.e., HR, EDA, ACC, skin temperature-
derived features, and all modalities combined, and
evaluated the balanced accuracy for pain
classification (Werner et al., 2019). Therefore, we
retrained the best-performing classifier in terms of
balanced accuracy separately for the patient and the
healthy control group, as we wanted to investigate if
different feature modalities would be relevant for
both groups.
3 RESULTS
3.1 Data Collection
Table 4 gives an overview of the demographics, pain
diary, and total questionnaire scores per group.
Groups significantly differed in age and all pain diary
items except the activity item. The median reported
Monitoring Pain in Patients with Chronic Pain with a Wearable Wristband in Daily Life: A Pilot Study
333

Table 4: Demographic, pain diary, and questionnaire scores per group: mean (M), median (Mdn), standard deviation (SD),
interquartile range (IQR), Wilcoxon signed rank (W), and t-test statistic (t), Chi-square test statistic (χ
2
).
Parameter Patients Healthy controls Test-statistic p-value
Demographic items
Age - Mdn(IQR) 48 (16) 27 (9) W= 17.5 0.015
BMI - M(SD) 27 (6) 24 (4) t = -1.3134 0.207
Gender - %women 80% 70% χ
2
= 0 1
Pain diary items
Momentary pain - Mdn(IQR) 5 (3) 0 (0) W = 0 <0.001
Hourly pain - Mdn(IQR) 5 (3) 0 (0) W = 0 <0.001
Momentary stress - Mdn(IQR) 3 (3) 0 (1) W = 7.5 0.001
Hourly stress - Mdn(IQR) 4 (3) 0 (1) W = 6.5 <0.001
Pain locations - Mdn(IQR) 5 (3) 0 (1) W = 1 <0.001
Momentary activity - Mdn(IQR) 3 (1) 3 (1) W = 55 0.681
Questionnaires
PSQI score - M(SD) 12 (4) 5 (3) t = -4.3765 <0.001
PHQ-15 - M(SD) 16 (3) 5 (4) t = -7.137 <0.001
PHQ-9- Mdn(IQR) 19 (3) 2 (3) W = 0 <0.001
GAD-7 - M(SD) 12 (2) 3 (2) t = -10.119 <0.001
PSQ score - M(SD) 5 (2) 3 (1) t = -3.2976 0.007
IPAQ category
a
- Mdn(IQR) 1 (1)
a
3 (1) W = 87 0.003
PA score - M(SD) 10 (6) 37 (6) t = 6.3488 <0.001
NA score - M(SD) 31 (7) 14 (2) t = -7.9753 <0.001
4DSQ distress - M(SD) 20 (4) 6 (3) t = -14.638 <0.001
4DSQ fear - Mdn(IQR) 10 (1) 0 (8) W = 0.5 <0.001
4DSQ depression - Mdn(IQR) 11 (5) 0 (0) W = 0 <0.001
4DSQ somatization - M(SD) 27 (4) 5 (3) t = -9.1972 <0.001
a
IPAQ category - 1: low, 2: medium, 3: high physical activity
momentary and hourly pain score was 5 (IQR: 3) for
the patients and 0 (IQR: 0) for the healthy controls
(HC). Furthermore, patients also reported higher
median momentary and hourly stress scores than the
healthy controls. All the total questionnaire scores
were significantly different between the two groups.
Table 5 shows that patients and healthy controls
collected a median of 155 hours (92.2%) and 137
hours (81.5%), respectively, with healthy controls
exhibiting higher within-group variation. In both
groups, about 87% of the collected data contained
high-quality HR and about 85% high-quality EDA.
The median fraction of high-quality data during the
day, i.e., between 7-22h, was 68% (IQR: 23%) and
during the night, i.e., between 22-7h was 90% (IQR:
22%).
Table 5 also shows the median fraction of
completed pain diaries, the median fraction of
completed pain diaries containing physiology data,
and the median fraction of completed pain diaries
containing high-quality HR, EDA, and combined HR
and EDA data per group. None of the fractions were
significantly different between the two groups.
Although the healthy controls had an average
comparable fraction of initially filled-in pain diary
prompts (78% against 80%), they had a lower average
fraction of pain diaries in which high-quality
physiology was available (48% against 62%). In total,
there were 1164 labeled datapoints of which 675
datapoints originated from the patient group.
3.2 Pain Classification
Figure 1 shows the distribution of accuracy and
balanced accuracy over all the sequentially tested
participants and for each classifier. The kNN
classifier had the highest median accuracy of 0.42
(IQR: 0.49) and the RF classifier resulted in the
highest median balanced accuracy of 0.40 (IQR:
0.21). Furthermore, all classifiers, except XGBoost,
seemed to generalize better for the healthy controls
than for the patients in terms of accuracy. Finally, all
classifiers showed a significant variation in
performance, which can likely be explained by inter-
participant variation and heterogeneity.
HEALTHINF 2024 - 17th International Conference on Health Informatics
334
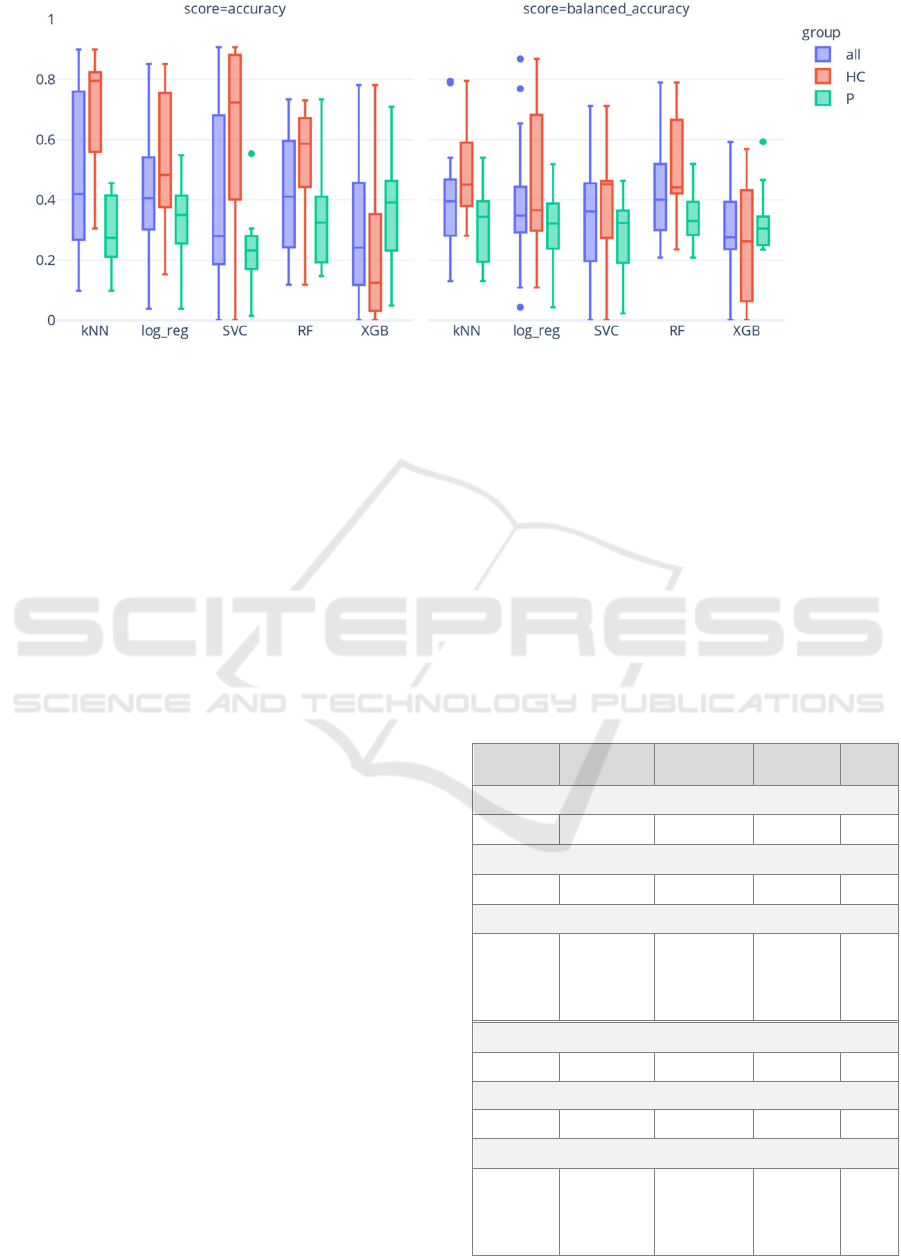
Figure 1: Distribution of accuracy and balanced accuracy on the test data for each of the classifiers summarized for all
participants, all patients (P), and all healthy controls (HC).
Figure 2 shows the accuracies and balanced
accuracy scores for each feature modality and their
combination using a RF classifier trained
separatelyon patients and healthy controls. Notably, a
striking difference in median accuracy and balanced
accuracy was observed within the healthy control
group, likely due to substantial class imbalance
(Table 2). Among patients, only small variations in
model performance were observed across different
modalities, with the combined modalities yielding the
highest median and the EDA modality demonstrating
the highest maximum and minimum balanced
accuracy. Furthermore, EDA emerged as the highest-
performing single modality in terms of median
balanced accuracy. In the healthy controls, even
smaller differences were observed, as the combined,
EDA, ACC, and HR modalities all demonstrated
equally high median balanced accuracies.
4 DISCUSSION
The obtained average pain-diary compliance of 80%
for patients and 78% for healthy controls is slightly
lower than in previous studies, which reported 85-
86.6% for patients with chronic pain (Gendreau et al.,
2003; Garcia-Palacios et al., 2014; May et al., 2018;
Ono et al., 2019). A possible explanation for this
could be the relatively high number of pain diary
prompts per day (May et al., 2018). Furthermore, the
healthy controls exhibited a larger percentage of data
loss, either due to the absence of physiological data
or the presence of lower-quality physiological data,
compared to the patients (30% against 18%). This
discrepancy could be attributed to several factors.
First, the healthy controls wore the wristband less
frequently as indicated in Table 5. Second, they
showed increased activity levels, indicated by a
median higher ACC magnitude standard deviation
(not reported) and by a higher IPAQ category at
baseline (Table 4). In contrast, both groups indicated
the same level of momentary activity (Table 4).
Possibly, participants isolated themselves while
responding to the diary prompts, which could explain
the similar reporting of momentary activity.
Table 5: Median and IQR of the collected wristband data
per participant with non-wear and quality, and the fraction
of collected pain diary data with and without concurrent
physiology all relative to the scheduled questionnaires.
Signal Patients Healthy
controls
Test-
statistic
p-value
Wristband data in hours (h)
155 h (30) 137 h (52) W = 28 0.105
Non-wear wristband data in hours (h)
0.11 h (0.4) 0.04 h (0.5) W = 49.5 1
Wristband data high-quality fraction
HR
87,2% (14.8) 86,9% (14.9)
W = 41 0.529
EDA
86,0% (19.1) 85,1% (17.9)
t = -0.3435 0.735
Combined
80,4% (22.2) 71,5% (14.8)
W = 40 0.481
Pain diary compliance
80% (22%) 78% (4%) W=50 1
Pain diary and physiology compliance
67% (22%) 58% (24%) t = -1.154 0.264
Pain diary with high-quality physiology compliance
HR 66% (24%) 48% (34%) t = -1.5242 0.146
EDA 63% (22%) 49% (39%) t = -1.4743 0.158
Combined 62% (23%) 48% (39%) t = -1.4988 0.153
Monitoring Pain in Patients with Chronic Pain with a Wearable Wristband in Daily Life: A Pilot Study
335
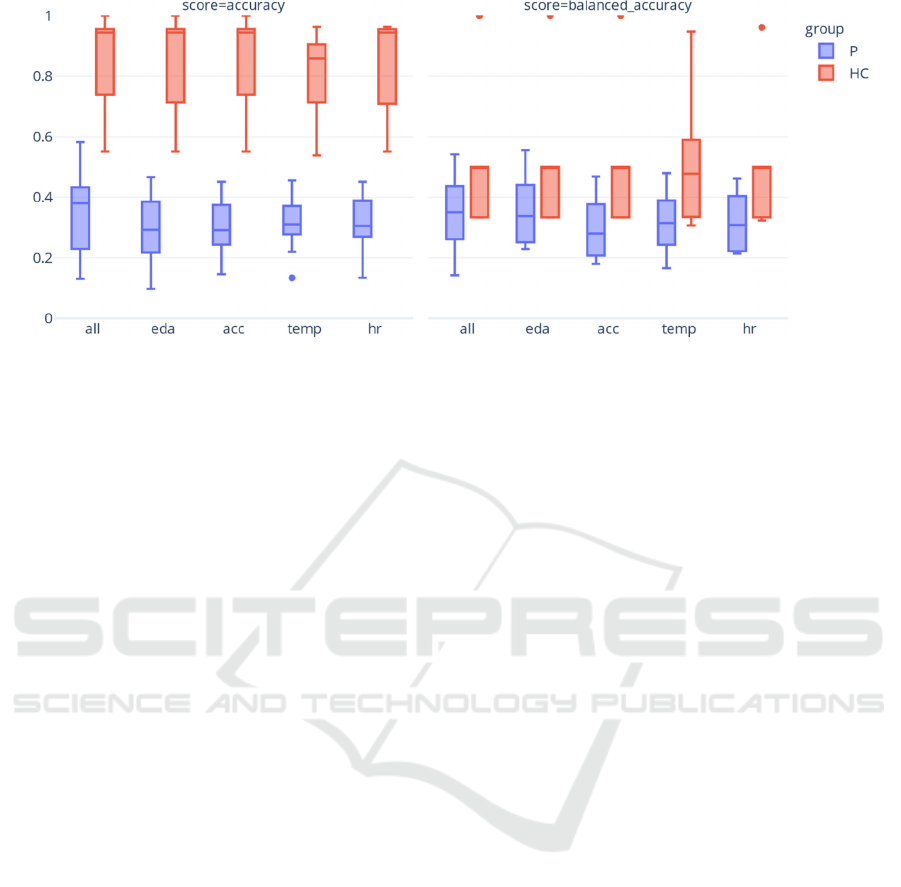
Figure 2: Distribution of accuracy and balanced accuracy on the test data per feature modality when fitting a RF classifier
trained per group: patients (P), and healthy controls (HC).
To classify momentary pain using physiological
data captured in daily life in the combined chronic
pain and healthy control population, we have fitted
several machine learning models. Generally, the
performance of the models was mediocre, in which
the kNN classifier resulted in the highest accuracy of
0.42 and the RF classifier in the highest balanced
accuracy of 0.40. These performances are comparable
to prior research modeling acute pain in controlled
conditions (Gruss et al., 2015; Thiam et al., 2019;
Kong et al., 2021) but lower than in previous research
modeling pain in sickle cell disease patients in semi-
controlled conditions (Johnson et al., 2019; Stojancic
et al., 2023). Several factors contribute to these
moderate performances. First, as this study is a pilot
study, we obtained a relatively small dataset. Second,
the models were trained using physiological signals
captured in daily life, which are influenced by many
processes besides pain such as arousal, movement, or
environmental factors, e.g., humidity level. Third,
discriminating between closely related pain classes
has been reported in previous research as challenging
(Thiam et al., 2019; Werner et al. 2019). Finally, we
hypothesize that patients may exhibit a blunted stress
physiological response, potentially reducing the
signal-to-noise ratio in the physiological data and
making accurate pain classification more challenging
(Wyns et al., 2023). Notably, observed variations in
individual performance, consistent with previous
research (Jiang et al., 2019; Gouverneur et al., 2020),
underscore the significance of further examination of
the relationship between physiology and pain at the
individual or subgroup level, e.g., stratified by
demographics (e.g., income) or psychiatric profiles,
within future research.
Furthermore, the assessment of median balanced
accuracies across subjects, considering each
individual and the combined feature modalities,
revealed only small differences. In healthy controls,
the combined modalities demonstrated comparable
informativeness to the single modalities of EDA,
ACC, and HR. In contrast, among patients, EDA
emerged as the highest-performing single modality,
albeit with a lower performance than the combined
modality. These observations align with previous lab-
based research on multiclass pain models (Werner et
al., 2019) but not on binary pain models, in which the
EDA modality outperformed the combined
modalities (Lopez-Martinez et al. 2018; Thiam et al.
2019) and are consistent with the idea that EDA is less
person-specific than other modalities, e.g., HR.
However, more investigation on ambulatory collected
physiology from larger datasets is needed, as
interindividual EDA differences have also been
reported (Hernandez et al., 2011).
This pilot study is subject to several limitations.
First, the use of a pain diary with a fixed sampling
scheme may have influenced the participant’s
behavior, as the prompt timing could have been
predictable (Myin-Germeys and Kuppens, 2022).
Additionally, we did not account for the presence of
psychiatric comorbidities, which can potentially
impact the pain and the physiological measurements
(Gerrits et al., 2015; Schiweck et al., 2019). Future
research should further evaluate and explore the
monitoring of pain using physiological features in a
larger population and collect physiological data both
in controlled and ambulatory conditions with the
same device.
HEALTHINF 2024 - 17th International Conference on Health Informatics
336

5 CONCLUSION
This pilot study demonstrated the practicability of
collecting physiological data from patients with
chronic pain and healthy controls using a wearable
wristband and digital pain diary in their daily lives.
The developed machine learning models for pain
classification based on the physiological signals
exhibited moderate performance. Furthermore, our
observations indicated that individual feature
modalities did not outperform the combined feature
modalities. Ultimately, the integration of wearable
technology and physiological monitoring holds
promise for enhancing our understanding of chronic
pain, enabling personalized pain management
strategies, and improving the quality of life for
individuals living with chronic pain. Therefore,
further studies with larger sample sizes are necessary.
ACKNOWLEDGEMENTS
The authors extend their gratitude to all the study
participants and D. Vennekens for her significant
contributions to patient recruitment and data
collection.
REFERENCES
Barakat, A., Vogelzangs, N., Licht, C. M. M., Geenen, R.,
MacFarlane, G. J., De Geus, E. J. C., et al. (2012).
Dysregulation of the autonomic nervous system and its
association with the presence and intensity of chronic
widespread pain. Arthritis care & research, 64(8),
1209–1216. https://doi.org/10.1002/acr.21669.
Buysse, D. J., Reynolds, C. F., Monk, T. H., Berman, S. R.,
and Kupfer, D. J. (1989). The Pittsburgh sleep quality
index: A new instrument for psychiatric practice and
research. Psychiatry Res., 28(2), 193–213.
https://doi.org/10.1016/0165-1781(89)90047-4.
Can, Y. S., Chalabianloo, N., Ekiz, D., & Ersoy, C. (2019).
Continuous Stress Detection Using Wearable Sensors
in Real Life: Algorithmic Programming Contest Case
Study. Sensors (Basel, Switzerland), 19(8), 1849.
https://doi.org/10.3390/s19081849.
Craig, C. L., Marshall, A. L., Sjöström, M., Bauman, A. E.,
Booth, M. L., Ainsworth, B. E., et al. (2003).
International physical activity questionnaire: 12-
Country reliability and validity. Med. Sci. Sports
Exerc., 35(8), 1381–1395. https://doi.org/10.1249/
01.MSS.0000078924.61453.FB.
Coppens, E., Kempke, S., Van Wambeke, P., Claes, S.,
Morlion, B., Luyten, P., et al. (2018). Cortisol and
subjective stress responses to acute psychosocial stress
in fibromyalgia patients and control participants.
Psychosomatic medicine, 80(3), 317–326.
De Vroege, L., Hoedeman, R., Nuyen, J., Sijtsma, K., and
Van Der Feltz-Cornelis, C. M. (2012). Validation of the
PHQ-15 for somatoform disorder in the occupational
health care setting. J. Occup. Rehabil., 22(1), 51–58.
https://doi.org/10.1007/s10926-011-9320-6.
Donker, T., van Straten, A., Marks, I., and Cuijpers, P.
(2011). Quick and easy self-rating of Generalized
Anxiety Disorder: Validity of the Dutch web-based
GAD-7, GAD-2 and GAD-SI. Psychiatry Res., 188(1),
58–64.https://doi.org/10.1016/j.psychres.2011.01.016.
Engelen, U., Peuter, S. De, Victoir, A., Diest, I. Van, and
Van den Bergh, O. (2006). Verdere validering van de
Positive and Negative Affect Schedule (PANAS) en
vergelijking van twee Nederlandstalige versies. gedrag
en gezondh., 34, 61–70. https://doi.org/10.1007/bf03
087979.
Fedjajevs, A., Groenendaal, W., Grieten, L., Agell, C.,
Vandervoort, P. M., & Hermeling, E. (2021).
Evaluation of HRV from Repeated Measurements of
PPG and Arterial Blood Pressure Signals. 2021
Computing in cardiology, 48, 1-4. https://doi.org/
10.23919/cinc53138.2021.9662673.
Fernandez Rojas, R., Brown, N., Waddington, G., and
Goecke, R. (2023). A systematic review of
neurophysiological sensing for the assessment of acute
pain. NPJ digital medicine., 6(1), 76. https://doi.org/
10.1038/s41746-023-00810-1.
Filetti, M. (2020). HIIT/Ledapy: Partial Python Port of
Ledalab. https://github.com/HIIT/Ledapy.
Garcia-Palacios, A., Herrero, R., Belmonte, M. A., Castilla,
D., Guixeres, J., Molinari, G., et al. (2014). Ecological
momentary assessment for chronic pain in fibromyalgia
using a smartphone: a randomized crossover study.
European journal of pain (Londen, England), 18(6),
862–872. https://doi.org/10.1002/j.1532-2149.2013.00
425.x.
Gashi, S., DI Lascio, E., Stancu, B., Swain, V. Das, Mishra,
V., Gjoreski, M., et al. (2020). Detection of Artifacts in
Ambulatory Electrodermal Activity Data. Proceedings
of the ACM Interactive, Mobile, Wearable Ubiquitous
Technologies, 4(2). https://doi.org/10.1145/3397316.
Gendreau, M., Hufford, M. R., & Stone, A. A. (2003).
Measuring clinical pain in chronic widespread pain:
selected methodological issues. Best practice &
research. Clinical rheumatology., 17(4), 575–592.
https://doi.org/10.1016/s1521-6942(03)00031-7.
Gerrits, M. M. J. G., van Marwijk, H. W. J., van Oppen, P.,
van der Horst, H., & Penninx, B. W. J. H. (2015).
Longitudinal association between pain, and depression
and anxiety over four years. Journal of psychosomatic
research, 78(1), 64–70. https://doi.org/10.1016/j.jp
sychores.2014.10.011.
Gouverneur, P., Li, F., Shirahama, K., Luebke, L.,
Adamczyk, W. M., Szikszay, T. M., et al. (2023).
Explainable Artificial Intelligence (XAI) in Pain
Research: Understanding the Role of Electrodermal
Activity for Automated Pain Recognition. Sensors
Monitoring Pain in Patients with Chronic Pain with a Wearable Wristband in Daily Life: A Pilot Study
337

(Basel, Switzerland), 23(4), 1959. https://doi.org/
10.3390/S23041959.
Gouverneur, P.J., Li, F., M. Szikszay, T., M. Adamczyk,
W., Luedtke, K., Grzegorzek, M. (2021). Classification
of Heat-Induced Pain Using Physiological Signals. In
Information Technology in Biomedicine (pp. 239–251).
Springer International Publishing. https://doi.org/10.10
07/978-3-030-49666-1_19
Gruss, S., Treister, R., Werner, P., Traue, H. C., Crawcour,
S., Andrade, A., et al. (2015). Pain intensity recognition
rates via biopotential feature patterns with support
vector machines. PLoS one, 10(10), e0140330.
https://doi.org/10.1371/journal.pone.0140330.
Hernandez, J., Morris, R.R., Picard, R.W. (2011). Call
Center Stress Recognition with Person-Specific.
Affective Computing and Intelligent Interaction (ACII),
125–134. https://doi.org/10.1007/978-3-642-24600-
5_16
IASP (2018). IASP Announces Revised Definition of Pain -
IASP. https://www.iasp-pain.org/PublicationsNews/
NewsDetail.aspx?ItemNumber=10475.
ICD-11 (2023). MG30.0 Chronic primary pain.
https://icd.who.int/browse11/l-
m/en#/http://id.who.int/icd/entity/1326332835.
Jang, E. H., Park, B. J., Park, M. S., Kim, S. H., & Sohn, J.-
H. (2012). Analysis of physiological signals for
recognition of boredom, pain, and surprise emotions.
Journal of physiological anthropology, 34(1), 25.
https://doi.org/10.1186/s40101-015-0063-5.
Jiang, M., Mieronkoski, R., Syrjälä, E., Anzanpour, A.,
Terävä, V., Rahmani, A. M., et al. (2019). Acute pain
intensity monitoring with the classification of multiple
physiological parameters. Journal of clinical
monitoring and computing, 33(3), 493–507.
https://doi.org/10.1007/s10877-018-0174-8.
Johnson, A., Yang, F., Gollarahalli, S., Banerjee, T.,
Abrams, D., Jonassaint, J., et al. (2019). Use of mobile
health apps and wearable technology to assess changes
and predict pain during treatment of acute pain in sickle
cell disease: Feasibility study. JMIR mHealth and
uHealth, 7(12), e13671. https://doi.org/10.2196/13671.
Koenig, J., & Thayer, J. F. (2016). Sex differences in
healthy human heart rate variability: A meta-analysis.
Neuroscience and biobehavioral reviews, 64, 288–310.
doi: 10.1016/j.neubiorev.2016.03.007.
Kong, Y., Posada-Quintero, H. F., & Chon, K. H. (2021).
Sensitive Physiological Indices of Pain Based on
Differential Characteristics of Electrodermal Activity.
IEEE transactions on bio-medical engineering, 68(10),
3122–3130. https://doi.org/10.1109/TBME.2021.30652
18.
Loggia, M. L., Juneau, M., & Bushnell, M. C. (2011).
Autonomic responses to heat pain: Heart rate, skin
conductance, and their relation to verbal ratings and
stimulus intensity. Pain, 152(3), 592–598.
https://doi.org/10.1016/j.pain.2010.11.032.
Lopez-Martinez, D., & Picard, R. (2018). Continuous Pain
Intensity Estimation from Autonomic Signals with
Recurrent Neural Networks. IEEE Engineering in
Medicine and Biology Society. Annual International
Conference, 2018, 5624–5627. https://doi.org/10.1109/
EMBC.2018.8513575.
May, M., Junghaenel, D. U., Ono, M., Stone, A. A., &
Schneider, S. (2018). Ecological Momentary
Assessment Methodology in Chronic Pain Research: A
Systematic Review. The journal of pain (Londen,
England), 19(7), 699–716. https://doi.org/10.1016/
j.jpain.2018.01.006.
Mayer, S., Spickschen, J., Stein, K. V., Crevenna, R.,
Dorner, T. E., & Simon, J. (2019). The societal costs of
chronic pain and its determinants: The case of Austria.
PLoS one, 14(3), e0213889. https://doi.org/10.1371/
journal.pone.0213889.
Mestdagh, M., Verdonck, S., Piot, M., Niemeijer, K.,
Tuerlinckx, F., Kuppens, P., et al. (2022). m-Path: An
easy-to-use and flexible platform for ecological
momentary assessment and intervention in behavioral
research and clinical practice. https://doi.org/10.31234/
osf.io/uqdfs.
Moscato, S., Orlandi, S., Giannelli, A., Ostan, R., & Chiari,
L. (2022). Automatic pain assessment on cancer
patients using physiological signals recorded in real-
world contexts. IEEE Engineering in Medicine and
Biology Society. Annual International Conference,
2022, 1931–1934. https://doi.org/10.1109/EMBC482
29.2022.9871990.
Myin-Germeys, I., & Kuppens, P. (2022). The Open
Handbook of Experience Sampling Methodology: A
step-by-step guide to designing, conducting, and
analyzing ESM studies. https://www.kuleuven.be/
samenwerking/real/real-book/index.html.
Nilsen, K. B., Sand, T., Westgaard, R. H., Stovner, L. J.,
White, L. R., Bang Leistad, R., et al. (2007). Autonomic
activation and pain in response to low-grade mental
stress in fibromyalgia and shoulder/neck pain patients.
European journal of pain (Londen, England), 11(7),
743–755. https://doi.org/10.1016/j.ejpain.2006.11.004.
Ono, M., Schneider, S., Junghaenel, D. U., & Stone, A. A.
(2019). What Affects the Completion of Ecological
Momentary Assessments in Chronic Pain Research? An
Individual Patient Data Meta-Analysis. Journal of
medical Internet research, 21(2), e11398.
https://doi.org/10.2196/11398.
Pattyn, E., Lutin, E., Van Kraaij, A., Thammasan, N.,
Tourolle, D., Kosunen, I., et al. (2023a). Annotation-
Based Evaluation of Wrist EDA Quality and Response
Assessment Techniques. BIOSIGNALS 2023 - 16th
International Conference on Bio-Inspired Systems and
Signal Processing, 186–194. https://doi.org/10.5220/
0011640800003414.
Pattyn, E., Thammasan, N., Lutin, E., Tourolle, D., Van
Kraaij, A., Kosunen, I., et al. (2023b). Simulation of
ambulatory electrodermal activity and the handling of
low-quality segments. Comput. Methods Programs
Biomed., 242, 107859. https://doi.org/10.1016/j.cm
pb.2023.107859.
Reyes del Paso, G. A., Contreras-Merino, A. M., de la
Coba, P., & Duschek, S. (2021). The cardiac,
vasomotor, and myocardial branches of the baroreflex
in fibromyalgia: Associations with pain, affective
HEALTHINF 2024 - 17th International Conference on Health Informatics
338

impairments, sleep problems, and fatigue.
Psychophysiology, 58(5), e13800. https://doi.org/
10.1111/psyp.13800.
Schiweck, C., Piette, D., Berckmans, D., Claes, S., &
Vrieze, E. (2019). Heart rate and high frequency heart
rate variability during stress as biomarker for clinical
depression. A systematic review. Psychological
medicine, 49(2), 200–211. https://doi.org/10.1017/S0
033291718001988.
Schmidt, P., Reiss, A., Dürichen, R., & Laerhoven, K. Van
(2019). Wearable-based affect recognition—a review.
Sensors (Basel, Switzerland), 19(19), 4079.
https://doi.org/10.3390/s19194079.
Schultchen, D., Reichenberger, J., Mittl, T., Weh, T. R. M.,
Smyth, J. M., Blechert, J., et al. (2019). Bidirectional
relationship of stress and affect with physical activity
and healthy eating. British journal of health
psychology, 24(2), 315–333. https://doi.org/10.1111/
bjhp.12355.
Smets, E., Rios Velazquez, E., Schiavone, G., Chakroun, I.,
D’Hondt, E., De Raedt, W., et al. (2018). Large-scale
wearable data reveal digital phenotypes for daily-life
stress detection. NPJ digital medicine, 1, 67.
https://doi.org/10.1038/s41746-018-0074-9.
Stojancic, R. S., Subramaniam, A., Vuong, C., Utkarsh, K.,
Golbasi, N., Fernandez, O., et al. (2023). Predicting
Pain in People With Sickle Cell Disease in the Day
Hospital Using the Commercial Wearable Apple
Watch: Feasibility Study. JMIR formative research, 7,
e45355. https://doi.org/10.2196/45355.
Storm, H. (2008). Changes in skin conductance as a tool to
monitor nociceptive stimulation and pain. Current
opinion in anaesthesiology, 21(6), 796–804.
https://doi.org/10.1097/ACO.0b013e3283183fe4.
Taylor, S., Jaques, N., Chen, W., Fedor, S., Sano, A., &
Picard, R. (2015). Automatic identification of artifacts
in electrodermal activity data. IEEE Engineering in
Medicine and Biology Society. Annual International
Conference, 2015, 1934–1937. https://doi.org/10.1109/
EMBC.2015.7318762.
Temko, A. (2017). PPG-based heart rate estimation using
Wiener filter, phase vocoder and Viterbi decoding.
2017 IEEE International Conference on Acoustics,
Speech and Signal Processing (ICASSP), 1013–1017.
https://doi.org/10.1109/ICASSP.2017.7952309.
Terluin, B., Terluin, M., Prince, K., and Van Marwijk, H.
(2008). De Vierdimensionale Klachtenlijst (4DKL)
spoort psychische problemen op. Huisarts Wet., 51(2),
251–255. https://doi.org/10.1007/bf03086756.
Thammasan, N., Stuldreher, I. V., Schreuders, E., Giletta,
M., & Brouwer, A. M. (2020). A Usability Study of
Physiological Measurement in School Using Wearable
Sensors. Sensors (Basel, Switzerland), 20(18), 5380.
https://doi.org/10.3390/s20185380.
Thiam, P., Bellmann, P., Kestler, H. A., & Schwenker, F.
(2019). Exploring Deep Physiological Models for
Nociceptive Pain Recognition. Sensors (Basel,
Switzerland), 19(20), 4503. https://doi.org/10.3390/S19
204503.
Treede, R. D., Rief, W., Barke, A., Aziz, Q., Bennett, M. I.,
Benoliel, R., et al. (2019). Chronic pain as a symptom
or a disease: the IASP Classification of Chronic Pain
for the International Classification of Diseases (ICD-
11). Pain, 160(1), 19–27. https://doi.org/10.1097/
j.pain.0000000000001384.
Van Boekel, R. L. M., Timmerman, H., Bronkhorst, E. M.,
Ruscheweyh, R., Vissers, K. C. P., and Steegers, M. A.
H. (2020). Translation, Cross-Cultural Adaptation, and
Validation of the Pain Sensitivity Questionnaire in
Dutch Healthy Volunteers. Pain Res. Manag., 23.
https://doi.org/10.1155/2020/1050935.
Van Middendorp, H., Lumley, M. A., Houtveen, J. H.,
Jacobs, J. W. G., Bijlsma, J. W. J., & Geenen, R. (2013).
The impact of emotion-related autonomic nervous
system responsiveness on pain sensitivity in female
patients with fibromyalgia. Psychosomatic medicine,
75(8), 765–773.https://doi.org/10.1097/PSY.0B013E3
182A03973.
Van Steenbergen-Weijenburg, K. M., Van Der Feltz-
Cornelis, C. M., Van Benthem, T. B., Horn, E. K.,
Ploeger, R., Brals, J. W., et al. (2015). Collaborative
care voor de behandeling van comorbide depressieve
stoornis bij chronisch lichamelijk zieke patienten op
een polikliniek van een algemeen ziekenhuis. Tijdschr.
Psychiatr., 57(4), 248–257.
Walter, S., Gruss, S., Traue, H., Werner, P., Al-Hamadi, A.,
Kachele, M., et al. (2015). Data fusion for automated
pain recognition. 2015 9th International Conference on
Pervasive Computing Technologies for Healthcare
(PervasiveHealth), 261–264. https://doi.org/10.4108/
icst.pervasivehealth.2015.259166.
Werner, P., Al-Hamadi, A., Gruss, S., & Walter, S. (2019).
Twofold-Multimodal Pain Recognition with the X-ITE
Pain Database. 2019 8th International Conference on
Affective Computing and Intelligent Interaction
Workshops and Demos (ACIIW), 290–296.
https://doi.org/10.1109/ACIIW.2019.8925061.
Wyns, A., Hendrix, J., Lahousse, A., De Bruyne, E., Nijs,
J., Godderis, L., et al. (2023). The Biology of Stress
Intolerance in Patients with Chronic Pain-State of the
Art and Future Directions. Journal of clinical medicine,
12(6), 2245. https://doi.org/10.3390/jcm12062245.
Monitoring Pain in Patients with Chronic Pain with a Wearable Wristband in Daily Life: A Pilot Study
339
