
Improved Pest Detection in Insect Larvae Rearing with Pseudo-Labelling
and Spatio-Temporal Masking
Paweł Majewski
1 a
, Piotr Lampa
2 b
, Robert Burduk
1 c
and Jacek Reiner
2 d
1
Faculty of Information and Communication Technology, Wrocław University of Science and Technology, Poland
2
Faculty of Mechanical Engineering, Wrocław University of Science and Technology, Poland
Keywords:
Pseudo-Labelling, Spatio-Temporal, Optical Flow, Object Detection, Insect, Monitoring, Tenebrio Molitor.
Abstract:
Pest detection is an important application problem as it enables early reaction by the farmer in situations of
unacceptable pest infestation. Developing an effective pest detection model is challenging due to the problem
of creating a representative dataset, as episodes of pest occurrence under real rearing conditions are rare.
Detecting the pest Alphitobius diaperinus Panzer in mealworm (Tenebrio molitor) rearing, addressed in this
work, is particularly difficult due to the relatively small size of detection objects, the high similarity between
detection objects and background elements, and the dense scenes. Considering the problems described, an
original method for developing pest detection models was proposed. The first step was to develop a basic
model by training it on a small subset of manually labelled samples. In the next step, the basic model identified
low/moderate pest-infected rearing boxes from many boxes inspected daily. Pseudo-labelling was carried
out for these boxes, significantly reducing labelling time, and re-training was performed. A spatio-temporal
masking method based on activity maps calculated using the Gunnar-Farneback optical flow technique was
also proposed to reduce the numerous false-positive errors. The quantitative results confirmed the positive
effect of pseudo-labelling and spatio-temporal masking on the accuracy of pest detection and the ability to
recognise episodes of unacceptable pest infestation.
1 INTRODUCTION
Insect pests cause significant losses in the agricul-
tural sector every year (Oerke, 2006). Recently, an
increasing consumer demand for food greenness can
also be observed that favours smart solutions to con-
trol pest numbers and use chemicals, known as smart
pest management (Rustia et al., 2022).
Significant advances in machine learning make re-
searchers eager to pursue the topic of pest detection,
mainly for crop pests (Li et al., 2021) and storage
pests (Zhu et al., 2022). Due to the difficulty of reg-
istering pests under real-world conditions, solutions
typically involved trapping pests through (1) sticky
paper traps (Rustia et al., 2021), (2) pheromone-based
traps (Sun et al., 2018), and (3) light traps (Bjerge
et al., 2021). The machine vision system, placed at
the appropriate location, enabled easy detection of
a
https://orcid.org/0000-0001-5076-9107
b
https://orcid.org/0000-0001-8009-6628
c
https://orcid.org/0000-0002-3506-6611
d
https://orcid.org/0000-0003-1662-9762
trapped pests. At the level of models/algorithms, re-
searchers proposed different solutions, where mainly
to be noted are: (1) models based on deep convo-
lutional networks (Jiao et al., 2020; Turkoglu et al.,
2022), (2) models based on transformers (Zhang et al.,
2021; Wang et al., 2023) and (3) classical image pro-
cessing methods (Nagar and Sharma, 2020). Among
the major current challenges identified by researchers
in pest detection are: (1) the difficulty of developing
large datasets with issues of data augmentation and
semi-supervised methods, (2) early detection of low
pest infestation and indirect symptoms, (3) detection
of pests when occlusion occurs, and (4) development
of specific solutions, model architectures for pest de-
tection problem as opposed to using off-the-shelf so-
lutions (Li et al., 2021; Ngugi et al., 2021).
Despite the considerable amount of work in the
area of detection of crop and storage pests, we do not
find much research in the area of detection of pests in
insect farming, e.g. honeybee or mealworm (Tenebrio
molitor) (Siemianowska et al., 2013). Research has
already been undertaken on detecting the mite Varroa
destructor (Rosenkranz et al., 2010) on the bee us-
Majewski, P., Lampa, P., Burduk, R. and Reiner, J.
Improved Pest Detection in Insect Larvae Rearing with Pseudo-Labelling and Spatio-Temporal Masking.
DOI: 10.5220/0012311300003660
Paper published under CC license (CC BY-NC-ND 4.0)
In Proceedings of the 19th International Joint Conference on Computer Vision, Imaging and Computer Graphics Theory and Applications (VISIGRAPP 2024) - Volume 2: VISAPP, pages
349-356
ISBN: 978-989-758-679-8; ISSN: 2184-4321
Proceedings Copyright © 2024 by SCITEPRESS – Science and Technology Publications, Lda.
349
ing computer vision. (Bjerge et al., 2019) proposed
an Infestation Level Estimator (ILE) to determine the
level of infestation by the mite Varroa destructor. De-
spite obtaining a relatively high F1-score=0.91 for the
detection of varroa mites and confirming the ability
to recognise the presence of this mite on bees, the
following problems of the proposed solution can be
noted: (1) the significant modification of the hive to
install the machine vision system, which may affect
the daily functioning of the bees, (2) performing the
dataset development and validation process for bee
populations with relatively high infestation levels (5-
10%), assuming an infestation level of 2% as an ac-
ceptable (Sajid et al., 2020). An effective pest detec-
tion solution should: (1) be designed to operate under
the real conditions of farming with as little interfer-
ence with insect functioning as possible, (2) be devel-
oped and evaluated for samples associated with differ-
ent degrees of pest infestation in the population - the
most difficult is to detect pests at low levels of infes-
tation with an adequate level of precision (this is the
situation most often found under professional farm-
ing conditions.). To the best of our knowledge, there
is no work on pest detection in mealworm (Tenebrio
molitor) rearing.
Considering the indicated research gaps at the
methodological and application levels, we addressed
the detection of the Alphitobius diaperinus Panzer
pest in mealworm (Tenebrio monitor) rearing. To re-
flect the real rearing conditions fairly, the model de-
velopment process used low/moderate pest-infested
boxes with mealworms occurring under large-scale
rearing conditions. As the main highlights of the re-
search carried out, we identify (1) an efficient method
for developing pest detection models under the as-
sumption of low pest infestation of the population and
no specially prepared samples with a high infestation,
(2) a pseudo-labelling method for iteratively develop-
ing pest detection models and increasing model accu-
racy with relatively small manually labelled datasets,
(3) a spatio-temporal masking method for increasing
model precision under low pest infestation conditions,
and (4) fair model evaluation under different degrees
of pest infestation.
2 MATERIAL AND METHODS
2.1 Problem Definition
The problem addressed in this paper is the detection
of the pest (Alphitobius diaperinus Panzer) in images
of rearing boxes with mealworm (Tenebrio Molitor)
larvae. The solution should include the detection of
the pest in both larva and beetle forms. The problem
is challenging for the following reasons: (1) the rel-
atively small size of the objects to be detected (the
length of the mature larva is about 7 - 11 mm, and
the size of the beetle is about 6 mm) (Dunford and
Kaufman, 2006), (2) the high similarity between the
objects to be detected and the background elements
(possible false-positive errors in the case of small
mealworm larvae, dead larvae), (3) dense scenes caus-
ing the objects to be detected to be often partially
occluded, (4) the difficulty of developing a represen-
tative dataset containing examples of the pest under
real-world conditions of mealworm rearing (breeders
want to keep the pest infestation low, so the pest oc-
curs infrequently and sparsely in rearing boxes), and
(5) the labour-intensive manual labelling of images,
which is directly related to the difficulties described
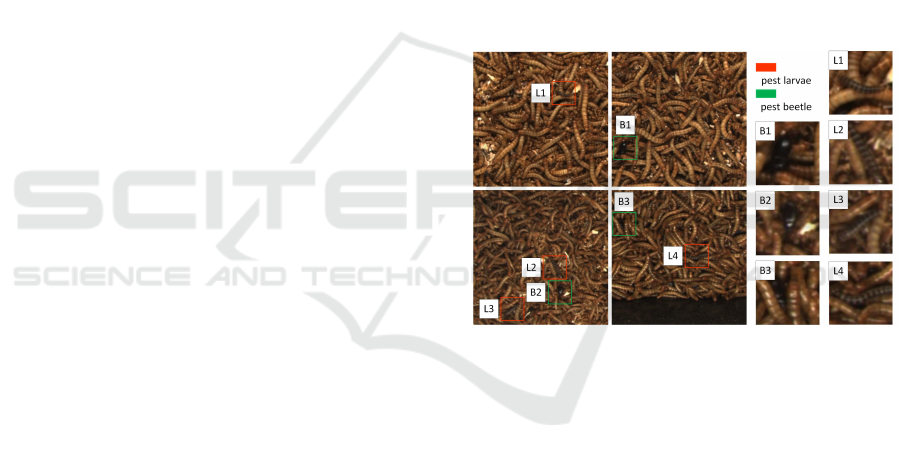
in (1), (2) and (3). Examples of detection objects in
the form of larvae (L1-L4) and beetles (B1-B3) in se-
lected image tiles are shown in Figure 1.
Figure 1: Examples of detection objects from the classes
pest larvae and pest beetle.
2.2 Dataset
The basis of the developed dataset was the raw
4096 x 3000 pixels images, from which were ex-
tracted smaller square tiles with size 512. The
livestock-adapted machine vision system acquired
raw images. The imaging conditions allowed the
registration of images with a resolution of 0.143
mm/pixel. Each such image also had a correspond-
ing image taken 1 s later, allowing further calculation
of activity maps. From the raw images, 512 x 512
pixels tiles were extracted (presented in Figure 1) us-
ing the sliding window method with a shift unit of
128 pixels. For labelling, 200 rearing boxes charac-
terised by low/moderate pest infestation levels were
selected, which represented approximately 5% of all
boxes being automatically inspected in a given period.
A weak model (trained on a few manually labelled
samples) for pest detection was used to identify boxes
VISAPP 2024 - 19th International Conference on Computer Vision Theory and Applications
350
with a noticeable pest infestation to avoid manual in-
spection. All 200 raw images were labelled manually
to enable the determination of an upper baseline for
the accuracy of the pest detection model, yielding the
number of labelled objects: 1626 for the pest larvae
class and 1004 for the pest beetle class. The average
number of pests in the selected boxes, characterised
by low/moderate pest infestation levels, was approx-
imately 13. At the given level of infestation, there
are more than 100 mealworm larvae per pest, which
does not yet require intervention from the farmer. The
dataset included 107941 tiles: 16995 tiles with at least
one pest and 90946 tiles without a pest.
2.3 Proposed Method
Considering the difficulties described in section 2.1,
an original method for developing a pest detection
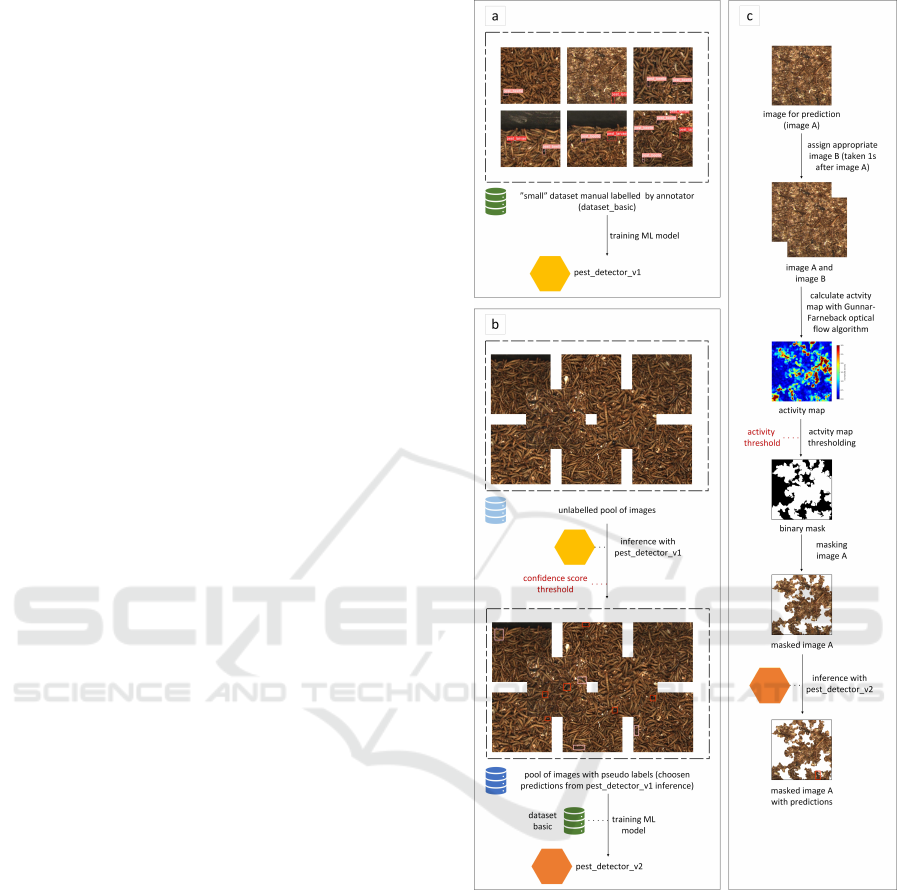
model is proposed. The idea scheme of the proposed
solution is presented in Figure 2.
Three main elements of the proposed method are
identified: (1) basic training (Figure 2a), (2) pseudo-
labelling and re-training (Figure 2b), and (3) spatio-
temporal masking in prediction time (Figure 2c),
which will be described in the following subsec-
tions. Pseudo-labelling addressed the need to speed
up (enable) the labelling of the many unlabelled im-
ages acquired during the daily inspection of the rear-
ing boxes. Spatio-temporal masking was proposed
to reduce false-positive errors, the amount of which
was significant in relation to correct predictions for
low/moderate pest infestations.
2.3.1 Basic Training
The basic training consisted of training the model on
a small subset of manually labelled samples. The size
of the subset was defined by the parameter train size,
which determined approximately the proportion of all
labelled objects in the training set (for example, train
size equals 0.16 means that about 16% of all man-
ually labelled objects representing pests were in the
training set). Stratified sampling was used to maintain
the proportion of objects from the pest larvae and pest
beetle classes in the determined subsets of samples.
The resulting model was evaluated after basic train-
ing, and the results for this type of approach were re-
ferred under the name without pool (lower baseline).
The name of the approach is due to the fact that un-
labelled samples from the pool were not used during
training. The YOLOv5x (Jocher et al., 2020) model
was trained with the following training parameters:
epochs=30, batch_size=8. The basic training was pre-
sented in Figure 2a.
Figure 2: Idea scheme for the proposed solution: (1) ba-
sic training, (2) pseudo-labelling and re-training, and (3)
spatio-temporal masking in prediction time.
2.3.2 Pseudo-Labelling with Re-Training
The second stage of the proposed method involved us-
ing a pseudo-labelling method to label samples from
the pool automatically. The pool did not include sam-
ples selected for the test set. The inference was per-
formed for each sample in the pool, and a prediction
was considered relevant if its confidence level was
higher than the parameter confidence score thresh-
old. The parameter confidence score threshold was
fine-tuned under the constant parameter train size.
After automatic labelling according to the described
Improved Pest Detection in Insect Larvae Rearing with Pseudo-Labelling and Spatio-Temporal Masking
351

method, the model training was repeated, using the
automatically labelled samples and the manually la-
belled samples used in the basic training. The result-
ing model after re-training was evaluated and the re-
sults for this approach were refereed under the name
pool used with pseudo labels. The training settings re-
mained unchanged. Pseudo-labelling with re-training
was presented in Figure 2b.
2.3.3 Spatio-Temporal Masking in Prediction
Time
At the prediction stage, spatio-temporal masking was
introduced to remove some false-positive predictions
characterised by no movement. Each image (tile)
for which a prediction was performed was related
to an image taken 1 s later, resulting in small shifts
in the areas where the larvae were located. The
normalised activity map was calculated using the
Gunnar-Farneback optical flow technique (Farnebäck,
2003). Then, a binary mask was determined using
the defined Farneback activity threshold, where white
pixels represent areas with activity above the thresh-
old. The Farneback activity threshold parameter was
fine-tuned under the constant parameter train size.
A masked RGB image was used for prediction, where
only areas with the minimum defined activity are visi-
ble. When reporting the results from the model evalu-
ations, the use of the described method was indicated
by an appendix in the name + spatio-temporal mask-
ing. The spatio-temporal masking method was pre-
sented in Figure 2c.
2.4 Evaluation
Four sets of samples were distinguished for evalua-
tion purposes: a training set, a validation set, a test
set and a set defined as an image pool. Independence
between the sets was provided at the level of the raw
images from which the tiles were extracted. The size
of the training set was defined by the parameter train
size, which specified approximately the proportion of
the number of objects in this set relative to the number
of objects in the entire dataset. The training set was
used to train the pest detection model. The analysis
was conducted for four training set sizes: 0.02, 0.04,
0.08 and 0.16. The size of the validation set was fixed
and was 1/2 train size (for example, when the training
set contained about 16% of all labelled objects, the
validation set then contained about 8% of all labelled
objects). The validation set was used to evaluate the
model during training and select the model from the
best epoch. The size of the test set was fixed and equal
to 0.3 (about 30% of all manually labelled objects rep-
resenting pests were in the test set). The test set was
used for the final evaluation of the models, and the
referenced results are from the evaluation on this set.
The remaining samples not included in the training,
validation and test sets belonged to the image pool.
Including images from the pool in model training de-
pended on the approach used.
Two types of evaluation were conducted for (1)
low/moderate pest infestation and (2) high pest in-
festation. In the case of (1), the evaluation consid-
ered tiles with and without pests. For low/moderate
infestation, which was present in the analysed im-
ages, there were approximately five pest-free tiles per
tile with at least one pest, as described in more de-
tail in section 2.2. In case (2), the evaluation con-
sidered only tiles with pests. It was decided to carry
out these two types of evaluation because of the sig-
nificant number of false-positive errors that resulted
from the similarity between the analysed objects and
the background elements. The possibility of numer-
ous false-positive errors implies that the accuracy of
the models will strictly depend on the level of pest
infestation.
Besides evaluating the approaches indicated in
section 2.3: without pool (lower baseline), pool used
with pseudo labels, an upper baseline of model accu-
racy was also determined by using true labels instead
of pseudo labels for the pool samples. This approach
was named pool used with true labels.
The following parameter values were checked for
parameter fine-tuning procedures: (a) for the confi-
dence score threshold parameter - [0.1, 0.3, 0.5, 0.7,
0.9], and for the Farneback activity threshold param-
eter - [0, 0.2, 0.4, 0.6, 0.8, 1.0, 1.2]. For the parameter
Farneback activity threshold, the range of values was
determined based on a preliminary qualitative assess-
ment of the calculated activity maps.
For one experiment related to the selected type
of evaluation, the type of approach and the size of
the training set (parameter train size), three repeats
of pest detection model training were performed re-
lated to the different division of the samples into sets:
training, validation, test and image pool. The results
obtained were averaged over these repeats. Repetition
of training was also used in parameter fine-tuning.
Standard metrics for object detection were cho-
sen as quantitative indicators for evaluation: AP50
(average precision with IoU=50%), F1-score, preci-
sion and recall. The values of F1-score, precision,
and recall were related to the optimal working point
at which the value of the F1-score metric was max-
imised. The values of the indicated metrics were de-
termined separately for the two defined object classes:
pest larvae and pest beetle, and averaged over these
classes.
VISAPP 2024 - 19th International Conference on Computer Vision Theory and Applications
352
3 RESULTS AND DISCUSSION
A comparison of the proposed approaches for the two
types of evaluation is summarised in Table 1 and in
Figures 4a and 4b. In addition, Figures 3a and 3b
show the results of the fine-tuning of two parame-
ters: confidence score threshold and Farneback ac-
tivity threshold. For the discussion of the results,
the AP50 metric (independent of the confidence score
threshold) was chosen for parameter fine-tuning and
the F1-score metric (associated with a specific work-
ing point) for comparing approaches. Fine-tuning was
conducted with a training set size of 0.04 and for eval-
uation type: low/moderate pest infestation. As lower
baseline in Figure 3a the metric values for the with-
out pool (lower baseline) approach were specified. In
Figure 3b the lower baseline was associated with the
pool used with pseudo labels approach. In Table 1, in
addition to the value of the defined train size param-
eter, the averaged number of manually labelled sam-
ples in the training and validation set is also provided.
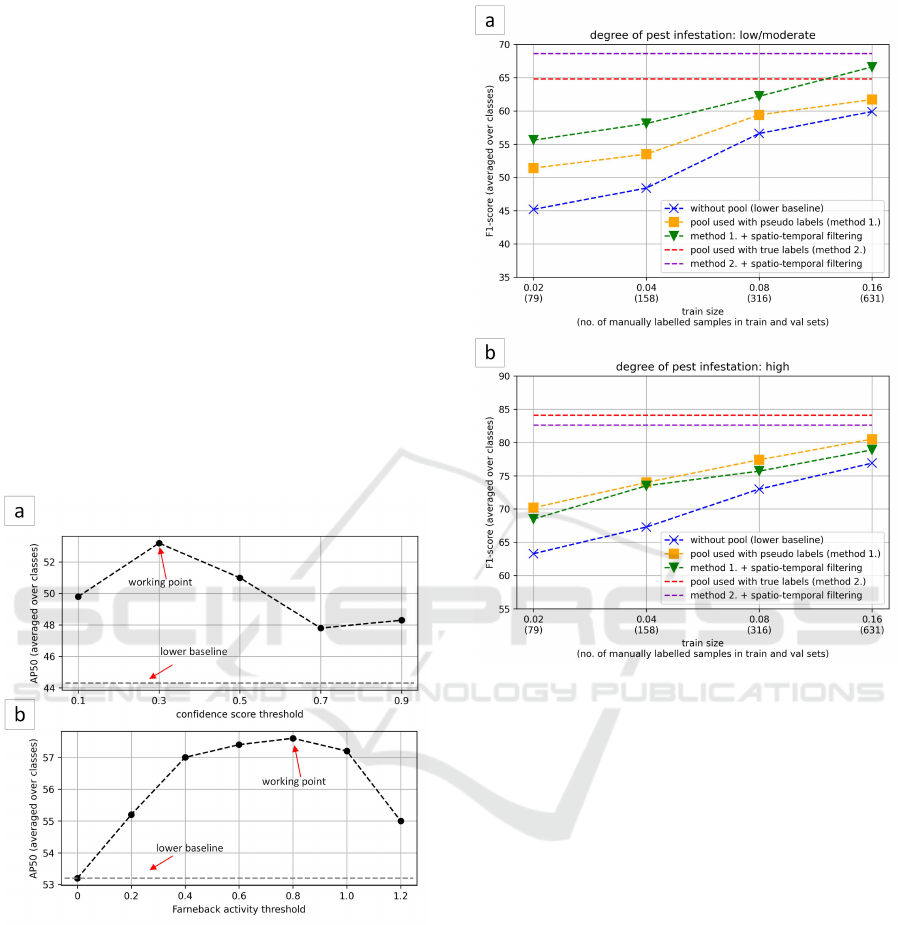
Figure 3: Fine-tuning results for: (a) confidence score
threshold and (b) Farneback activity threshold.
Figure 3a and 3b confirm the rationale for fine-
tuning the two selected parameters: confidence score
threshold and Farneback activity threshold. For con-
fidence score threshold fine-tuning, the difference be-
tween the lower baseline and the working point was
∆AP50 = 8.9 (increase from 44.3 to 53.2), while for
Farneback activity threshold ∆AP50 = 4.4 (increase
from 53.2 to 57.6). For further approaches, the param-
eter values indicated in Figures 3a and 3b as working
points were used, i.e. 0.3 for confidence score thresh-
old and 0.8 for Farneback activity threshold.
Figure 4: Comparison of the proposed methods according
to the F1-score metric for pest detection for cases of: (a)
low/moderate pest infestation, and (b) high pest infestation.
The impact of pseudo-labelling on pest detec-
tion accuracy can be assessed by comparing the re-
sults for approaches without pool (lower baseline)
(blue line) and pool used with pseudo labels (orange
line) in Figures 4a and 4b. For both low/moderate
and high pest infestation, we can see a positive
and significant effect of using pseudo-labelling for
the image pool on pest detection accuracy. In the
case of the low/moderate pest infestation evaluation,
pseudo-labelling contributed to an increase in the av-
erage F1-score (averaged over different train size) of
∆F1 = 4.0 and in the case of the high infestation F1-
score increased by ∆F1 = 5.4.
The influence of spatio-temporal masking on de-
tection accuracy was assessed by pairwise compar-
ison of the results for the approaches pool used
with pseudo labels (orange line) and pool used with
pseudo labels + spatio-temporal masking (green line)
and for the approaches pool used with true labels
(red line) and pool used with true labels + spatio-
temporal masking (purple line) in Figures 4a and 4b.
Improved Pest Detection in Insect Larvae Rearing with Pseudo-Labelling and Spatio-Temporal Masking
353
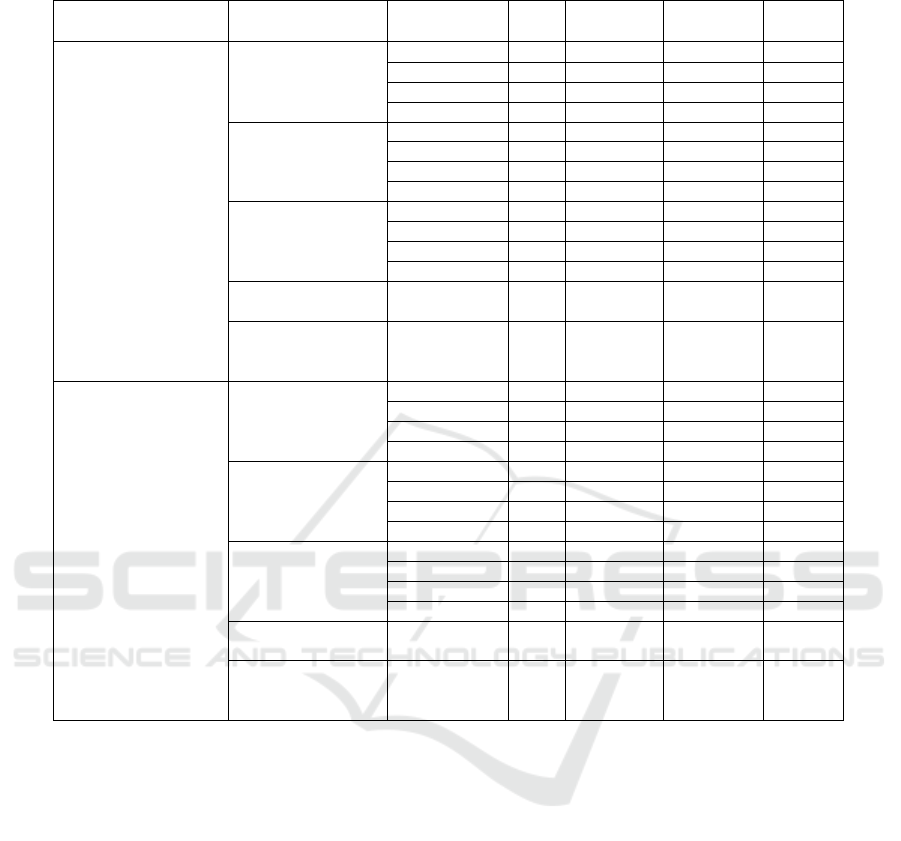
Table 1: Comparison of the proposed methods for two cases: (1) low/moderate pest infestation, (2) high pest infestation.
evaluation type
(degree of pest infestation)
approach type
train size
(# samples)
AP50 F1-score [%] precision [%] recall [%]
low/moderate
pest infestation
without pool
(lower baseline)
0.02 (79) 40.6 45.2 45.4 45.9
0.04 (158) 44.3 48.4 50.7 47.5
0.08 (316) 52.6 56.6 56.8 56.9
0.16 (631) 57.1 59.9 58.9 61.2
pool used with
pseudo labels
0.02 (79) 48.8 51.4 51.5 52.1
0.04 (158) 53.2 53.5 53.6 54.9
0.08 (316) 57.3 59.4 57.9 61.3
0.16 (631) 60.9 61.7 60.4 63.8
pool used with pseudo
labels + spatio-temporal
filtering
0.02 (79) 51.9 55.6 57.0 55.8
0.04 (158) 57.6 58.1 61.8 57.5
0.08 (316) 60.9 62.2 64.7 60.9
0.16 (631) 65.7 66.6 69.5 64.8
pool used with
true labels
all (1841) 65.3 64.8 60.7 72.0
pool used with true
labels + spatio-temporal
filtering
all (1841) 68.6 68.6 68.7 69.0
high
pest infestation
without pool
(lower baseline)
0.02 (79) 61.5 63.3 69.6 58.9
0.04 (158) 64.8 67.3 74.7 62.2
0.08 (316) 72.6 73.0 79.3 68.5
0.16 (631) 76.4 76.9 83.9 71.5
pool used with
pseudo labels
0.02 (79) 70.7 70.2 76.1 66.5
0.04 (158) 76.2 74.0 77.3 71.7
0.08 (316) 79.7 77.4 81.4 74.3
0.16 (631) 83.9 80.5 82.4 79.1
pool used with pseudo
labels + spatio-temporal
filtering
0.02 (79) 68.0 68.5 77.4 63.3
0.04 (158) 74.1 73.5 81.1 68.5
0.08 (316) 76.3 75.7 81.5 71.6
0.16 (631) 80.5 78.9 83.6 75.4
pool used with
true labels
all (1841) 86.9 84.1 85.0 83.5
pool used with true
labels + spatio-temporal
filtering
all (1841) 84.1 82.6 85.7 80.0
Considering the pool used with pseudo labels ap-
proach, an improvement in detection accuracy using
the spatio-temporal masking technique was noted for
the low/moderate pest infestation case. For this case,
F1-score increased by ∆F1 = 4.1. For the high pest
infestation case, a small reduction in detection accu-
racy was noted - F1-score decreased by ∆F1 = −1.4.
The small reduction in detection accuracy was due to
masking areas with pests characterised by low mo-
bility. As expected, applying the spatio-temporal
masking technique in general increased precision
with decreasing recall. However, for the case of
low/moderate pest infestation, in addition to the ex-
pected increase in precision (∆ precision = 7.4), an
increase in recall was even observed (∆recall = 1.7),
which was due to the possibility of moving the work-
ing point to a lower confidence score threshold value,
resulting in an increased recall. Despite the small re-
duction in model accuracy in the case of high pest
infestation, it should be stated that this is acceptable,
considering that most boxes during the daily inspec-
tion are characterised by low/moderate pest infesta-
tion. The positive effect of spatio-temporal mask-
ing on detection accuracy is expected to be higher
the smaller the pest infestation. Analogous results
were obtained for the pool used with true labels ap-
proach, where an increase in F1-score was obtained
(∆F1 = 3.8) for the low/moderate infestation and a
small decrease in F1-score (∆F1 = −1.5) for the high
pest infestation case.
Analysing the effect of training set size on detec-
tion accuracy, a significant influence of this param-
eter was observed in the considered range of 0.02 –
0.16. Comparing the results between train size 0.02
and 0.16 for pool used with pseudo labels + spatio-
temporal masking approach (green line), an increase
in F1-score was observed by ∆F1 = 11.0 for the
low/moderate pest infestation case and by ∆F1 = 10.4
for the high pest infestation case. Further manual
labelling of the pool samples (representing approxi-
VISAPP 2024 - 19th International Conference on Computer Vision Theory and Applications
354
mately 0.46 of the dataset and 1210 additional sam-
ples for manual annotation), as expected, had a posi-
tive effect on the accuracy of the models, but it was
not such a spectacular improvement as in the con-
sidered range from 0.02 to 0.16. The difference be-
tween the upper baseline (the pool used with true
labels + spatio-temporal filtering approach) and the
pool used with pseudo labels + spatio-temporal mask-
ing approach at train size=0.16 was ∆F1 = 2.0 for
the low/moderate infestation case and ∆F1 = 3.7 for
the high pest infestation case, respectively. For the
specific pest detection problem addressed in this ar-
ticle, the required minimum training set size should
be at least 0.16 (associated with the validation set
size 0.08), resulting in approximately 630 manually
labelled objects. Assuming a low/moderate pest in-
festation under large-scale rearing conditions, obtain-
ing this number of samples in a reasonable time is
only possible with the support of a weak model (e.g.
a model from the pool used with pseudo labels ap-
proach with a small train size) for identifying the
boxes with the highest number of pests.
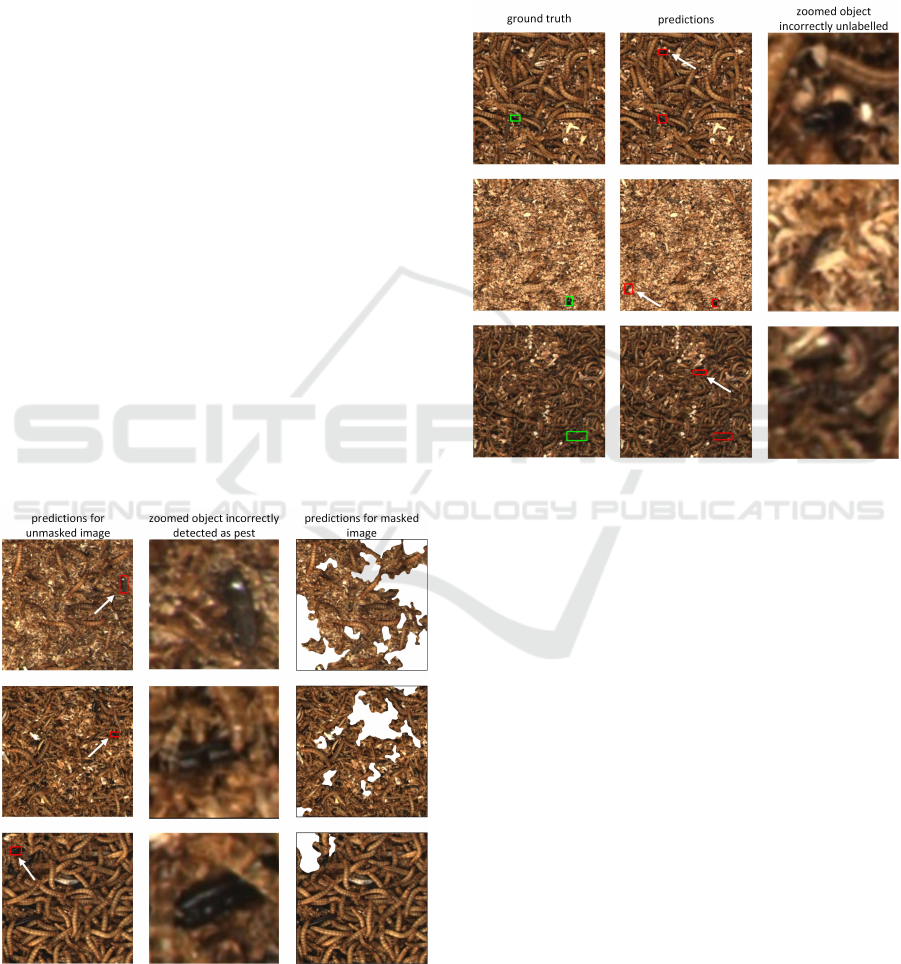
Lower metric values for the low/moderate pest in-
festation evaluation were obtained due to an increase
in the number of false-positive predictions. Some of
these predictions actually represented objects falsely
detected as pests, e.g., fragments of dead larvae sim-
ilar to pest beetles. A part of these false-positive pre-
dictions was filtered out by spatio-temporal masking
(selected examples are shown in Figure 5).
Figure 5: Examples of false-positive predictions filtered out
by spatio-temporal masking.
After analysing the mistakes made by the pest de-
tection model among the false-positive errors, we can
also find many predictions that can represent not la-
belled pests. Some objects were difficult for the anno-
tator to recognise, influenced by dense scenes, overlap
and small size. Selected objects missed during an-
notation but correctly detected by the pest detection
model are shown in Figure 6.
Figure 6: Selected objects missed during annotation but cor-
rectly detected by the pest detection model.
The observed problem with noisy (or lack of) la-
bels, on the one hand, suggests that the model’s accu-
racy can be even better than referred, and on the other
hand, shows the direction of further work in label re-
finement.
4 CONCLUSIONS
The results presented here confirmed the potential
of the proposed methods (pseudo-labelling, spatio-
temporal masking) for developing pest detection
models. Pseudo-labelling is particularly important for
developing the first models (so-called weak models)
when we have a small labelled dataset and access to
a pool of unlabelled images. The role of the spatio-
temporal masking technique is highest in the case of
a low pest infestation when the main problem is po-
tential false alarms, which is the most common situ-
ation found in professional farming. In future work,
we plan to develop additional methods, e.g., based on
expert knowledge and using new imaging domains to
increase the precision of pest detection in the case of
Improved Pest Detection in Insect Larvae Rearing with Pseudo-Labelling and Spatio-Temporal Masking
355

low pest infestation. Future work should also analyse
the real characteristics of the change in the number of
pests over time when changing the infestation from
low/moderate to high, which requires a fast reaction
from the farmer. This analysis will enable us to im-
prove our solution for a particular use case.
ACKNOWLEDGEMENTS
We wish to thank Mariusz Mrzygłód for developing
applications for the designed data acquisition work-
station. We wish to thank Paweł Górzy
´
nski and
Dawid Biedrzycki from Tenebria (Lubawa, Poland)
for providing a data source of boxes with Tenebrio
Molitor. The work presented in this publication was
carried out within the project “Automatic mealworm
breeding system with the development of feeding
technology” under Sub-measure 1.1.1 of the Smart
Growth Operational Program 2014-2020 co-financed
from the European Regional Development Fund on
the basis of a co-financing agreement concluded with
the National Center for Research and Development
(NCBiR, Poland); grant POIR.01.01.01-00-0903/20.
REFERENCES
Bjerge, K., Frigaard, C. E., Mikkelsen, P. H., Nielsen, T. H.,
Misbih, M., and Kryger, P. (2019). A computer vision
system to monitor the infestation level of varroa de-
structor in a honeybee colony. Computers and Elec-
tronics in Agriculture, 164:104898.
Bjerge, K., Nielsen, J. B., Sepstrup, M. V., Helsing-Nielsen,
F., and Høye, T. T. (2021). An automated light trap to
monitor moths (lepidoptera) using computer vision-
based tracking and deep learning. Sensors, 21(2):343.
Dunford, J. C. and Kaufman, P. E. (2006). Lesser
mealworm, litter beetle, alphitobius diaperinus
(panzer)(insecta: Coleoptera: Tenebrionidae): Eeny-
367/in662, rev. 6/2006. EDIS, 2006.
Farnebäck, G. (2003). Two-frame motion estimation based
on polynomial expansion. In Image Analysis: 13th
Scandinavian Conference, SCIA 2003 Halmstad, Swe-
den, June 29–July 2, 2003 Proceedings 13, pages 363–
370. Springer.
Jiao, L., Dong, S., Zhang, S., Xie, C., and Wang, H.
(2020). Af-rcnn: An anchor-free convolutional neu-
ral network for multi-categories agricultural pest de-
tection. Computers and Electronics in Agriculture,
174:105522.
Jocher, G., Nishimura, K., Mineeva, T., and Vilariño,
R. (2020). yolov5. Code repository https://github.
com/ultralytics/yolov5, page 9.
Li, W., Zheng, T., Yang, Z., Li, M., Sun, C., and Yang, X.
(2021). Classification and detection of insects from
field images using deep learning for smart pest man-
agement: A systematic review. Ecological Informat-
ics, 66:101460.
Nagar, H. and Sharma, R. (2020). A comprehensive sur-
vey on pest detection techniques using image process-
ing. In 2020 4th International Conference on Intelli-
gent Computing and Control Systems (ICICCS), pages
43–48. IEEE.
Ngugi, L. C., Abelwahab, M., and Abo-Zahhad, M. (2021).
Recent advances in image processing techniques for
automated leaf pest and disease recognition–a review.
Information processing in agriculture, 8(1):27–51.
Oerke, E.-C. (2006). Crop losses to pests. The Journal of
Agricultural Science, 144(1):31–43.
Rosenkranz, P., Aumeier, P., and Ziegelmann, B. (2010).
Biology and control of varroa destructor. Journal of
invertebrate pathology, 103:S96–S119.
Rustia, D. J. A., Chiu, L.-Y., Lu, C.-Y., Wu, Y.-F., Chen,
S.-K., Chung, J.-Y., Hsu, J.-C., and Lin, T.-T. (2022).
Towards intelligent and integrated pest management
through an aiot-based monitoring system. Pest Man-
agement Science, 78(10):4288–4302.
Rustia, D. J. A., Lu, C.-Y., Chao, J.-J., Wu, Y.-F., Chung,
J.-Y., Hsu, J.-C., and Lin, T.-T. (2021). Online semi-
supervised learning applied to an automated insect
pest monitoring system. Biosystems Engineering,
208:28–44.
Sajid, Z. N., Aziz, M. A., Bodlah, I., Rana, R. M., Ghramh,
H. A., and Khan, K. A. (2020). Efficacy assessment of
soft and hard acaricides against varroa destructor mite
infesting honey bee (apis mellifera) colonies, through
sugar roll method. Saudi Journal of Biological Sci-
ences, 27(1):53–59.
Siemianowska, E., Kosewska, A., Aljewicz, M., Skib-
niewska, K. A., Polak-Juszczak, L., Jarocki, A., and
Jedras, M. (2013). Larvae of mealworm (tenebrio
molitor l.) as european novel food. Agricultural Sci-
ences.
Sun, Y., Liu, X., Yuan, M., Ren, L., Wang, J., and Chen, Z.
(2018). Automatic in-trap pest detection using deep
learning for pheromone-based dendroctonus valens
monitoring. Biosystems engineering, 176:140–150.
Turkoglu, M., Yaniko
˘
glu, B., and Hanbay, D. (2022). Plant-
diseasenet: Convolutional neural network ensemble
for plant disease and pest detection. Signal, Image
and Video Processing, 16(2):301–309.
Wang, S., Zeng, Q., Ni, W., Cheng, C., and Wang, Y.
(2023). Odp-transformer: Interpretation of pest clas-
sification results using image caption generation tech-
niques. Computers and Electronics in Agriculture,
209:107863.
Zhang, Z., Gong, Z., Hong, Q., and Jiang, L. (2021).
Swin-transformer based classification for rice diseases
recognition. In 2021 International Conference on
Computer Information Science and Artificial Intelli-
gence (CISAI), pages 153–156. IEEE.
Zhu, L., Ma, Q., Chen, J., and Zhao, G. (2022). Current
progress on innovative pest detection techniques for
stored cereal grains and thereof powders. Food Chem-
istry, page 133706.
VISAPP 2024 - 19th International Conference on Computer Vision Theory and Applications
356
