
Calibration-Accuracy Measurement in Railway Overlapping
Multi-Camera Systems
Mart
´
ı S
´
anchez
1,2 a
, Nerea Aranjuelo
1 b
, Jon Ander I
˜
niguez de Gordoa
1 c
, Pablo Alonso
1 d
,
Mikel Garc
´
ıa
1,2 e
, Marcos Nieto
1 f
and Mikel Labayen
3 g
1
Vicomtech Foundation, Basque Research and Technology Alliance (BRTA), Donostia-San Sebasti
´
an, Spain
2
University of the Basque Country (UPV/EHU), Donostia-San Sebasti
´
an, Spain
3
CAF Signalling, Donostia-San Sebasti
´
an, Spain
Keywords:
Calibration-Accuracy Degree, Radial Grid, Railway Transportation, Multi-Camera Systems.
Abstract:
This paper presents a method for assessing calibration quality in overlapping multi-camera systems used in
railway transportation. We propose a novel approach that considers the extrinsic and intrinsic parameters of
the cameras and extracts features from their images, providing relevant patterns regarding the pose of the
cameras to detect cameras’ calibration misalignment. Three feature extractors, including traditional image
processing techniques and deep learning approaches, are evaluated and compared. The extracted features are
used to provide a calibration quality metric, enabling real-time detection of camera calibration degradation.
Additionally, we introduce a radial grid design that weights the contribution of pixels based on their distance
from the camera’s optical center. The results demonstrate the effectiveness of our method in assessing the
calibration degree between camera pairs. The findings highlight the superior performance of the deep learning
approaches in analyzing the similarity degree between captured images. Overall, our method lays a solid
foundation for the development of an online camera calibration pipeline.
1 INTRODUCTION
The railway industry is increasingly adopting artifi-
cial intelligence to enhance traditional manual driving
systems, aiming to improve efficiency, reduce costs,
and upgrade the quality of service (Yin et al., 2017).
Intelligent transport systems (ITS) in this context rely
on a variety of sensors, including cameras, LiDARs,
and global navigation satellite systems (GNSS), to
collect and process data. Computer vision and ma-
chine learning algorithms are employed to process
this data, performing tasks such as obstacle detection,
track detection, and train positioning (Yanan et al.,
2018; He et al., 2021). Sensor calibration plays a
crucial role in ensuring the accurate functioning of
these algorithms and enabling effective data fusion
across different sensors (Heng et al., 2019). How-
ever, the calibration accuracy between sensors might
a
https://orcid.org/0009-0007-9103-2364
b
https://orcid.org/0000-0002-7853-6708
c
https://orcid.org/0000-0002-9008-5620
d
https://orcid.org/0000-0001-9650-0525
e
https://orcid.org/0000-0002-3973-7267
f
https://orcid.org/0000-0001-9879-0992
g
https://orcid.org/0000-0001-8136-5324
get compromised due to poor installation procedures,
degradation of mechanical components, or other fac-
tors like vibrations or temperature changes (Georgiev
et al., 2010). Inaccurate sensor calibration can re-
sult in inconsistent data and unreliable object detec-
tion or recognition, compromising the overall per-
formance and safety of the system, particularly in
railway driving environments that commonly employ
multi-sensor set-ups. Consequently, awareness of cal-
ibration quality is essential for taking appropriate ac-
tions, such as recalibration, and for avoiding reliance
on inaccurate data for automated driving.
In this paper, we present a method for assessing
calibration accuracy in overlapping multi-camera sys-
tems. Our method takes into account the cameras’ ex-
trinsic and intrinsic parameters and extracts features
from their respective images accordingly to provide a
calibration quality metric. Thus, our method enables
real-time detection of camera calibration degradation.
The contributions of this paper are:
• Introducing a calibration-accuracy measurement
approach for overlapping multi-camera set-ups.
• Comparative analysis of traditional image pro-
cessing techniques and deep learning approaches
to identify the optimal feature extractor for the tar-
geted task.
Sánchez, M., Aranjuelo, N., Iñiguez de Gordoa, J., Alonso, P., García, M., Nieto, M. and Labayen, M.
Calibration-Accuracy Measurement in Railway Overlapping Multi-Camera Systems.
DOI: 10.5220/0012308000003660
Paper published under CC license (CC BY-NC-ND 4.0)
In Proceedings of the 19th International Joint Conference on Computer Vision, Imaging and Computer Graphics Theory and Applications (VISIGRAPP 2024) - Volume 3: VISAPP, pages
317-324
ISBN: 978-989-758-679-8; ISSN: 2184-4321
Proceedings Copyright © 2024 by SCITEPRESS – Science and Technology Publications, Lda.
317

• Development of a radial grid design that weights
the contribution of pixels to the similarity metric
based on their distance from the camera’s optical
center.
2 RELATED WORK
In recent years, several methods have been proposed
to re-estimate the pose of out-of-calibration cam-
eras providing promising results. These methods can
be broadly categorized as photometric-based or neu-
ral network-based approaches. The former methods
(Zhang et al., 2020; Liu et al., 2019; Zhang et al.,
2021) rely on minimizing the photometric discrep-
ancy between overlapping areas of adjacent cameras
extracted from features present in common scenarios
(such as lane marking corners). Whereas, a weakly-
supervised framework is proposed in (Chen et al.,
2022), which uses a deep neural network to minimize
geometric misalignment between cameras in common
regions. Weakly-supervised information from cali-
bration patterns is used to train the network, and fur-
ther fine-tuning is performed using photometric dis-
crepancy of overlapping regions between cameras.
However, the main drawback of both approaches is
that in low-textured environments, the photometric er-
ror is mainly determined by noise rather than an in-
accurate camera pose. It is important to note that
these approaches often neglect to evaluate the prac-
tical aspects of performing online camera calibration.
Specifically, it remains unclear how to decide when
recalibration is necessary or not. In contrast, (S
´
anchez
et al., 2023) proposes a basic method to evaluate the
quality of adjacent cameras’ calibration by extracting
features from the bird’s-eye-view (BEV) projection of
common areas and analyzing their similarities. Most
of the existing methods related to online camera cali-
bration are designed specifically for the calibration of
cameras embedded in cars. However, the method pro-
posed in this paper takes a more generic approach that
can be extended to other domains, as demonstrated by
the experiments conducted on railway data. The pro-
posed method lays the foundation for a generic online
camera calibration pipeline applicable to multiple do-
mains.
3 METHODOLOGY
The set-up considered in this paper consists of two
pinhole cameras with different focal lengths and fields
of view (FOV) located at a given height above the
ground plane in the frontal part of a train. The dif-
ferent stages of the proposed method are depicted in
Fig. 1, where the images captured by each camera are
first transformed into a BEV perspective to analyze
their overlapping regions (detailed in Section 3.1).
This transformation to a BEV perspective is important
not only for analyzing overlapping regions but also
to reduce dimensionality and uncertainty in the initial
image domain. Then, a radial grid is designed and
applied based on the intersection between a sphere,
which models the coordinate system of a camera, and
the ground plane (Section 3.2). Features are extracted
from each radial patch of both images (Section 3.3),
and finally, their similarity degree is calculated by an-
alyzing the extracted features from corresponding ra-
dial patches (Section 3.4).
3.1 Area of Overlap
To accurately determine the degree of similarity be-
tween two images, it is necessary to identify their area
of overlap (AOO). Given both cameras’ FOVs and
focal distances, their common regions can be deter-
mined and bounded. In our case, we project both im-
ages to the BEV representation by using the cameras’
extrinsic and intrinsic parameters and estimate their
overlapping region (see Fig. 2). Since the distance be-
tween the cameras’ optical center and objects cannot
be estimated directly, the ground projection becomes
a valuable resource for precisely assigning weights to
distances within the overlapping region.
3.2 Radial Grid Design
The BEV projection is a projective transformation
that provides an orthographic view of the captured
scene. This transformation is achieved by mapping
each pixel from the BEV domain to its correspond-
ing pixel in the source image. However, this process
inherently results in fewer correspondences for pixels
located far from the optical center of the camera. As
a consequence, pixels that do not have a direct corre-
spondence in the source image must be interpolated,
leading to a decay in the resolution details of the re-
sulting BEV image over distance. To address this is-
sue, it is important to consider those pixels in the BEV
image located close to the camera’s optical center in
the real world should have a higher confidence level
than those located far from the camera’s optical cen-
ter. Thus, a radial grid is proposed to weigh pixels’
contribution to the final similarity metric depending
on their distance to the camera. The design of this
radial grid is defined by modeling the camera as a
sphere.
VISAPP 2024 - 19th International Conference on Computer Vision Theory and Applications
318
Bird's-eye-view
projection
CAM 1
Radial grid design Features extraction Similarity calculation
Image 1
BEV
Im 1
Features
Im 1
Image 2
CAM 2
BEV
Im 2
BEV'
Im 1
BEV'
Im 2
Features
Im 2
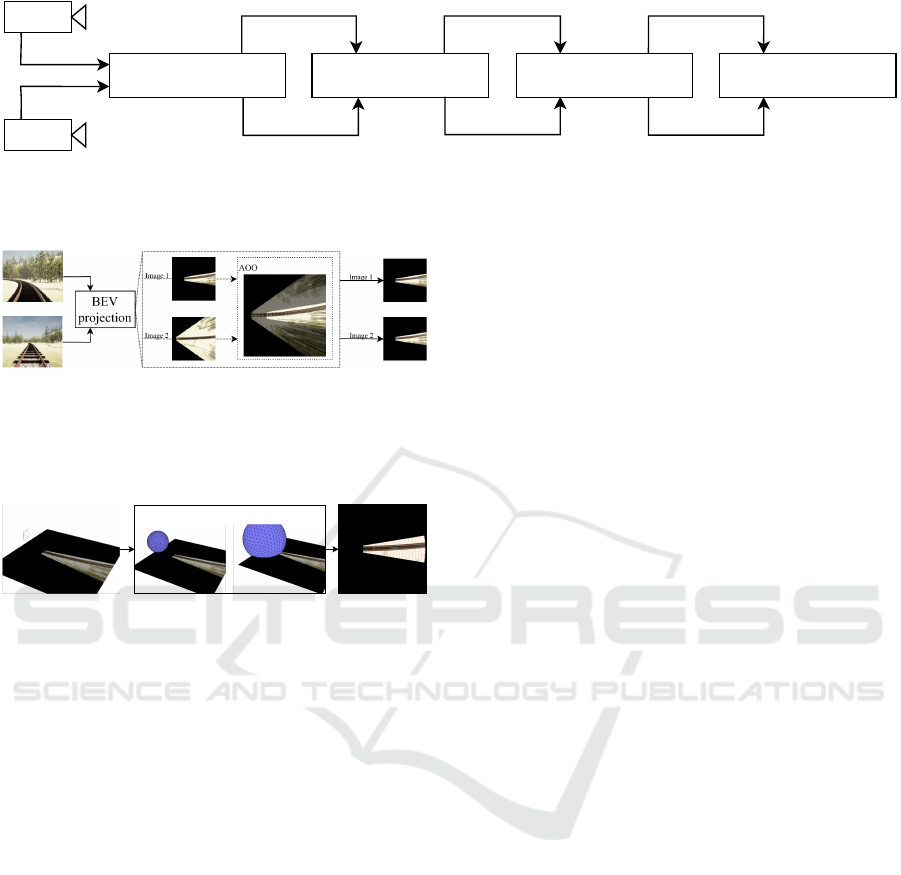
Figure 1: The pipeline of the proposed method. Images from the cameras are first transformed into a bird’s-eye-view projec-
tion, then a radial grid is applied to discretize the overlapping areas between cameras’ FOVs and extract features from each
image. Finally, the similarity between the extracted features is calculated to evaluate the quality of the cameras’ calibration.
Figure 2: Diagram of the BEV projection module from the
main pipeline, where each image captured by each cam-
era is transformed into a BEV perspective. The AOO is
bounded by analyzing both FOVs, ensuring that the com-
mon regions seen by both cameras are considered.
Radial grid discretization
Figure 3: Radial grid creation: camera’s coordinate system
is modeled as a sphere, where slices are determined by the
sphere-ground intersections.
3.2.1 Sphere-Plane Intersection
The camera’s coordinate system is modeled as a
sphere for the purpose of designing the radial grid.
The sphere is centered at the camera’s location and
its radius is increased in steps. As the sphere grows, it
intersects with the ground plane, and the points where
the sphere intersects with it are used to create the ra-
dial slices that form the grid. The size of those steps
is determined by the scene’s maximum distance pro-
jected to the BEV image and the desired number of
radial slices (see Fig. 3).
3.2.2 Information Ratio Calculation
In the BEV image, the resolution of pixels that are
located far away from the camera’s center is lower
than those located closer to the center. To address
this issue, it is necessary to adjust the contribution of
each radial slice to the overall image based on how
far away it is from the center. In other words, slices
closer to the center should have a greater contribution
than those farther away. To achieve this, the informa-
tion ratio (IR) of each BEV pixel is calculated. This
metric quantifies the area of pixels in the source im-
age that are represented at a specific distance from
the camera within the BEV image, based on the cam-
era’s internal geometry. To calculate this ratio, the
four corners of a given pixel in the BEV image are
back-projected to the source image, providing the to-
tal number of pixels that are mapped and represented
at a certain distance in the BEV image. Calculating
this ratio for each radial slice makes it possible to de-
termine its relative contribution based on its average
distance to the camera’s optical center. This serves as
a regularization factor, ensuring that slices closer to
the camera’s optical center have a higher weight than
those located further away.
3.3 Features Extraction
After designing and applying the radial grid to the
bounded regions of the BEV projection, the next step
is to extract features that encode the texture and pat-
terns present in each radial slice. Various feature ex-
traction techniques are used to identify and extract im-
portant information from images, which can be based
on traditional image processing techniques or deep
learning-based approaches. Hand-crafted feature ex-
traction algorithms identify and get relevant features
from the image data. Deep learning-based approaches
use neural networks to automatically learn and extract
features from the data. Concerning deep learning-
based approaches, different features are encoded in
each layer of the network. Typically, the first few lay-
ers of a neural network encode low-level features such
as edges, lines, and simple shapes. These low-level
features provide fine-grained information to compare
the degree of similarity between images and detect
possible geometric misalignment, which is the phe-
nomenon we expect when the calibration of the sen-
sors is not accurate. A detailed comparison of the
strengths and weaknesses of both approaches is pro-
vided in Section 4.2.
Calibration-Accuracy Measurement in Railway Overlapping Multi-Camera Systems
319
3.4 Similarity Calculation
As shown in the pipeline in Fig. 1, the next step in-
volves comparing the features extracted from each ra-
dial slice for both images. We use the cosine sim-
ilarity to compare the extracted features encoded in
feature vectors, regardless the method used to extract
features. This metric depends only on the angle be-
tween the two vectors, being 1 if they are proportional
and 0 when the vectors are orthogonal. Thus, two ra-
dial slices that contain the same features’ distribution
should yield a cosine similarity value close to 1.
We use the cosine similarity to assess the disparity
degree between two images captured from cameras
with a common area of overlap. In this context, their
similarity measurement (σ) is calculated by summing
the weighted cosine similarity degree for each slice by
its associated normalized IR value, as shown in (1). If
the features have been extracted using a deep neural
network, an additional summation must be performed
to average the calculated features of the M filters in
the selected layer, as shown in (2). In these equations,
ρ
i
denotes the cosine similarity degree for slice i (or
for slice i in filter j in (2)), while φ
i
represents the IR
regularization term for slice i, normalized between 0
and 1.
σ =
N
∑
i=1
ρ
i
· φ
i
(1)
σ =
M
∑
j=1
N
∑
i=1
ρ
j,i
· φ
i
(2)
Therefore, the calibration quality between a cam-
era pair is denoted by this similarity degree between
the two images.
4 EXPERIMENTS AND RESULTS
We have conducted a series of experiments to evalu-
ate the effectiveness of the proposed method in var-
ious environments and determine its robustness and
ability to generalize. A dataset of out-of-calibration
cameras has been created including different weather
conditions such as sunny, foggy, and rainy in both ru-
ral and urban scenes. Further details on this dataset
can be found in Section 4.1. The experiments them-
selves are described in Section 4.2, while the obtained
results are presented in Section 4.3 along with a de-
tailed analysis of the method’s reliability.
4.1 Synthetic Dataset
We have created a synthetic dataset to evaluate the
proposed method. This dataset (I
˜
niguez de Gordoa
et al., 2023) is built from a railway virtual scenario
using the game development engine Unreal Engine 4.
For creating it, two pinhole cameras are located in the
frontal part of the train at a given height. Moreover,
those cameras highly differ in focal lengths, as a chal-
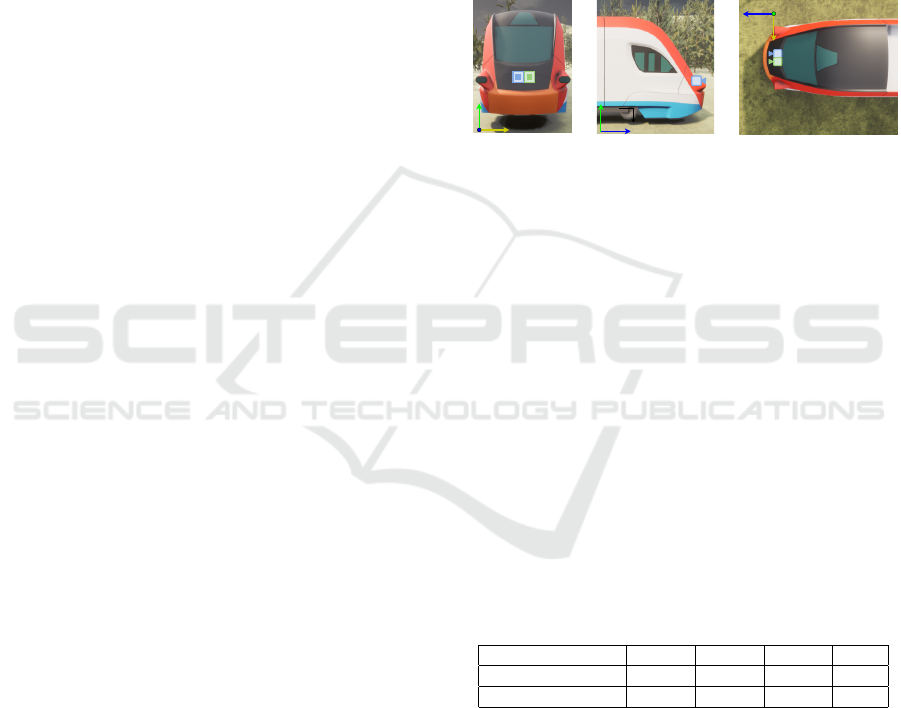
lenging set-up for the proposed method. Fig. 4 shows
the mentioned set-up from three different perspectives
(frontal view, side view, and top-down view).
y
x
z
x
z
y
z
x
Figure 4: Different points-of-view of a train with an on-
boarded camera-pair.
The dataset comprises a collection of images cap-
tured from two calibrated cameras that are closely po-
sitioned to each other. By adjusting the extrinsic pa-
rameters of the cameras, such as rotation and transla-
tion, various levels of decalibration are induced. It is
worth noting that the modifications are independent
along a single axis for both rotation and translation,
allowing for a thorough analysis of the method’s per-
formance under different conditions. These modifica-
tions produce scale changes, small translations, and
non-coplanar relationships between the transformed
points. Table 1 provides further details on the specific
ranges of rotation and translation applied to create the
dataset. In total 1152 images have been created, based
on urban or rural environments, and different weather
conditions (sunny, foggy, and rainy).
Table 1: Translation (centimeters) and rotation (degrees)
axes modification ranges.
Modified ranges x-axis y-axis z-axis step
Translation [-5, 6] [-5, 6] [-5, 6] 1
Rotation [-3, 3] [-3, 3] [-3, 3] 0.25
4.2 Experiments
This section outlines the various experiments that
have been performed to determine if the proposed
method can distinguish between a calibrated set of
cameras and an out-of-calibration one. To achieve
this, a baseline case has been established using a cal-
ibrated camera set from the sunny rural scene. This
allows for measuring the similarity degree from the
baseline set and formulating a hypothesis: any sim-
VISAPP 2024 - 19th International Conference on Computer Vision Theory and Applications
320
ilarity degree measured within an out-of-calibration
set should provide a lower similarity degree than the
one obtained in the baseline case. The produced out-
of-calibration cases are created by fixing one cam-
era to help the analysis. In other words, one cam-
era retains its calibrated extrinsic configuration while
the other slightly modifies its pose based on the val-
ues shown in Table 1. To assess whether the pro-
posed method performs well regardless of which cam-
era falls out of calibration, experiments are conducted
in both ways: keeping the baseline extrinsic param-
eters for camera 1 and modifying camera 2’s pose,
and vice versa. The following steps involve compar-
ing the similarity degree between the baseline case
and the extrinsic pose modifications considered in the
dataset. Additionally, this section presents the differ-
ent feature extractors used to obtain feature vectors
from each radial slice for each image.
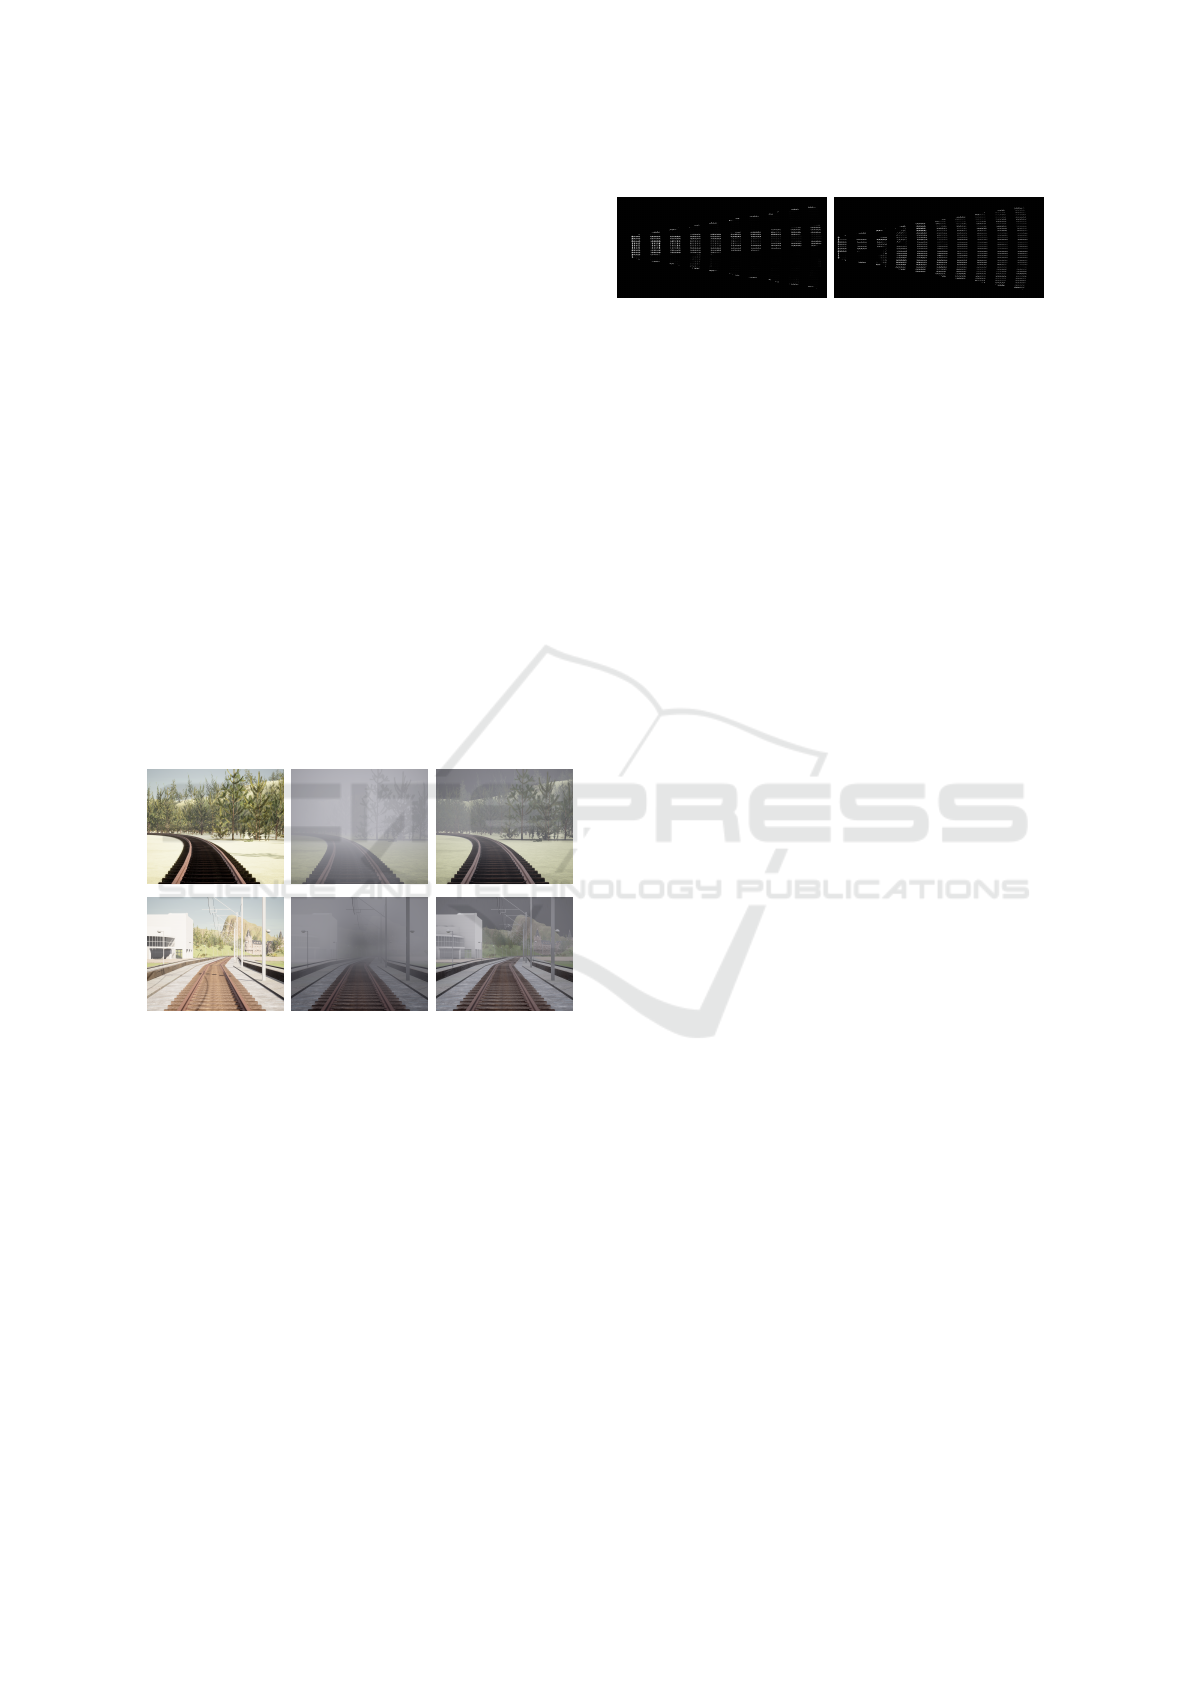
4.2.1 Scenes
Two different scenes (rural and urban) have been
considered under three distinct weather conditions
(sunny, foggy, and rainy). Fig. 5 shows a sample im-
age for each case.
Figure 5: Sample images from rural and urban scenes under
sunny, foggy, and rainy weather conditions for one camera.
4.2.2 Features Extraction
As described in Section 3.3, the proposed method al-
lows for the application of multiple feature extractors
to get relevant patterns and features from each slice
of the radial grid. We explore the use of both image-
processing traditional feature extraction methods and
techniques based on deep learning.
Traditional Feature Extractor. Our aim is to ana-
lyze the visual properties of images that may be per-
ceived differently based on camera calibration, such
as edge and line orientations, to provide valuable in-
sights into their calibration status. It is crucial to use
a feature extractor robust to photometric variations
for this purpose. The histogram of oriented gradients
Figure 6: Structural dissimilarities between a calibrated
(left) and a decalibrated (right) BEV image using HOG fea-
ture descriptor. The odd slices of the radial grid from the
same camera are shown for comparison.
(HOG) feature descriptor is an adequate choice since
it captures the orientation information of edges and
lines in images, making it an ideal tool for detecting
changes in camera calibration. Fig. 6 demonstrates
the suitability of the HOG feature descriptor for an-
alyzing the structural dissimilarities between two im-
ages. In this figure, the odd slices from the radial grid
of the same camera are displayed in both a calibrated
(left) and an out-of-calibration (right) case. The HOG
feature descriptor’s ability to capture edge and line
orientations in images makes it effective in detecting
changes in their geometric structure caused by differ-
ences in cameras’ calibrations.
Deep Learning-Based Approaches. In deep neural
networks (DNNs), the initial layers capture low-level
features such as corners, lines, and edges. There-
fore, these are the layers we are interested in. Two
widely-used DNN architectures are examined: the
ResNet-18 network (He et al., 2016), pre-trained on
the generalist ImageNet dataset (Deng et al., 2009),
and a modified version of the Yolo-P network (Wu
et al., 2022) trained specifically on railway environ-
ment data. The objective is to assess the perfor-
mance of both approaches in detecting calibration is-
sues and generalization capabilities. In Fig. 7, exam-
ples of feature maps from some of the filters of the
first layer in ResNet-18 (left) and Yolo-P (right) are
displayed. Particularly, in the Yolo-P case, lines and
edges are more pronounced compared to the ResNet-
18 case, where lower-level features are more promi-
nent. This difference can be attributed to ResNet-18
being pre-trained on a generalist dataset, while Yolo-
P is trained specifically for rail track detection. Ad-
ditionally, Yolo-P’s first layer is located within a fo-
cus block, which selectively enhances significant in-
formation while discarding irrelevant details based on
the domain-specific knowledge acquired during train-
ing.
4.3 Results and Analysis
This section presents the most relevant results from
the previously explained experiments. We analyze
the suitability of our method based on the different
Calibration-Accuracy Measurement in Railway Overlapping Multi-Camera Systems
321
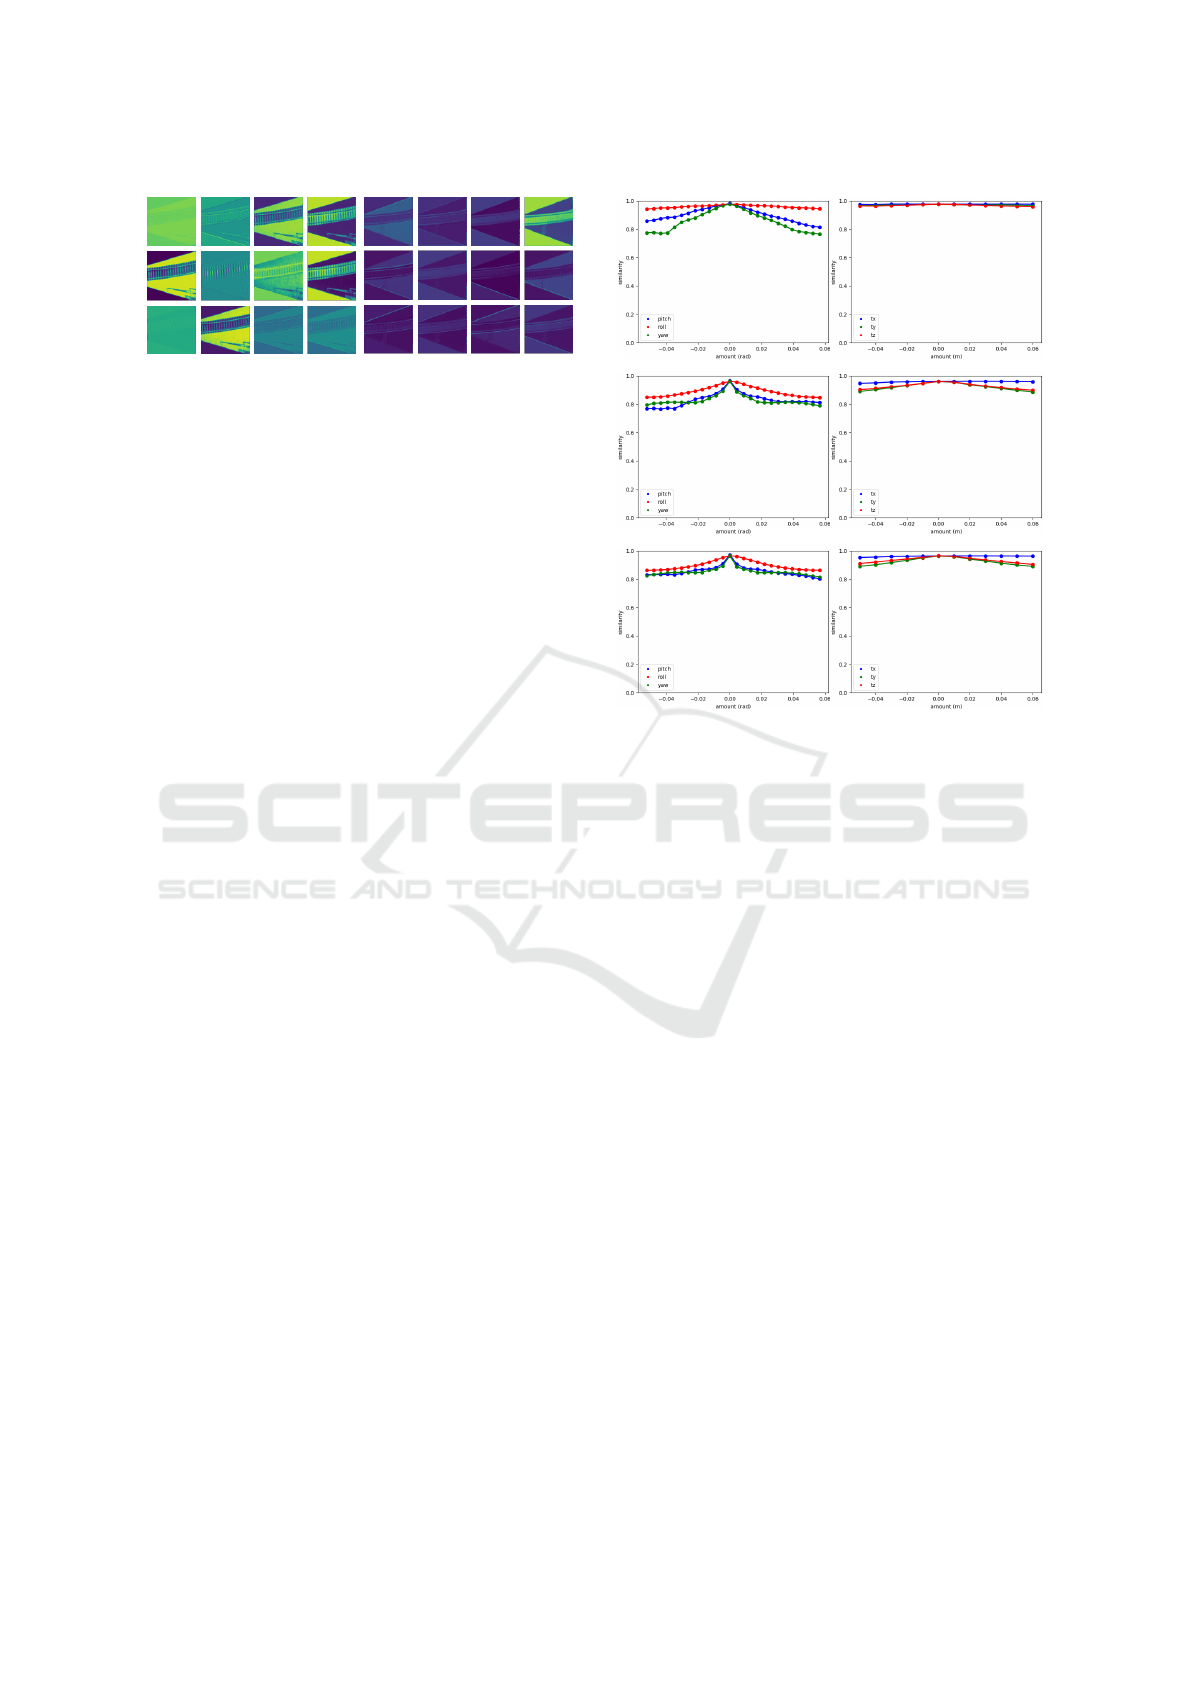
Figure 7: Comparison of feature maps, output from the first
layer of ResNet-18 (left) and Yolo-P (right).
feature extractors and their similarity threshold to de-
termine if the analyzed camera pair has become out-
of-calibration. We also analyze the performance of
the proposed methodology and its ability to accurately
detect changes in camera calibration.
4.3.1 Results
We evaluate the performance of HOG, ResNet-18,
and Yolo-P feature extractors in generating robust fea-
tures for comparing the similarity degree between im-
ages from two cameras within the same scene. Specif-
ically, we assess their performance in a sunny rural
scene while modifying the rotation axes of one cam-
era and keeping the other calibrated (Fig. 8, first col-
umn). Additionally, we analyze modifications to the
translation axes (Fig. 8, second column). We also
present a similar comparison for foggy and rainy en-
vironments in both rural and urban scenes, as depicted
in Fig. 9, focusing on the Yolo-P feature extractor.
4.3.2 Analysis
The effectiveness of the method is illustrated in Fig.
8 and Fig. 9. Regardless of the weather condi-
tions or scene environment, these figures report how
the method accurately captures the decay in simi-
larities when a rotation or translation noise is in-
troduced to one of the cameras from the calibrated
camera pair. Ideally, the decay in similarity should
follow a smooth, decreasing, and exponential trend.
Since the level of camera pair calibration quality is
directly related to the cameras’ application context,
the recalibration trigger of the method can be cus-
tomized. This trigger is represented by the similar-
ity threshold value, which can be determined empiri-
cally by observing the behaviour of the method on the
dataset. An in-depth analysis of the feature extrac-
tors employed in our work is performed to identify
the most suitable one that aligns with the mentioned
decay requirements. Thus, we need to examine two
key aspects: the decay trend of the similarity degree
when extrinsic modifications are introduced to one
of the camera pairs, and the deviation of each mea-
sured similarity from the theoretical ideal decay line.
Figure 8: Similarity degree comparison of feature extrac-
tors in a sunny rural scene. The first column displays ro-
tation axes modifications, while the second column repre-
sents translation modifications. Rows correspond to feature
extractors: HOG, ResNet-18, and Yolo-P.
To establish a baseline, an ideal decay line is used,
which must meet the previously mentioned require-
ments: smoothness, a decrease from the baseline cal-
ibrated similarity, and an exponential decay pattern.
Fig. 10 illustrates two examples from an urban scene,
captured under foggy (left) and sunny (right) condi-
tions. The similarity values in these examples have
been calculated using the HOG and Yolo-P feature
extractors for a roll and a translation in the z-axis,
respectively. Features extracted from the ResNet-
18 approach present similar behaviours. The orange
lines represent the ideal decay trends, while the green-
dashed lines correspond to the similarity threshold
values empirically set. Samples exceeding the simi-
larity threshold are considered part of the calibrated
set and are depicted in green, while red samples in-
dicate potential decalibrated cases. To assess the de-
cay trend for each feature extractor, it is important to
ensure a consistent decrease in the measured similar-
ities; otherwise, penalization is applied. Furthermore,
we compute and evaluate the distance between each
sample and the ideal decay line, aiming for minimal
deviation.
Table 2 presents the percentage at which each
feature extractor provides similarity values that align
with the explained criteria for similarity decay. Also,
VISAPP 2024 - 19th International Conference on Computer Vision Theory and Applications
322
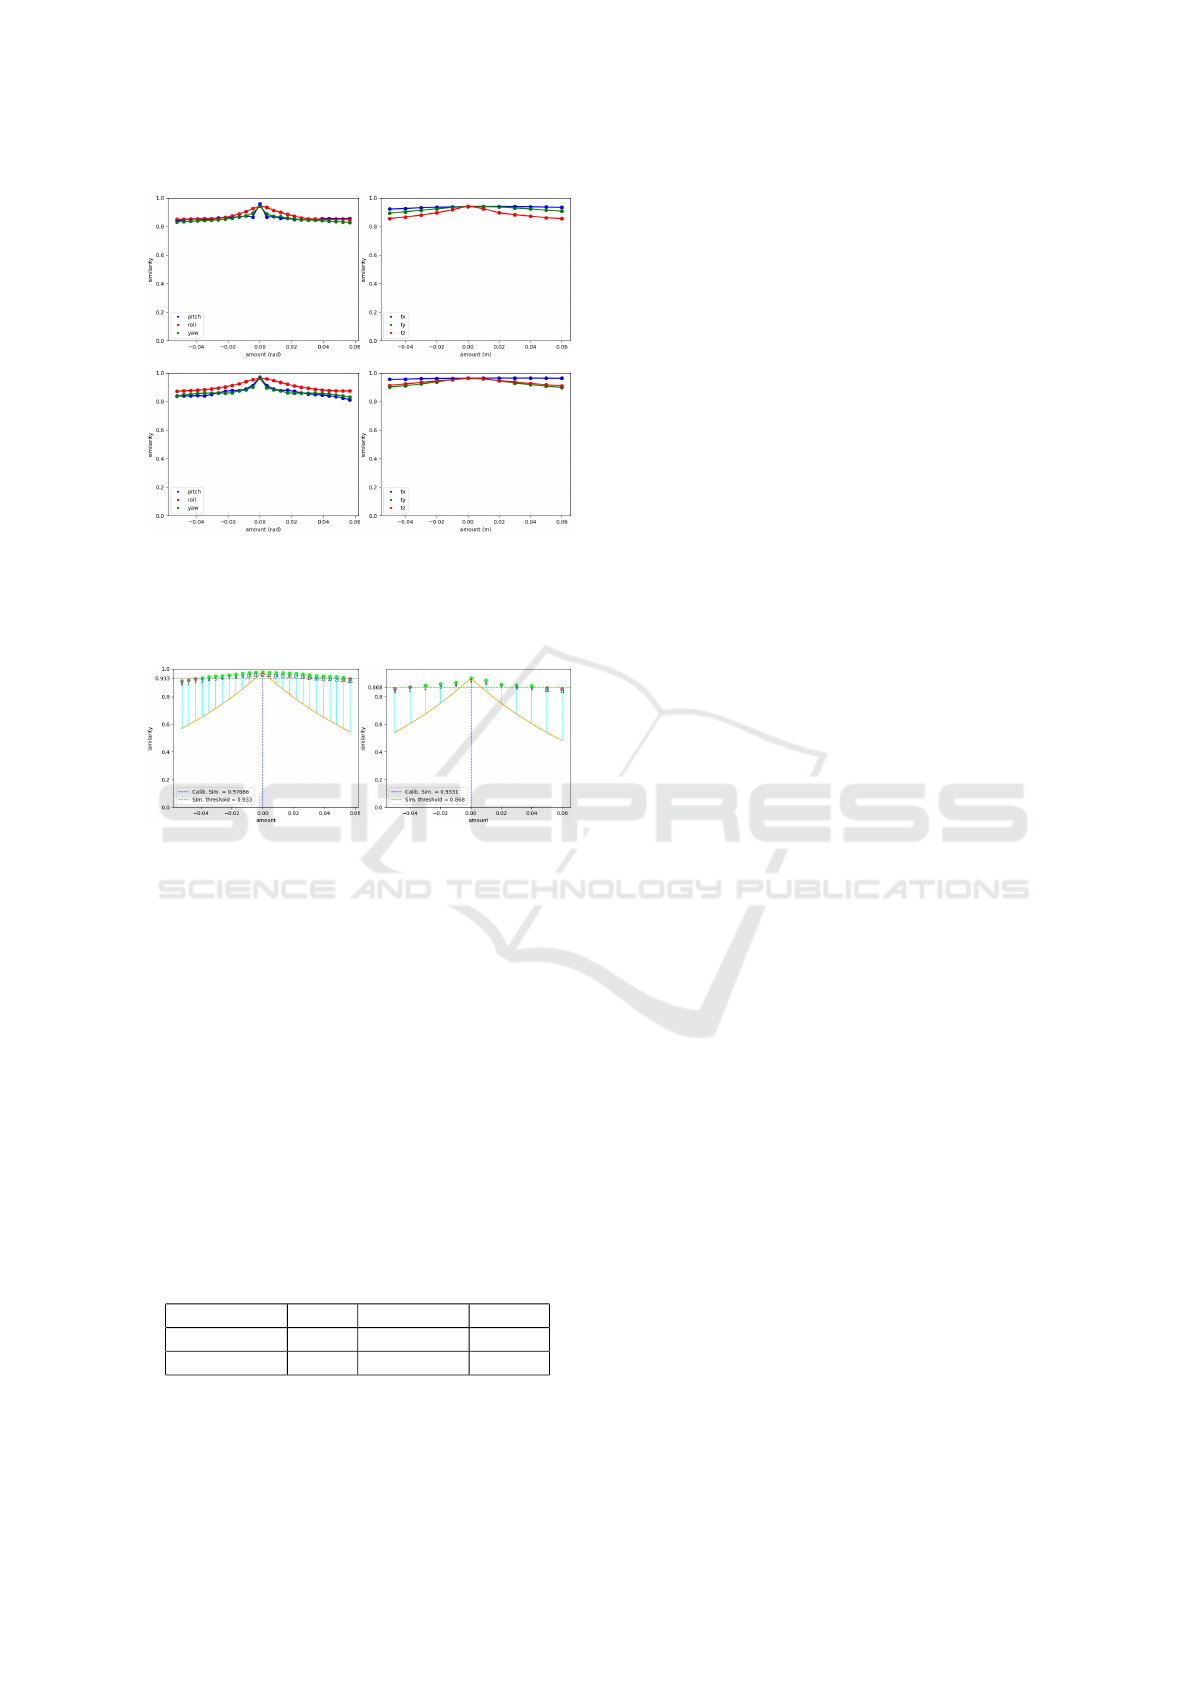
Figure 9: Similarity degrees for foggy urban (top row) and
rural rainy (bottom row) cases using the Yolo-P feature ex-
tractor. The left column represents modifications in rotation
axes, while the right column represents variations in trans-
lation.
Figure 10: Comparison of foggy (left) and sunny (right)
conditions in an urban scene using HOG and YOLO-P fea-
ture extractors for roll modification and z-axis translation,
respectively.
it indicates the percentage of times a specific extractor
provides features whose similarity values are closer
to the ideal decay. From the table it becomes evident
that Yolo-P consistently demonstrates the highest per-
centage of occurrences in both cases, making it the
most suitable feature extractor within the context of
the method presented in this paper. In contrast, HOG
performs poorly in comparison to the other extractors.
In general, the similarity decay associated with HOG
tends to be slow, with occasional fluctuations that may
appear as side lobes. These observations suggest that
HOG may not be the most effective choice for the pur-
pose of this study.
Table 2: Extractor performance summary based on similar-
ity decay.
HOG ResNet-18 Yolo-P
Trend % 0 42.5 42.5
Distance % 0 16.7 83.3
It can also be observed that detecting translation
modifications poses a greater challenge than rotation
modifications for the three extractors. Specifically,
calibration issues are less notorious when they come
from translations along the x and y-axes within the
camera pair. This is because these transformations
do not introduce non-coplanar relationships between
the projected points in the images. However, modi-
fications applied to the z-axis of either camera in the
pair result in scale changes in the BEV image. These
scale changes lead to more noticeable geometric mis-
alignment in the analyzed pair, clearly indicating a de-
crease in calibration accuracy between the cameras.
5 CONCLUSIONS
Monitoring calibration accuracy for a camera set em-
bedded in a sensor set-up is crucial to ensure its re-
liable use. In this paper, we propose a method to
measure the calibration accuracy between a pair of
cameras. Our method takes as input the extrinsic and
intrinsic parameters of the cameras, along with cap-
tures of the scene observed by both cameras. Each
image is then projected into a BEV perspective, and
a radial grid is applied to weigh the contribution of
pixels based on their distance from the camera’s opti-
cal center. Low-level features are extracted from each
slice of the transformed images, and the disparity be-
tween corresponding slices is measured. These dis-
parity measurements determine the calibration accu-
racy of the camera system.
The results and subsequent analysis demonstrate
that our proposed method effectively provides the cal-
ibration accuracy of the camera pair. We analyze
the suitability of different feature extractors for our
method and conclude that a DNN (Yolo-P) trained on
domain-specific data yields the most relevant features
for analyzing the similarity degree between the cap-
tured images. Additionally, based on its extracted
features, the calculated similarity decay exhibits a
smooth, decreasing trend that follows an exponential
shape.
Overall, the satisfactory results achieved by our
method lay a solid foundation for developing a com-
prehensive online camera calibration pipeline, as our
method can be transformed into an optimization prob-
lem. As part of our future work, we aim to extend
the capabilities of our method by incorporating au-
tomatic camera pose correction for out-of-calibration
cameras.
Calibration-Accuracy Measurement in Railway Overlapping Multi-Camera Systems
323

ACKNOWLEDGEMENTS
This work has received funding from Basque Gov-
ernment under project AutoTrust of the program
ELKARTEK-2023.
REFERENCES
Chen, Y., Zhang, L., Shen, Y., Zhao, B. N., and Zhou, Y.
(2022). Extrinsic self-calibration of the surround-view
system: A weakly supervised approach. IEEE Trans-
actions on Multimedia.
Deng, J., Dong, W., Socher, R., Li, L.-J., Li, K., and Fei-
Fei, L. (2009). Imagenet: A large-scale hierarchical
image database. In 2009 IEEE conference on com-
puter vision and pattern recognition, pages 248–255.
Ieee.
Georgiev, M., Boev, A., Gotchev, A., and Hannuksela, M.
(2010). Influence of camera parameters on the qual-
ity of mobile 3d capture. In Multimedia on Mobile
Devices 2010, volume 7542, pages 246–257. SPIE.
He, D., Zou, Z., Chen, Y., Liu, B., Yao, X., and Shan, S.
(2021). Obstacle detection of rail transit based on deep
learning. Measurement, 176:109241.
He, K., Zhang, X., Ren, S., and Sun, J. (2016). Deep resid-
ual learning for image recognition. In Proceedings of
the IEEE conference on computer vision and pattern
recognition, pages 770–778.
Heng, L., Choi, B., Cui, Z., Geppert, M., Hu, S., Kuan,
B., Liu, P., Nguyen, R., Yeo, Y. C., Geiger, A., et al.
(2019). Project autovision: Localization and 3d scene
perception for an autonomous vehicle with a multi-
camera system. In 2019 International Conference on
Robotics and Automation (ICRA), pages 4695–4702.
IEEE.
I
˜
niguez de Gordoa, J. A., Garc
´
ıa, S., P
´
erez, L., Urbieta,
I., Aranjuelo, N., Nieto, M., and Ochoa, D. (2023).
Scenario-based validation of automated train systems
using a 3d virtual railway environment. in press.
Liu, X., Zhang, L., Shen, Y., Zhang, S., and Zhao, S. (2019).
Online camera pose optimization for the surround-
view system. In Proceedings of the 27th ACM Inter-
national Conference on Multimedia, pages 383–391.
S
´
anchez, M., I
˜
niguez de Gordoa, J. A., Nieto, M., and Car-
balleira, P. (2023). Method for the automatic measure-
ment of camera-calibration quality in a surround-view
system. In Fifteenth International Conference on Ma-
chine Vision (ICMV 2022), volume 12701, pages 428–
436. SPIE.
Wu, D., Liao, M.-W., Zhang, W.-T., Wang, X.-G., Bai, X.,
Cheng, W.-Q., and Liu, W.-Y. (2022). Yolop: You
only look once for panoptic driving perception. Ma-
chine Intelligence Research, 19(6):550–562.
Yanan, S., Hui, Z., Li, L., and Hang, Z. (2018). Rail surface
defect detection method based on yolov3 deep learn-
ing networks. In 2018 chinese automation congress
(CAC), pages 1563–1568. IEEE.
Yin, J., Tang, T., Yang, L., Xun, J., Huang, Y., and Gao,
Z. (2017). Research and development of automatic
train operation for railway transportation systems: A
survey. Transportation Research Part C: Emerging
Technologies, 85:548–572.
Zhang, T., Zhang, L., Shen, Y., Ma, Y., Zhao, S., and Zhou,
Y. (2020). Oecs: Towards online extrinsics correction
for the surround-view system. In 2020 IEEE Interna-
tional Conference on Multimedia and Expo (ICME),
pages 1–6. IEEE.
Zhang, T., Zhao, N., Shen, Y., Shao, X., Zhang, L., and
Zhou, Y. (2021). Roecs: A robust semi-direct pipeline
towards online extrinsics correction of the surround-
view system. In Proceedings of the 29th ACM Interna-
tional Conference on Multimedia, pages 3153–3161.
VISAPP 2024 - 19th International Conference on Computer Vision Theory and Applications
324
