
Cybersecurity Intrusion Detection with Image Classification Model
Using Hilbert Curve
Punyawat Jaroensiripong
1 a
, Karin Sumongkayothin
1 b
, Prarinya Siritanawan
2 c
and Kazunori Kotani
2
1
Department of Computer Engineering, Faculty of Engineering, Mahidol University, Thailand
2
Japan Advanced Institute of Science and Technology, Japan
Keywords:
Machine Learning (ML), Deep Learning (DL), Cybersecurity, Security Operation Center (SOC), Intrusion
Detection System (IDS), Hilbert Curve.
Abstract:
Cybersecurity intrusion detection is crucial for protecting an online system from cyber-attacks. Traditional
monitoring methods used in the Security Operation Center (SOC) are insufficient to handle the vast volume
of traffic data, producing an overwhelming number of false alarms, and eventually resulting in the neglect
of intrusion incidents. The recent integration of Machine Learning (ML) and Deep Learning (DL) into SOC
monitoring systems has enhanced the intrusion detection capabilities by learning the patterns of network traf-
fic data. Despite many ML methods implemented for intrusion detection, the Convolutional Neural Network
(CNN), one of the most high-performing ML algorithms, has not been widely adopted for the intrusion de-
tection systems. This research aims to explore the potentials of CNN implementation with the network data
flows. Since the CNN was originally designed for image processing applications, it is necessary to convert the
1-dimensional network data flows into 2-dimensional image data. This research presents a novel approach to
convert the network data flow into an image (flow-to-image) by the Hilbert curve mapping algorithm which
can preserve the locality of the data. Then, we apply the converted images to the CNN-based intrusion de-
tection system. Eventually, the proposed method and model can outperform the recent methods with 92.43%
accuracy and 93.05% F1-score on the CIC-IDS2017 dataset, and 81.78% accuracy and 83.46% F1-score on
the NSL-KDD dataset. In addition to the classification capability, the flow-to-image mapping algorithm can
also visualize the characteristics of the network attack on the images visually, which can be an alternative
monitoring approach for SOC.
1 INTRODUCTION
In the digital age, organizations are required to protect
crucial and confidential data from malicious offenders
who seek to exploit the system vulnerabilities to gain
unauthorized access to sensitive information. There-
fore, cybersecurity becomes vital for the prevention
of unauthorized access. Currently, the Security Oper-
ations Center (SOC) is widely established to monitor
the computer network and respond to network intru-
sion incidents according to the organization’s cyber-
security policies.
Nevertheless, traditional intrusion detection meth-
ods typically implement rule-based filters to identify
a
https://orcid.org/0009-0009-3741-821X
b
https://orcid.org/0000-0001-6098-6228
c
https://orcid.org/0000-0002-9023-3208
the potential threats and alert human operators moni-
toring the network system for intervention. These fil-
ters often yield a lot of alerts that can be overwhelm-
ing for the human operators (Feng et al., 2017), and
this poses a challenge for the operators to identify the
vulnerabilities in time, causing a significant loss to
the organization. Therefore, many organizations have
adopted automation tools based on Machine learn-
ing (ML) and Deep learning (DL) models to enhance
the intrusion monitoring performance by learning the
pattern of the network data under intrusion incidents.
The models can range from simple algorithms such as
logistic regression, to more sophisticated deep neural
network architectures. As a result, there are a number
of ML methods successfully implemented for intru-
sion detection applications. However, the Convolu-
tional Neural Network (CNN) method, which is one
of the pivotal methods in modern ML was rarely con-
Jaroensiripong, P., Sumongkayothin, K., Siritanawan, P. and Kotani, K.
Cybersecurity Intrusion Detection with Image Classification Model Using Hilbert Curve.
DOI: 10.5220/0012306100003660
Paper published under CC license (CC BY-NC-ND 4.0)
In Proceedings of the 19th International Joint Conference on Computer Vision, Imaging and Computer Graphics Theory and Applications (VISIGRAPP 2024) - Volume 2: VISAPP, pages
325-332
ISBN: 978-989-758-679-8; ISSN: 2184-4321
Proceedings Copyright © 2024 by SCITEPRESS – Science and Technology Publications, Lda.
325

sidered for intrusion detection. Therefore, it is in-
triguing to explore the feasibility to applying CNN
method with the network data and evaluate the per-
formance of such a method.
Since the CNN algorithm was originally proposed
for an image processing application requiring im-
ages as the input, it is essential to convert the 1-
dimensional network data flows into 2-dimensional
image data. Network data flow can be represented as
images in various ways, such as the time-based map-
ping method found in (Ho et al., 2022). However,
the existing methods to convert the network data flow
into an image (flow-to-image) do not guarantee the
locality preservation property. Locality preservation
is especially crucial for analyzing network data flow
by CNN, as it reflects the data interactions and depen-
dencies among each sequential feature. To address the
issue of locality preservation, the study of (Sun et al.,
2019) presented a method using the Hilbert curve for
this purpose. However, this method only targets its at-
tacks on LAN systems, such as port scanning, which
can be limited to the real-world attacks.
Our research adopted a similar implementation
scheme of the Hilbert curve mapping algorithm in
(Sun et al., 2019) to transform network data flows into
images and extend its application to broader intrusion
scenarios. The method is to map the values from the
network data flow features over time and then align
them to the image coordinate on the Hilbert curve.
Finally, we obtain images of the network sequence
in grayscale format. Note that we decided to use the
grayscale format due to its simplicity and smaller size,
ideal for large network datasets and avoiding RGB
image padding, making them best suited for our study
and perfectly complements the strengths of the CNN
model in intrusion detection. Furthermore, such vi-
sualization of network data in an image form also al-
lows human observers to better understand the rep-
resentation of the network attacks visually, expand-
ing the possible options for monitoring approaches for
human operators in SOC.
Moreover, we have applied the mapping im-
ages with recent image classification models, in-
cluding EfficientNetB0 (Tan and Le, 2019) and
Vision Transformer (ViT) (Dosovitskiy et al.,
2020). We also introduced our network architecture,
HilxSEED (Hilbert curve x Squeeze-and-Excitation
and Encoder-Decoder), integrated the concepts of
Encoder-Decoder and SENet to capture the relation-
ships within the mapped image from the Hilbert curve
and decode them to produce an output in binary clas-
sification. Finally, the proposed method is trained on
different schemes and evaluated by comparison with
the previous methods on two datasets, the NSL-KDD
dataset (Tavallaee et al., 2009) and the CIC-IDS2017
dataset (Sharafaldin et al., 2018).
2 RELATED WORKS
Internet connection could not be made entirely pri-
vate, leading to confidential data leaks. Thus, the
concept of an Intrusion Detection System (IDS) was
invented. The work of (Anderson, 1980) proposed
the concept of IDS by daily network batch analysis.
Later, (Denning, 1987) introduced the first real-time
IDS framework. The attack techniques were simpler
at that time, allowing the administrator could manu-
ally detect and handle the common intrusions.
As time went by, network architectures have be-
come more complex, along with increased difficulty
in detecting cyber-attacks (Belej et al., 2020). For this
reason, ML and DL were deployed to enhance the ef-
ficiency of IDS. (Saranya et al., 2020) presented the
potential of the classical ML model. (Stolfo et al.,
1999) performed experiments, and compared multi-
ple ML methods. The study of (Belavagi and Mu-
niyal, 2016) expressed the efficiency of classical bi-
nary classification ML, which was trained with the
NSL-KDD dataset. (Liu and Lang, 2019) surveyed
intrusion detection and found that ML and DL be-
came increasingly crucial to the cybersecurity field in
the IDS system.
In the field of DL, LSTM-RNN was used to assist
in IDS for handling the sequential data. The study of
(Muhuri et al., 2020) and (Kim et al., 2016) exper-
imented LSTM-RNN model on the KDD99 dataset,
which showed the highest accuracy with 96.93% ac-
curacy with 100-time steps.
Additionally, DL has been employed for image
classification and is rapidly growing with various ap-
plications. One of the essential growths is the CNN,
inspired by the human brain’s visual cortex, as dis-
cussed in (Zhang et al., 2016). Accordingly, many
researchers have applied the CNN model to both im-
age and non-image data for detecting cyber-attacks in
the network system.
The capability of the CNN model shown in the
study of (Kim et al., 2020) aimed to detect Denial-of-
Service (DoS) attacks which outperform the Recur-
rent Neural Network (RNN). Meanwhile, (Vinayaku-
mar et al., 2017) experimented with the hybrid CNN
architecture, such as CNN-LSTM. For binary classifi-
cation, a single CNN layer achieved 99.9% accuracy
The CNN models are highly performed in inci-
dent detection compared with the other DL models
due to their advanced image processing capabilities.
Many research studies are inspired by image recog-
VISAPP 2024 - 19th International Conference on Computer Vision Theory and Applications
326

nition and converting network data flows into images
for IDS applications. The work of (Khan et al., 2019)
preprocessed the NSL-KDD dataset by transforming
464 dimensions of data into 8 × 8 grayscale images
and using the CNN model to detect the attacks.
Similarly, (Ho et al., 2022) demonstrated the po-
tential of the Vision Transformers (ViT) classifier
with the CIC-IDS2017 dataset for multiclass classi-
fication. This paper selected 24 features and imple-
mented the value mapping in RGB images. As a re-
sult, the experiment showed an accuracy of 88.92%,
outperforming other methods. However, the relation-
ships between the network data flow might not pre-
served due to the directly mapped data into the image.
One notable method for data transformation is
the Hilbert curve that was introduced by (Hilbert,
1891), the fundamental principle is the traversal curve
across the 2D space. The Hilbert curve can transform
1D data into 2D data while preserving the locality
of information. Many researchers have applied this
method in flow-to-image.
Various research studies have demonstrated the
use of the Hilbert curve technique. The study of (Vu
et al., 2020) implemented the Hybrid Image Transfor-
mation (HIT) to produce RGB images for malware
classification. The HIT that uses the Hilbert curve
technique and CNN model could outperform other
methods, achieving a 93.01% accuracy. (Sun et al.,
2019) implemented the CNN model to analyze the
generated data from cyber-attack simulations within
a LAN environment. The Hilbert curve maps the
nine protocol features into a single image. Notably,
the scope of their research was limited to the specific
environment they established, which focused on port
scans.
Despite the high potential of using the Hilbert
curve for flow-to-image transformation and using an
image classification model in real-world data, this ap-
plication has not been widely adopted in cybersecu-
rity. Hence, introduced a network data flow transfor-
mation for incident detection, improving attack detec-
tion precision by compressing multiple network pack-
ets into an image using the Hilbert curve’s character-
istics and leveraging CNN capabilities.
3 METHOD
To harness advanced image processing capabilities
for incident detection, our method utilizes the locality
preservation from the Hilbert curve for data transfor-
mation and employs a CNN model for network attack
detection. This section is segmented into four distinct
sections.
3.1 Preprocessing Network Data Flow
In preparing the network data flow, we transformed
non-computable data into computable data by elim-
inating string-based or null values and applied One-
Hot Encoding to transform categorical variables into
unique binary numerical representation columns. Af-
ter that, we focused on utilizing grayscale images.
Therefore, the Min-Max normalization method was
used to normalize the data to fit in [0, 1]. The equa-
tion is shown in Eq (1).
x
scale
=
x − x
min
x
max
− x
min
(1)
3.2 Data Transformation Using Hilbert
Curve and Arrangement of the
Features
The Hilbert curve will be used to transform network
data flows into 2D images by mapping preprocessed
values according to the Hilbert curve’s coordinates.
Consequently, the image will be formed, and the size
will vary by the order of the Hilbert curve.
The order of the Hilbert curve is described as the
number of iterations used to generate the space-filling
curve and it indicates the data quantity mapped to
an image by 2
2×order
where order is the order of the
Hilbert curve.
3.2.1 Image Formation from Network Data
Flows
Before mapping network data flow values, we selec-
tively dropped features we dropped features with the
least significant correlation to attack labels by consid-
ering the Pearson correlation coefficient (PCC). The
PCC equation is shown in Eq (2).
r =
∑
(x
i
− ¯x)(y
i
− ¯y)
p
∑
(x
i
− ¯x)
2
∑
(y
i
− ¯y)
2
(2)
Where x
i
and y
i
are the individual data points. And
¯x and ¯y are the means of x and y respectively.
To ensure the generation of a rectangular image,
the number of features should be factorizable into
two integer components. Let f
1
and f
2
be the two
closest factors. Furthermore, the height and width of
the image should not be extremely different given the
threshold difference between f
1
and f
2
is 5.
3.2.2 Mapping Network Data Flows into an
Image by Hilbert Curve
To transform the network data flows into an image,
the network data flow’s values were mapped over time
Cybersecurity Intrusion Detection with Image Classification Model Using Hilbert Curve
327
onto the coordinates of the Hilbert curve which is de-
termined in Algorithm 1.
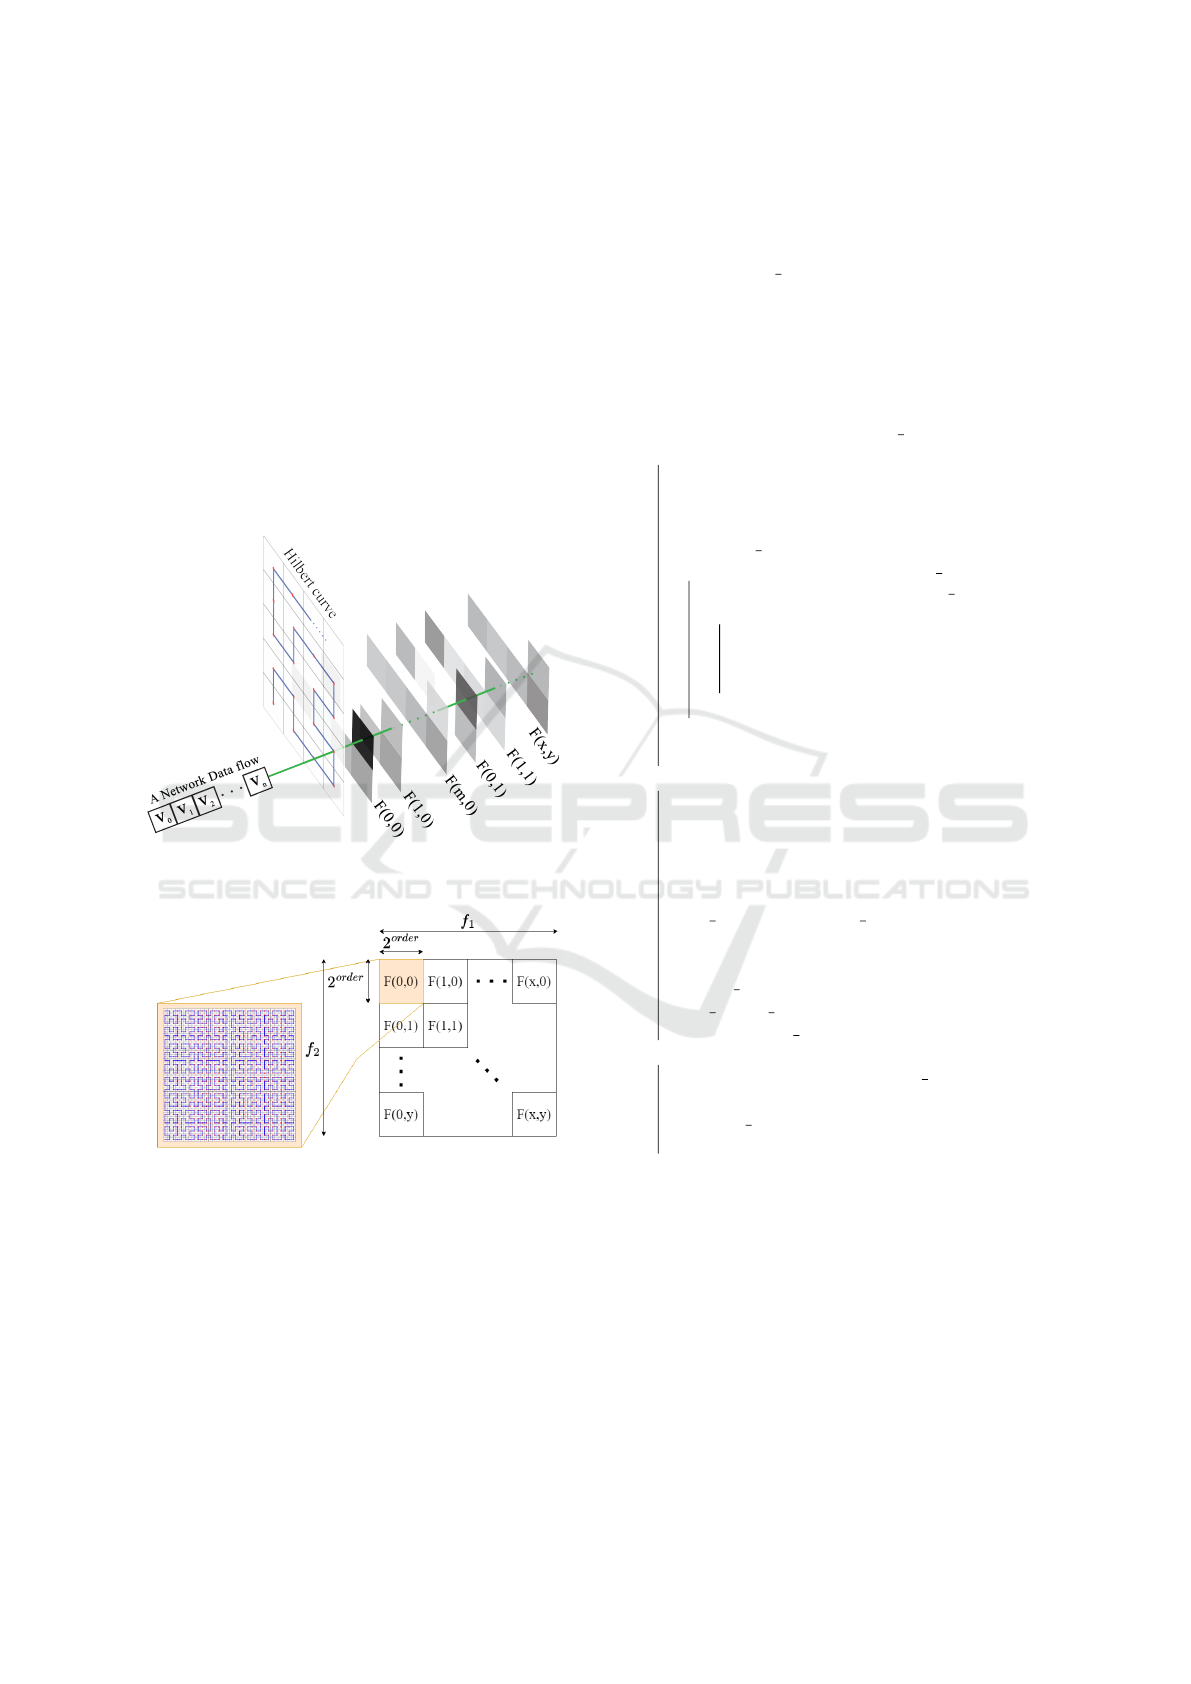
The Figure 1 is shown the Hilbert curve mapping
procedure, when:
1. n represents the number of features.
2. v
n
is the feature’s value.
3. F
n
is the layer of the mapped image.
Consequently, each coordinate of the result image
contains data from a single network data flow. We ob-
tain multi-layer image data in which each layer con-
tains a single feature’s value. Finally, we rearrange it
into a single-layer grayscale image by f
1
as width and
f
2
as height. The arrangement is shown in Figure 2.
Figure 1: The visualization of mapping network data flow
by Hilbert curve.
Figure 2: Features arrangement.
3.3 Training and Testing with CNN
Classification Model
The experimental dataset was divided into three parts:
training set, validation set, and testing set. We split
the network dataset into two main halves by 50% of
the total data. The first half is divided into a train-
ing set (70%) and a testing set (30%). The other half
is used as the testing set. However, if the dataset is
pre-partitioned, it can be used as the specific require-
ments.
Input: network f low (DataFrame
representing network data flow),
coordinates (Hilbert curve
coordinates), order (order of the
Hilbert curve)
Output: A Image representing a sequence of
the network data flow
Function MakeImage(network f low,
coordinates, order):
size ← 2
order
;
image ← Array of zeros with dimensions
(size, size, number of features in
network f low);
for each row index n in network f low do
for each feature F in network f low
do
x, y ← coordinates[n];
image[x][y][F] ← v
n
;
; // Map value to pixel
end
end
return image;
Function ConcatImage(image, x, y, size):
// Rearrange the multi-layered
image into a grid format for
concatenation
image ← rearrange and reshape image
to prepare for concatenation;
size X ← x × size; size Y ← y × size;
// Flatten the rearranged image
into a single layer
concat image ← image.reshape(
size X, size Y );
return concat image;
Function Main:
image ← MakeImage(network f low,
coordinates, order);
network img ← ConcatImage(image, x,
y, order);
Algorithm 1: Mapping Network Data Flow Features to Im-
age Layers and Concatenating into a Single Layer.
The HilxSEED model, which is based on the CNN
network, integrated the concept of Encoder-Decoder
with Squeeze-and-Excitation Networks (SENet) (Hu
et al., 2020). The model aims to leverage enhanced
convolutional feature representation by dynamically
adjusting channel-wise responses and detecting the
relationships between the channels of the CNN lay-
ers using SENet blocks. The Encoder compresses the
important information within the image and the De-
VISAPP 2024 - 19th International Conference on Computer Vision Theory and Applications
328
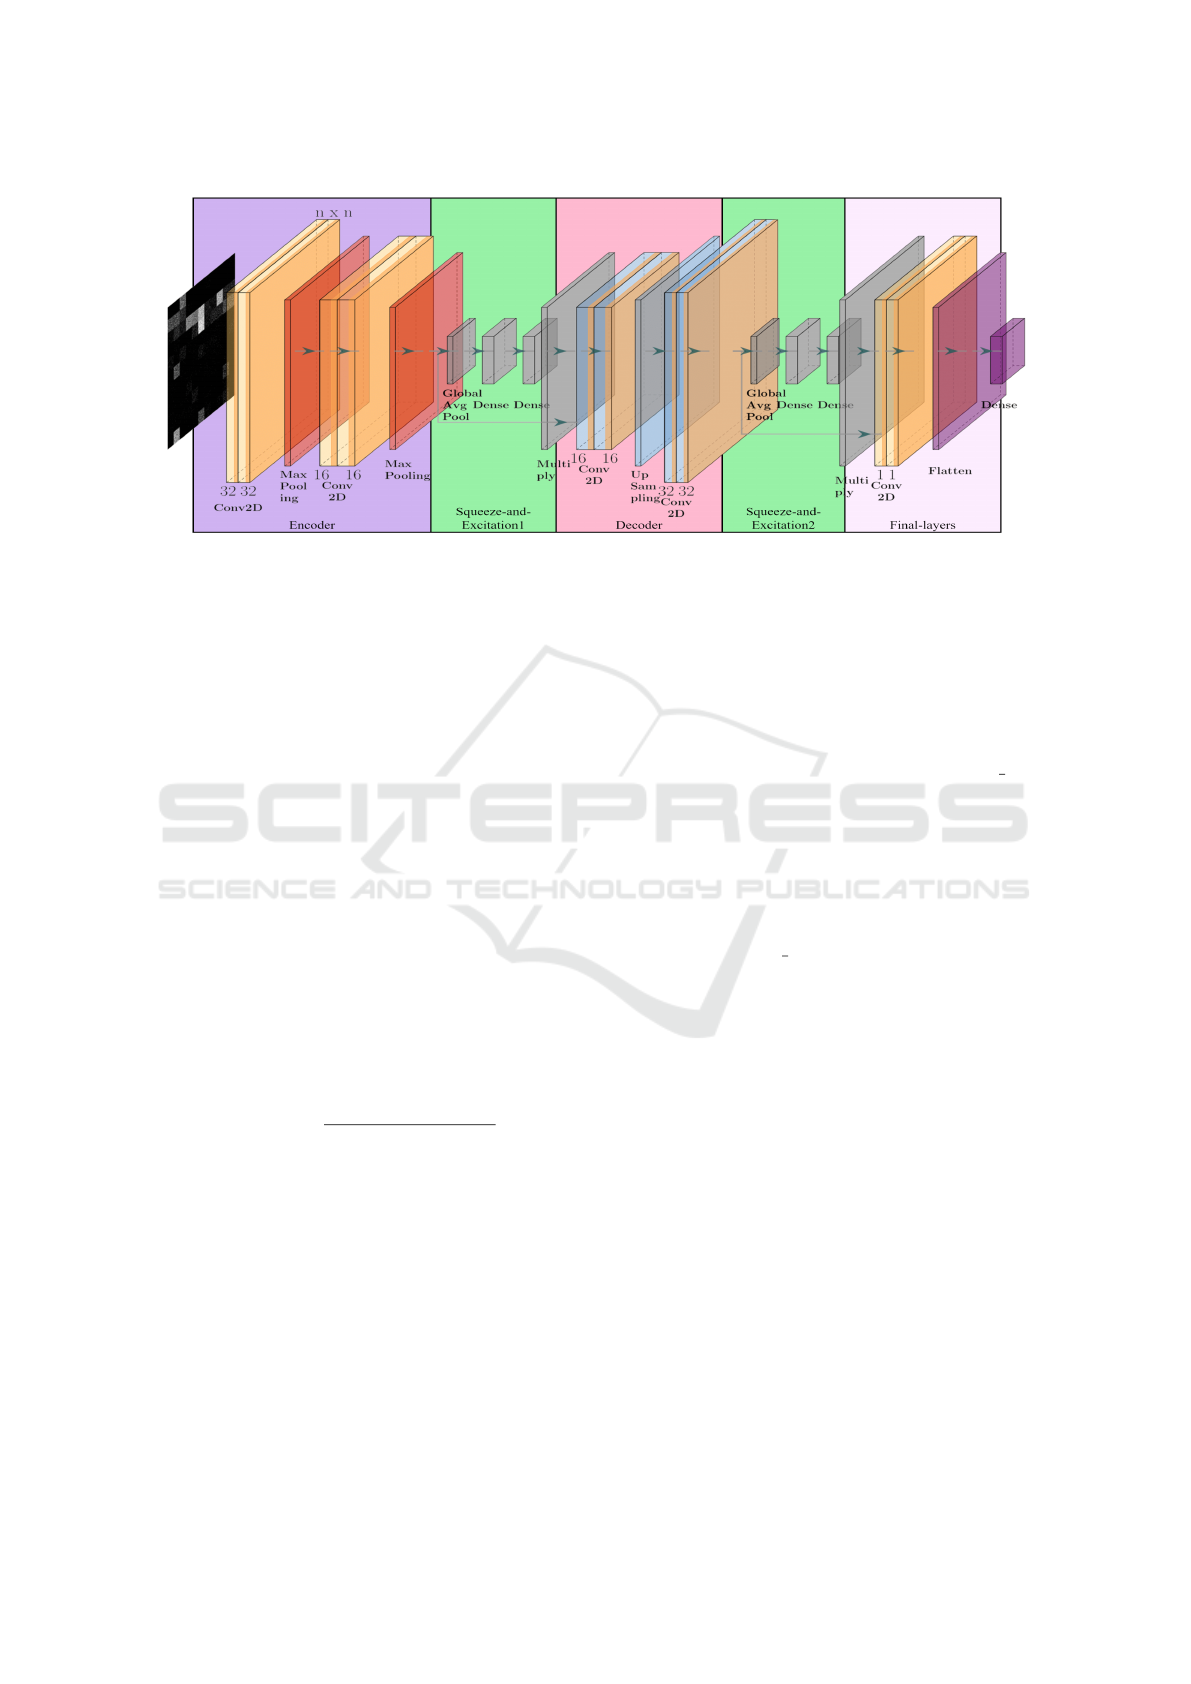
Figure 3: HilxSEED Model.
coder reconstructs to its original dimensions. The
model configuration used Adam Optimizer with a
0.001 learning rate and Binary Cross entropy as a loss
function. The model is shown in the Figure 3
3.4 Model Evaluation
In this research, the model evaluation was performed
using the testing dataset. In the previous section, the
separated Testing dataset is the former half of the net-
work data flow. The evaluation metrics used were F1-
score, Accuracy, Precision, and Recall.
The F1-score, is a harmonic mean of Precision
and Recall, particularly in incident detection with low
false alarms. Precision indicates prediction quality;
high Precision means the model predicts a positive
case. The Recall is defined as the completeness of
detection; high Recall means the prediction does not
miss a genuine incident.
The accuracy is determined as the true positive
that the model predictions are corrected compared
with all predictions. The equation is found in Eq. (3)
Accuracy =
T P +T N
T P +FP + T N + FN
(3)
4 EXPERIMENTAL RESULTS
In this section, we explain the experimental settings
and configuration, along with the outcomes observed
from our proposed model in intrusion detection.
4.1 Experimental Setting
In this study, we used two datasets: the NSL-KDD as
the baseline and the CIC-IDS2017 for real-world-like
scenarios.
NSL-KDD Dataset: was prepared following these
steps.
• Using One-hot encoding to convert the categori-
cal variables into numerical data for further calcu-
lation, where each data category was mapped to
a unique binary numerical vector representing the
presence or absence of data. The categorical vari-
ables are in the following features: protocol type,
service, and flag.
• Using Train+ as training and validation sets, di-
viding them into 70% and 30%, respectively.
Test+ was used to evaluate the proposed model.
• The dataset is originally sorted by time, so the
sorting step can be omitted.
• The feature ’srv
count’ will be drop considered
by the lowest PCC in equation (2). Arranging fea-
tures into a full rectangle image by factorizing the
number of features and selectively dropping the
excess features by the lowest which was
CIC-IDS2017 Dataset: was prepared following
these steps.
• Removing NaN and infinity values, these values
are likely caused by division by zero in rate calcu-
lations, anomalies during data collection, or errors
in data processing.
• Since this dataset does not provide a predefined
data split, we divided it by 50%. The first half was
the training set and the validation set with 70%
and 30%, respectively, and the former half was
the testing set.
• Sorted the dataset by timestamp feature to se-
quence the data, dropped some of the Non-
numeric features, and randomly dropped BENIGN
to ensure the balance between the attack.
Cybersecurity Intrusion Detection with Image Classification Model Using Hilbert Curve
329
• The feature ’bwd avg bulk rate.’ will be drop
considered by the lowest PCC in equation (2).
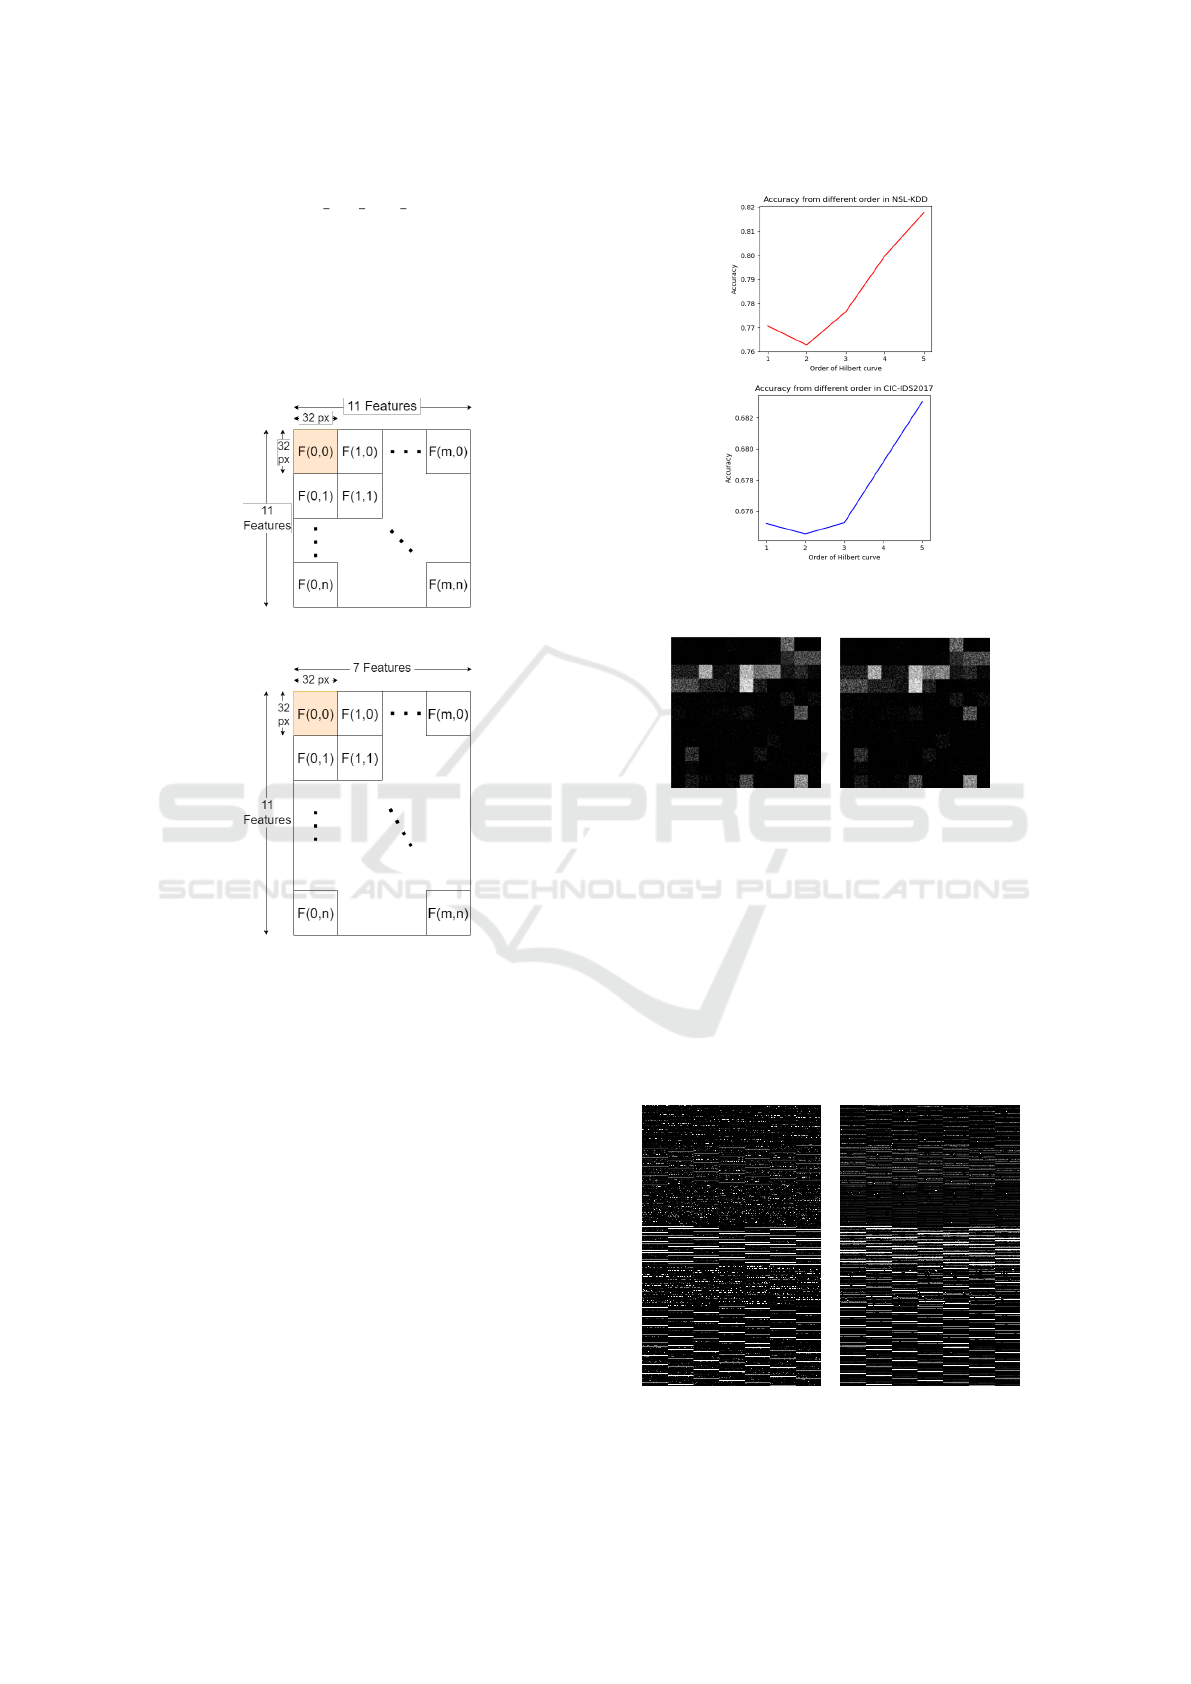
After dropping certain features, we mapped the
data over time to image coordinates by the Hilbert
curve. Then, we arranged the multi-layer image into
a single grayscale image. The arrangement of each
dataset is shown in Figure 4. Finally, we obtained the
network images, which are shown in Figure 6 and 7.
(a) NSL-KDD features arrange-
ment
(b) CIC-IDS2017 features ar-
rangement
Figure 4: The arranging network data feature in each
dataset.
4.2 Experimental Results
The experiments showed that the proposed Hilbert
curve flow-to-image method could enhance the effi-
ciency of intrusion detection. When comparing the
use of regular network data flows with the LSTM-
RNN model and the use of images converted from
flow-to-image, testing with the proposed HilxSEED
model resulted in higher accuracy and F1-Score in
both datasets. Moreover, the HilxSEED model was
competent and outperformed the classical ML and the
recent models including EfficientNetB0 and Vision
Transformer (ViT). The experimental results of using
the Hilbert curve mapping image method are shown
in table 1.
The HilxSEED model has shown satisfactory re-
sults in intrusion detection, demonstrated with two
Figure 5: Order of Hilbert curve and the accuracy of the
proposed model.
(a) Normal (b) Ipsweep
Figure 6: Example image from NSL-KDD dataset.
datasets. For the NSL-KDD dataset, it was capable of
detecting with an accuracy of 0.818 and an F1-score
of 0.835. In the case of the CIC-IDS2017 dataset,
it achieved an accuracy of 0.924 and an F1-score of
0.931.
In addition, our study utilized the Hilbert curve
with order=5 to map network data into images. This
optimal order was determined through experiments by
varying the order with the example training set using
the proposed model. The result is shown in Figure
(a) Normal (b) DoS GoldenEye
Figure 7: Example image from CIC-IDS2017 dataset.
VISAPP 2024 - 19th International Conference on Computer Vision Theory and Applications
330

5. We hypothesized that a higher Hilbert curve order
would enhance model efficiency, resulting in a single
image encapsulating 1024 data points.
The experimental results of using the original net-
work data flow to evaluate the classical ML are shown
in table 2. We applied Classical ML such as logistic
regression (LR), and decision tree (DT) to compare
the single sample training on the network data flow.
In conclusion, the HilxSEED model might be one
of the standards for using visualization in intrusion
detection. It successfully addressed the key chal-
lenges in this field, the need for high accuracy, and the
ability to process complex data patterns effectively.
As cyber threats continued to evolve, approaches like
the HilxSEED model were vital in developing robust
and efficient systems to safeguard digital infrastruc-
tures.
5 CONCLUSION
In this study, we proposed the intrusion detection
method. The Hilbert curve serves as a flow-to-image
technique and utilizes an image classification model
to detect the network attack. We map the network
data flow following the coordinates of Hilbert’s curve.
Then, we train and evaluate the HilxSEED model,
an integration of the Encoder-Decoder model and the
SENet model comparing with previous methods on
NSL-KDD and CIC-IDS2017. The result of the pro-
posed HilxSEED model achieved higher performance
than recent models, with 0.817 accuracy and 0.835
F1-score on the NSL-KDD, and 0.924 accuracy and
0.931 F1-score on the CIC-IDS2017.
Our results were influenced by our experiment’s
specific conditions. The Hilbert curve order was lim-
ited by our hardware’s robustness, but future studies
could use higher orders. Notably, as we increased
the Hilbert curve’s order, we generally observed en-
hanced efficiency. A limitation was the difficulty
in visually detecting some attack types, though our
method might indicate these patterns. Furthermore,
exploring other filling curves could further enhance
intrusion detection methodologies.
ACKNOWLEDGEMENTS
This research is partially funded by the FY2023 Grant
for fundamental research, Japan Advanced Institute of
Science and Technology.
REFERENCES
Anderson, J. P. (1980). Computer security threat monitoring
and surveillance. Technical report, James P. Anderson
Company, Fort Washington, Pennsylvania.
Belavagi, M. C. and Muniyal, B. (2016). Performance
evaluation of supervised machine learning algorithms
for intrusion detection. Procedia Computer Science,
89:117–123.
Belej, O., Karpinski, M., Shaikhanova, A., Veselska, O.,
and Azatov, A. (2020). Development of intrusion
monitoring system in wireless sensor networks based
on neural networks. In 2020 IEEE 5th International
Symposium on Smart and Wireless Systems within the
Conferences on Intelligent Data Acquisition and Ad-
vanced Computing Systems (IDAACS-SWS), pages 1–
6.
Denning, D. E. (1987). An intrusion-detection model.
IEEE Transactions on Software Engineering, SE-
13(2):222–232.
Dosovitskiy, A., Beyer, L., Kolesnikov, A., Weissenborn,
D., Zhai, X., Unterthiner, T., Dehghani, M., Minderer,
M., Heigold, G., Gelly, S., Uszkoreit, J., and Houlsby,
N. (2020). An image is worth 16x16 words: Trans-
formers for image recognition at scale.
Feng, C., Wu, S., and Liu, N. (2017). A user-centric ma-
chine learning framework for cyber security opera-
tions center. In 2017 IEEE International Conference
on Intelligence and Security Informatics (ISI), pages
173–175.
Hilbert, D. (1891).
¨
Uber die stetige abbildung einer linie auf
ein fl
¨
achenst
¨
uck. Mathematische Annalen, 38:459–
460.
Ho, C. M. K., Yow, K.-C., Zhu, Z., and Aravamuthan,
S. (2022). Network intrusion detection via flow-to-
image conversion and vision transformer classifica-
tion. IEEE Access, 10:97780–97793.
Hu, J., Shen, L., Albanie, S., Sun, G., and Wu, E. (2020).
Squeeze-and-excitation networks. IEEE Transac-
tions on Pattern Analysis and Machine Intelligence,
42(8):2011–2023.
Khan, R. U., Zhang, X., Alazab, M., and Kumar, R. (2019).
An improved convolutional neural network model for
intrusion detection in networks. In 2019 Cybersecu-
rity and Cyberforensics Conference (CCC), pages 74–
77.
Kim, J., Kim, J., Kim, H., Shim, M., and Choi, E. (2020).
Cnn-based network intrusion detection against denial-
of-service attacks. Electronics, 9(6).
Kim, J., Kim, J., Thi Thu, H. L., and Kim, H. (2016). Long
short term memory recurrent neural network classifier
for intrusion detection. In 2016 International Confer-
ence on Platform Technology and Service (PlatCon),
pages 1–5.
Liu, H. and Lang, B. (2019). Machine learning and deep
learning methods for intrusion detection systems: A
survey. Applied Sciences, 9(20).
Muhuri, P. S., Chatterjee, P., Yuan, X., Roy, K., and Ester-
line, A. (2020). Using a long short-term memory re-
Cybersecurity Intrusion Detection with Image Classification Model Using Hilbert Curve
331

current neural network (lstm-rnn) to classify network
attacks. Information, 11(5).
Saranya, T., Sridevi, S., Deisy, C., Chung, T. D., and Khan,
M. (2020). Performance analysis of machine learning
algorithms in intrusion detection system: A review.
Procedia Computer Science, 171:1251–1260. Third
International Conference on Computing and Network
Communications (CoCoNet’19).
Sharafaldin, I., Lashkari, A. H., and Ghorbani, A. A.
(2018). Toward generating a new intrusion detection
dataset and intrusion traffic characterization. In Inter-
national Conference on Information Systems Security
and Privacy.
Sherstinsky, A. (2020). Fundamentals of recurrent
neural network (rnn) and long short-term memory
(lstm) network. Physica D: Nonlinear Phenomena,
404:132306.
Stolfo, S., Fan, W., Lee, W., Prodromidis, A., and Chan, P.
(1999). KDD Cup 1999 Data. UCI Machine Learning
Repository.
Sun, Y., Esaki, H., and Ochiai, H. (2019). Detection
and classification of network events in lan using cnn.
In 2019 4th International Conference on Information
Technology (InCIT), pages 203–207.
Tan, M. and Le, Q. (2019). EfficientNet: Rethinking model
scaling for convolutional neural networks. In Chaud-
huri, K. and Salakhutdinov, R., editors, Proceedings of
the 36th International Conference on Machine Learn-
ing, volume 97 of Proceedings of Machine Learning
Research, pages 6105–6114. PMLR.
Tavallaee, M., Bagheri, E., Lu, W., and Ghorbani, A. A.
(2009). A detailed analysis of the kdd cup 99 data set.
In 2009 IEEE Symposium on Computational Intelli-
gence for Security and Defense Applications, pages
1–6.
Vinayakumar, R., Soman, K. P., and Poornachandran, P.
(2017). Applying convolutional neural network for
network intrusion detection. In 2017 International
Conference on Advances in Computing, Communica-
tions and Informatics (ICACCI), pages 1222–1228.
Vu, D.-L., Nguyen, T.-K., Nguyen, T. V., Nguyen, T. N.,
Massacci, F., and Phung, P. H. (2020). Hit4mal: Hy-
brid image transformation for malware classification.
Transactions on Emerging Telecommunications Tech-
nologies, 31(11):e3789. e3789 ett.3789.
Zhang, S., Gong, Y., Wang, J., and Zheng, N. (2016). A
biologically inspired deep cnn model. In Chen, E.,
Gong, Y., and Tie, Y., editors, Advances in Multimedia
Information Processing - PCM 2016, pages 540–549,
Cham. Springer International Publishing.
APPENDIX
The table 2 shows the result of the classical ML model
which is single network data flow sample training.
This evaluation is the comparison with the proposed
method in table 1.
Table 1: Result of Proposed method on both datasets.
Dataset and Model Metrics
Dataset Data type Model Acc. F1 Pre. Rec.
NSL-KDD
Traditional Method LSTM-RNN (Sherstinsky, 2020) 0.711 0.344 0.541 0.253
Image Method
Hilbert + EfficientNetB0 0.807 0.810 0.922 0.722
Hilbert + ViT 0.431 0.000 0.000 0.000
HilxSEED 0.818 0.835 0.865 0.807
CIC-IDS2017
Traditional Method LSTM-RNN (Sherstinsky, 2020) 0.807 0.804 0.957 0.692
Image Method
Hilbert + EfficientNetB0 0.655 0.753 0.615 0.971
Hilbert + ViT 0.760 0.299 0.541 0.206
HilxSEED 0.924 0.931 0.923 0.938
Table 2: Result of Classical Machine Learning and Sequential model on both datasets.
Dataset and Model Metrics
Dataset Model Acc. F1 Pre. Rec.
NSL-KDD
Logistic Regression (LR) 0.755 0.744 0.918 0.625
Decision Tree (DT) 0.789 0.789 0.914 0.695
Random Forest (RF) 0.785 0.773 0.968 0.643
Gradient Boost (GB) 0.778 0.775 0.920 0.669
Support Vector Classifier (SVC) 0.760 0.750 0.919 0.633
CIC-IDS2017
Logistic Regression (LR) 0.694 0.632 0.900 0.486
Decision Tree (DT) 0.517 0.201 0.929 0.112
Random Forest (RF) 0.618 0.452 0.998 0.292
Gradient Boost (GB) 0.469 0.041 0.800 0.021
Support Vector Classifier (SVC) 0.652 0.547 0.920 0.389
VISAPP 2024 - 19th International Conference on Computer Vision Theory and Applications
332
