
Impact of Using GAN Generated Synthetic Data for the Classification of
Chemical Foam in Low Data Availability Environments
Toon Stuyck
1
and Eric Demeester
2
1
BASF Antwerpen, BASF, Antwerpen, Belgium
2
Department of Mechanical Engineering, ACRO Research Group, KU Leuven, Diepenbeek, Belgium
Keywords:
Synthetic Data, Augmented Data, Generative Adversarial Network, Chemical Foam, Classification,
Explainable AI.
Abstract:
One of the main challenges of using machine learning in the chemical sector is a lack of qualitative labeled
data. Data of certain events can be extremely rare, or very costly to generate, e.g. an anomaly during a pro-
duction process. Even if data is available it often requires highly educated observers to correctly annotate
the data. The performance of supervised classification algorithms can be drastically reduced when confronted
with limited amounts of training data. Data augmentation is typically used in order to increase the amount
of available training data but the risk exists of overfitting or loss of information. In recent years Generative
Adversarial Networks have been able to generate realistically looking synthetic data, even on small amounts
of training data. In this paper the feasibility of utilizing Generative Adversarial Network generated synthetic
data to improve classification results will be demonstrated via a comparison with and without standard aug-
mentation methods such as scaling, rotation,... . In this paper a methodology is proposed on how to combine
original data and synthetic data to achieve the best classifier result and to quantitatively verify generalization
of the classifier using an explainable AI method. The proposed methodology compares favourably to using no
or standard augmentation methods in the case of classification of chemical foam.
1 INTRODUCTION
Augmenting available data is already widely used in
most deep learning approaches focusing on image
classification when presented with limited data. Scal-
ing, translation, rotation,... are some of many stan-
dard augmenting techniques to increase the amount
of training data artificially. However, this approach
has some pitfalls. It is known that these augmentation
techniques can lead for example, to overfitting or loss
of information (Maharana et al., 2022; Connor and
M., 2019). Extending the training dataset with syn-
thetic but realistic images can have a beneficial effect
compared to the traditional augmentation techniques.
Synthetic data can refer to manually created data
in for example 3D tools such as Blender or it can refer
to artificially generated data that is used to train ma-
chine learning models. In this paper the focus will
lie on artificially generated data. Methods that are
often used to generate new data are: variational au-
toencoders (VAEs) (Kingma and Welling, 2013) and
generative adversarial networks (GANs) (Goodfellow
et al., 2014). Synthetic data can be generated in a con-
trolled environment, allowing for the creation of data
points with specific characteristics and perfect ground
truth labels. This enables the use of synthetic data to
enhance the performance of classifiers under a wide
range of conditions and to ensure that they are ro-
bust and generalize well to new data. A risk of us-
ing methods to generate synthetic data is when only
limited amounts of data are available, is that not all
features in the dataset will be equally incorporated in
the trained model, and certain details may be left out
in the synthetic data (Karras et al., 2020). When using
this synthetic data to train a classifier this could lead
to models that do not generalize well. One way to val-
idate this, is by using explainable AI (XAI) (Ribeiro
et al., 2016). This can help identify the features the
classifier is based on and can help understand whether
the trained model and the dataset have a problem or
not.
This paper will compare the accuracy of a clas-
sifier trained on real data, real and augmented data
and real data supplemented with synthetic data. The
impact of the amount of available training data will
also be investigated. All developed classifier models
620
Stuyck, T. and Demeester, E.
Impact of Using GAN Generated Synthetic Data for the Classification of Chemical Foam in Low Data Availability Environments.
DOI: 10.5220/0012305300003654
Paper published under CC license (CC BY-NC-ND 4.0)
In Proceedings of the 13th International Conference on Pattern Recognition Applications and Methods (ICPRAM 2024), pages 620-627
ISBN: 978-989-758-684-2; ISSN: 2184-4313
Proceedings Copyright © 2024 by SCITEPRESS – Science and Technology Publications, Lda.

will be validated on the same validation dataset and
generalization will be checked using explainable AI
methods. By combining these steps, a methodology
has been obtained that has been applied on a chemi-
cal foam dataset.
The dataset used for training and validation con-
tains images of foam in a chemical production con-
text. In the chemical production sector, the usage of
cameras to monitor installations is starting to become
integrated in the standard way of working. In most
cases, these camera feeds are still monitored manu-
ally since often AI solutions do not yet exist or are
not of high enough quality to be used in a live pro-
duction process. The main reason few solutions for
the chemical sector currently exist is due to the fact
that relevant data are only available to a limited extent
and collecting additional data is often expensive. Due
to this reason, the ability to use data augmentation or
synthetic data to increase the accuracy and robustness
of machine learning models to automate detection of
certain events with limited training data and how to
interpret these will be investigated.
The remainder of the paper is organized as fol-
lowed. Section 2 introduces related work. Section 3
describes the utilized method to generate new data, it
describes the different experiments that have been ex-
ecuted as well as give insights in the chemical foam-
ing dataset. Section 4 discusses the experimental re-
sults and performance of the different approaches as
well as limitations. Section 5 reports final conclu-
sions.
2 RELATED WORK
A short overview of related work will be presented
in this section. The topics reviewed are augmentation
techniques, synthetic data and explainable AI.
Augmentation techniques for image classification
are commonly used due to their cost-effectiveness
and user friendliness to increase the amount of train-
ing data with factors of thousands using annotation-
preserving operations (Krizhevsky et al., 2012). Us-
age of augmentation techniques can increase model
performance for tasks, such as classification, by over-
coming the problem of inadequate or imbalanced
datasets by introducing different variations in the in-
put data, which can lead to improved generalization
performance. (Kang et al., 2019), for example, com-
bine the lightweight architecture of tiny-YOLOv3
with data augmentation to achieve a better fire de-
tection model compared to other methods. (Agarwal
et al., 2020) use data augmentation to increase the
amount of data in an unbalanced dataset for classifi-
cation of tomato leaf diseases. (Taylor and Nitschke,
2018) benchmarked commonly used data augmenta-
tion schemes to allow researchers to make informed
decisions. However, one known shortcoming of data
augmentation is the risk of overfitting or loss of infor-
mation (Maharana et al., 2022; Connor and M., 2019).
These risks appear especially when the augmentation
transformations are too aggressive or inappropriate. It
could be that, the model, instead of recognizing fea-
tures of the original data, it starts to focus on the aug-
mented patterns. A possible way to overcome this is
by generating realistic looking synthetic data.
Synthetic data are artificially created data used to
train machine and deep learning models. Synthetic
data can be used as a valuable tool to generate real-
istic looking data. If the simulation-to-reality gap is
sufficiently small, the generated data has the potential
to be used during the training of classifiers. An often
used method to generate synthetic data is through the
usage of Generative Adversarial Networks (GANs)
(Goodfellow et al., 2014). GANs consist out of two
components. The first component is the generator.
The generator produces new examples based on the
distribution of the training data. The second compo-
nent is the discriminator. The goal of the discrim-
inator is to distinguish between generated examples
and real training data examples. The generator tries
to keep improving its generated examples in order to
fool the discriminator, while the discriminator tries to
correctly classify real and fake generated examples.
This adversarial process improves both the generator
as the discriminator. GANs have already been used in
many fields. (Stuyck et al., 2022) use a GAN archi-
tecture to segment clouds using generated aerial im-
ages. (Nazki et al., 2019) use cyle-GAN to generate
extra data to detect different plant diseases. (Bowles
et al., 2018) use GANs to generate synthetic data for
brain segmentation tasks. A possible risk of using
synthetic data is that if a limited training dataset is
available, not all features will be incorporated in the
generated synthetic data, and classifier results may be
biased towards specific classes (Karras et al., 2020).
Explainable AI can be used to make sure the classifier
model generalizes well by identifying and visualizing
the features that the classifier is based on.
Explainable AI has received increasing attention
in recent years. For applications in the chemical envi-
ronment, but also other industrial or medical environ-
ments explainability and transparency of AI methods
is of extreme importance for end users in correctly un-
derstanding the decision making process. An applica-
tion in the medical world where explainable AI has
been used, is in the classification of prostate cancer.
(Hassan et al., 2022) compare multiple pre-trained
Impact of Using GAN Generated Synthetic Data for the Classification of Chemical Foam in Low Data Availability Environments
621
networks for this classification task and use XAI to
understand the key features that led the algorithm to
make the respective decision and classification. A
similar approach has been followed by (Mankodiya
et al., 2022), who use XAI models to explain different
segmentation models for autonomous vehicles. (Xu
et al., 2019) give an overview of the history and cur-
rent state-of-the-art approaches. (Schorr et al., 2021)
use an explanation model named SHAP (Lundberg
and Lee, 2017) to explain the categorization of land-
use types on aerial images. The explanation model
SHAP will also be utilised in the remainder of this
work.
3 METHOD
In this work we will answer the following questions:
1. What is the impact of the amount of available real
data on the accuracy of a classification algorithm
on the chemical foam dataset?
2. Does enlarging the dataset using augmentation
techniques or GAN generated synthetic data make
a difference in the accuracy of a classification al-
gorithm?
3. What is the impact of the amount of synthetic
data?
4. Do the results of the classifier generalize well
when synthetic data is used in combination with
real data and how can we get insights in this gen-
eralization?
5. Can the decision regarding generalization of the
model on the chemical foam dataset be auto-
mated?
In order to answer these questions for our specific
dataset, 326 images of a production installation with
foam and 424 images of the same production instal-
lation without foam were collected over the span of
multiple weeks. These images are weakly labeled,
meaning that these images were only labeled as either
containing foam or labeled as not containing foam.
For training, 200 images with foam and 298 images
without foam were used. For validation and test-
ing the remaining 126 images with and without foam
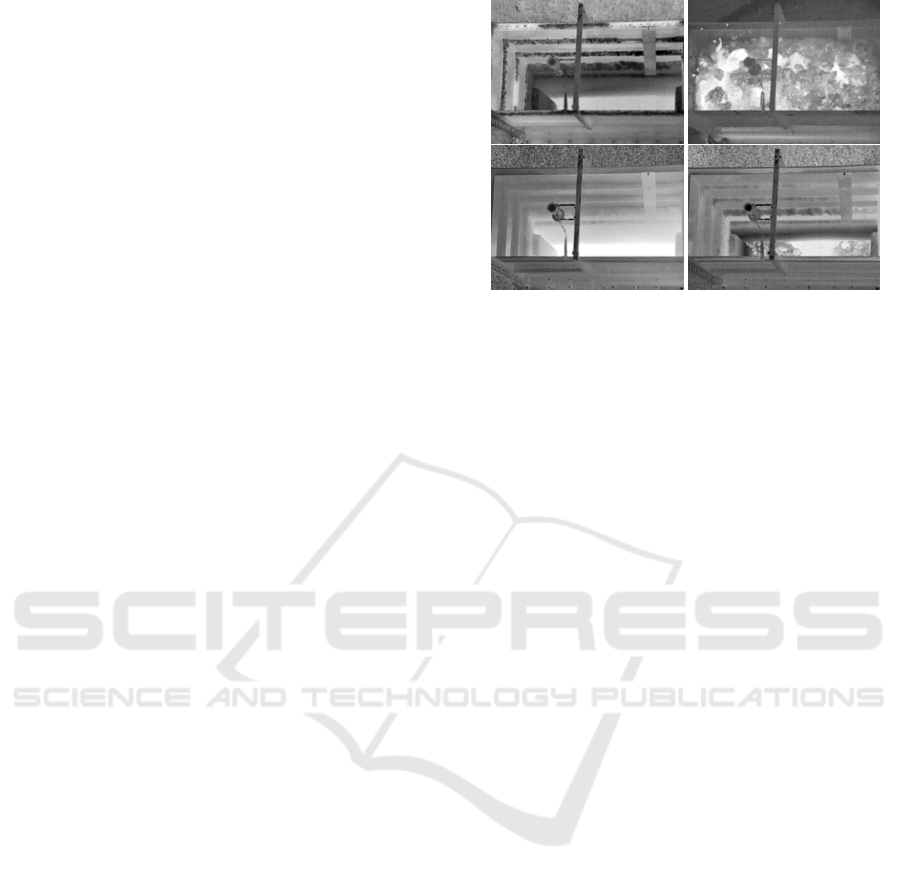
were used. Figure 1 shows real images of the outdoor
scene with foam and without foam. The observed
foam can take any possible shape and volume. The
images are taken from a production plant where foam
can be formed at any moment. The amount of foam
is unpredictable so it can be a very limited amount
or it could be enough to overflow the buffer tank. It is
(a) No foam (b) Foam
Figure 1: Example images of the scene depicting the two
possibles classes of normal (no foam) and foam. The
amount of foam can vary from very limited to almost over-
flowing. For the normal case, the images vary only lim-
ited since the camera is static and no changing environment
is visible besides possible weather phenomena and residual
foam.
important that this foam can be identified before over-
flowing the buffer tank since the impact of overflow-
ing can be very high due to the impact on safety of op-
erators, a possible impact on the environment as well
as the risk of early corrosion of nearby installations.
The two right images on figure 1 show both possi-
bilities. In the case no foam is present, there is only
a limited amount of variation in the image since the
camera and environment are static. The only changes
come from weather phenomena such as day/night cy-
cle and rain, mist, snow, ... and possible residue foam
that remains on the buffer tank as is shown on the top
left image on figure 1.
To be able to answer the above questions the
amount of available data for training will be decreased
artificially. For training 200 images with foam and
298 without foam are used. This is regarded as the
complete dataset. The reduced datasets gradually de-
crease from the complete dataset to 25% of the orig-
inal complete dataset in steps of 25% and finally to
only 10% of the original complete dataset. This is
done by randomly sampling the reduced amount of
data from the complete dataset.
A classifier will be trained for all the created
datasets. The results of the different classifiers will
be used to get insights regarding the first question.
Besides training classifiers on these newly created
datasets, additional data will be generated using stan-
dard augmentation techniques and synthetic gener-
ated data from a GAN based on the different reduced
datasets. Since there are only a limited amount of im-
ages available for training, a light-weight GAN struc-
ture proposed by (Liu et al., 2020) is used. The
ICPRAM 2024 - 13th International Conference on Pattern Recognition Applications and Methods
622

benefit of this light-weight GAN structure is that the
model converges from scratch within hours, and has
consistent performance even when used with limited
amount of training samples as is the case for our ap-
plication. This paper will not look into the impact
of changing the GAN architecture since (Lucic et al.,
2018) suggests that different GAN architectures have
limited impact, on average, on the final result. Addi-
tional datasets will be created by combining the dif-
ferent reduced datasets with the respective augmented
and synthetic generated data. For each new dataset
the amount of data will be increased with 50% and
100% of the reduced dataset with either augmented or
synthetic data. For these datasets a similar classifier
as before will be trained to provide insights and an-
swers to question 2 and 3. Table 1 gives an overview
of the 25 different datasets that have been created by
changing the amount of available and synthetic data
as well as changing the augmentation type. In order
to answer question 4, all the different classifiers will
be subject to the explanation model SHAP in order to
identify which features are responsible for the classi-
fication. This can give an idea on the generalization of
the different classifiers and what the impact might be
from decreasing the amount of real data, and increas-
ing the amount of synthetic data as well as the dif-
ference between generation methods for the synthetic
data. Finally, to provide an answer for question 5,
specific subject matter expert knowledge will be used
to define a region of interest (ROI) inside the buffer
tank. This ROI is typically used by human observers
to classify the different images. Using this extra use
case specific knowledge, it can be checked quantita-
tively how many of the responsible features for the
classification decision are located inside the ROI and
thus, if the model decision is based on similar features
as a human observer would use.
4 EXPERIMENTAL RESULTS
In the following subsections the results of the differ-
ent experiments that are conducted will be elaborated.
4.1 GAN Generated Synthetic Data
From table 1 it is clear that five different GAN mod-
els have to be trained for all the experiments con-
ducted where the amount of training data is varied.
The experiments are performed using a PC with an
Intel i7-10850h at 2.7 GHz and an NVIDIA Quadro
RTX 4000 GPU. All the models had a training time of
24 hours. Figure 2 gives some examples of different
generated synthetic data using the light-weight GAN
approach for the different models where the amount
of available data for training was varied. Figure 2 (a)
shows generated images when there is a situation with
little and heavy foam, for these images 100% of the
complete dataset was used. When generating addi-
tional synthetic data based on this model, it is possi-
ble to generate multiple images with much variation
in the amount of foam.
Figures 2 (b) - (d) show generated synthetic im-
ages when only 75% till 25% of the original complete
dataset is available. These images show that even with
reduced amounts of available training data it is still
possible to train the light-weight GAN that is able to
generate synthetic data with limited amount of vari-
ation in the amounts of foam. It can be noticed that
as the amount of data is reduced, the amount of noise
increases in the generated image. As can be expected,
when the amount of available data is extremely low, as
is the case in figure 2 (e) where only 10% of the orig-
inal data if available, the amount of variation present
in the generated synthetic data drops. Besides limited
amount of variation, the amount of noise also drasti-
cally increases.
From a qualitative point of view, it could be
judged that the models with lower amounts of avail-
able data generate lower quality images, and for a hu-
man it would be very easy to determine which one is
real and which one is synthetically generated. This
leads to an additional question: Does the quality of
the synthetically generated data matter for the accu-
racy of the classification? The next subsection will
give insights regarding the question of what the ef-
fect is of enlarging the dataset with augmented data
or generated synthetic images.
(a) 100% (b) 75% (c) 50% (d) 25% (e) 10%
Figure 2: Example images of GAN generated synthetic data
for different percentages of available data from the com-
plete dataset. Even with limited amounts of training data
the model is still able to generate synthetic data with varia-
tion.
4.2 Classifier Results
For the classification the most simple convolutional
neural network (CNN) is used since the focus of this
work is to identify the impact of changes in the train-
ing dataset. As is clear from table 1, a different clas-
Impact of Using GAN Generated Synthetic Data for the Classification of Chemical Foam in Low Data Availability Environments
623

Table 1: Table showing overview of all 25 datasets that have been created for the different experiments.
Amount of available data Amount of extended data Augmentation technique
100%-75%-50%-25%-10% 0% None
100%-75%-50%-25%-10% 100% Light-weight GAN
100%-75%-50%-25%-10% 50% Light-weight GAN
100%-75%-50%-25%-10% 100% Standard augmentation
100%-75%-50%-25%-10% 50% Standard augmentation
sification model needs to be trained for each varia-
tion in the amount of data and possible augmentation
technique, giving a total of 25 trained classifiers. The
accuracy of these models are given in table 2 and fig-
ure 3. From this table and figure it can be seen that
when no augmentation is applied, the accuracy of the
classifier drops when the amount of data starts to de-
crease, which is to be expected according to (Dawson
et al., 2023). This is also an answer to the first ques-
tion from section 3. A maximum accuracy of 87%
is achieved when 100% of the total training data is
available. A human observer is able to achieve an
accuracy of 100% on this dataset. However when
the amount of available data is heavily decreased, the
classifier has bad performance. When looking at stan-
dard augmentation techniques for our dataset it can be
observed that when only limited amounts of the orig-
inal dataset is available, standard augmentation has a
positive but limited impact on the accuracy by an in-
crease of around 5%. When all or almost all of the
original data is available, standard augmentation does
not seem to improve the results by much, but it also
does not seem to have a negative impact on the re-
sults of the classifier. It seems that standard augmen-
tation techniques have the most impact when datasets
are limited. When abundant data is available the im-
pact of these augmentation techniques begins to stag-
nate, as can be expected. Finally when looking at the
classifier results when using GAN generated synthetic
data, it immediately becomes clear that this augmen-
tation method provides the best results no matter the
amount of available original data. It can be observed
that the maximum accuracy can be pushed from 87%
to 94% when all of the original dataset can be used as
well as being extended by 100% with synthetic gen-
erated data. When only 50% of the original dataset is
available, synthetic generated data based on this lim-
ited dataset can be used to push the accuracy from
52% towards 91%. Even when only 10% of the orig-
inal dataset is available, extending this dataset with
synthetic generated data from the limited dataset can
increase the performance of the classifier from only
43% up to 73%. These findings seem to indicate that
if it is possible to generate synthetic data the results
will be superior compared to the classic augmentation
techniques.
4.3 Explainable AI Using SHAP
Even though the results of the previous subsection
are validated on 126 images of foam and 126 images
without foam, it is still unclear how well these mod-
els generalize to additional images since the foam can
take any size and shape. In order to increase trust
in the trained models, an explanation model named
SHAP (Lundberg and Lee, 2017) has been utilised on
the different trained models to explain the categoriza-
tion of the images. Each pixel receives a value indict-
ing in what sense it contributed towards the classifica-
tion. Figure 4 gives two examples of the classification
model where 100% of the original data was available
and it was extended with synthetic generated data. A
red color indicates pixels that contribute to the classi-
fication of foam. Blue indicates pixels that contribute
to the classification of no foam. From these examples
it can be seen that the model correctly indicates the
zones of interest for the foam to be in the center of the
buffer tank. In case no foam is present in the images,
the model correctly understands that information can
be found on the inside of the buffer tank as well as
in the center of the tank. The additional informa-
tion gained from the SHAP values indicates that the
model uses similar information as a human observer
would use in order to classify the images. This infor-
mation can strengthen the trust in the model. Similar
results are achieved for the models where 75% and
50% of the original data was available for the train-
ing of the GAN and the classifier. However as was
mentioned in subsection 4.1, once the available train-
ing data starts to decrease, noise in the generated im-
ages starts to increase and variation starts to decrease.
Even though the accuracy of these models with low
data remain high (table 2), and the images in figure
5 are correctly labeled, the SHAP values indicate that
this model does not generalize well since the decision
for foam or no foam seems to be distributed randomly
(figure 5 (a)) or lies mostly outside the region where
foam normally occurs (figure 5 (b)).
The paragraph above describe visual interpreta-
tion of the findings, however in order to qualitatively
describe the generalization of the models, contextual
information regarding the specific dataset has been
used. A region of interest is defined based on sub-
ICPRAM 2024 - 13th International Conference on Pattern Recognition Applications and Methods
624
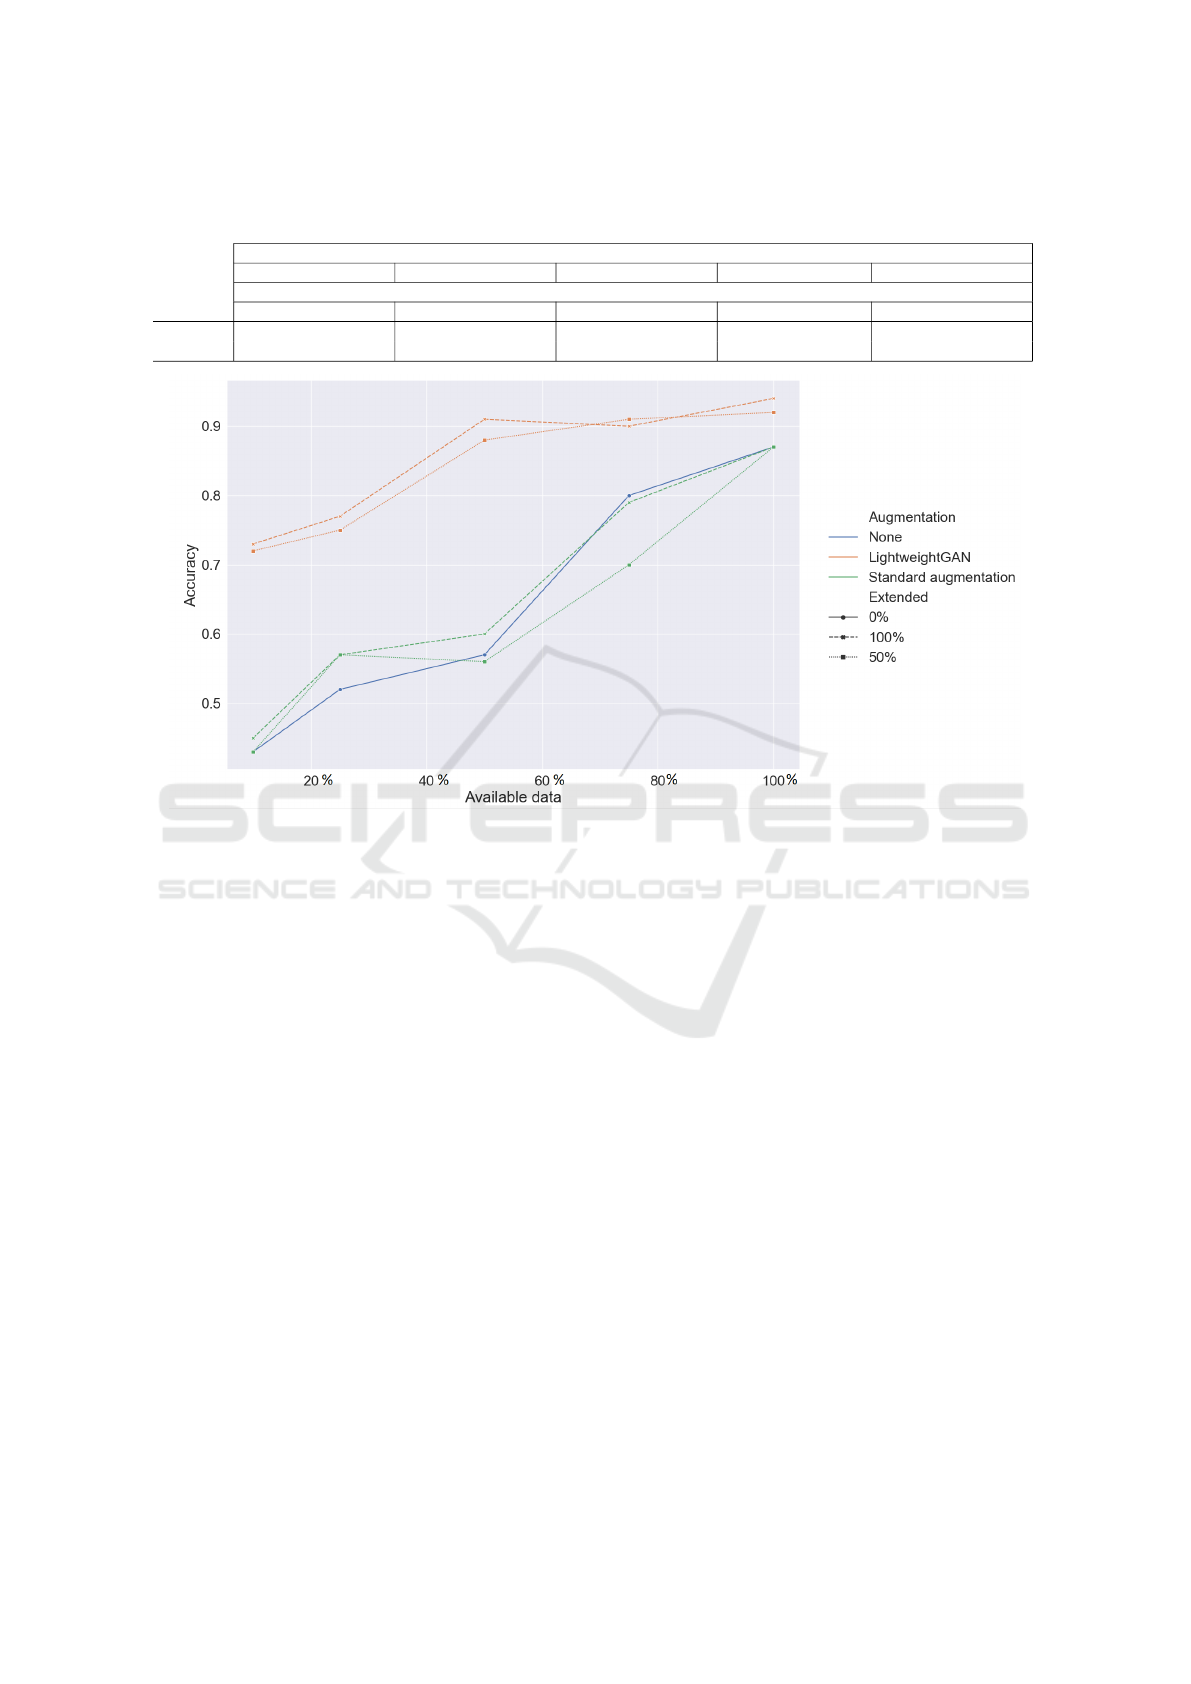
Table 2: Table showing an overview of the accuracy of all 25 models for the different amount of used training data when using
no (0%), standard or GAN augmentation (50%-100%).
Amount of available data from complete dataset
10% 25% 50% 75% 100%
Amount of extended data
0% 50% 100% 0% 50% 100% 0% 50% 100% 0% 50% 100% 0% 50% 100%
Standard 0.43 0.43 0.45 0.52 0.57 0.57 0.57 0.56 0.6 0.8 0.7 0.79 0.87 0.87 0.87
GAN 0.43 0.72 0.73 0.52 0.75 0.77 0.57 0.88 0.91 0.8 0.91 0.9 0.87 0.92 0.94
Figure 3: Overview of the results of the accuracy of all 25 models for the different amount of used training data when using no
(0%), standard or GAN augmentation (50%-100%). It can be seen that GAN augmentation gives the best results. Extending
datasets with synthetic data based on limited percentages of the original dataset is able to push the accuracy from 87% to 94%.
ject matter expert knowledge. This region of interest
is normally used by human observers to form their
classification decision and can be seen on figure 6.
For each SHAP value, that contributes towards a cer-
tain decision, it can be checked whether or not this
value is located inside the ROI. Using this heuris-
tic a performance indicator can be calculated. This
has been done for each validation image and for each
trained model. For each model these results are av-
eraged in order to receive one performance indica-
tor value. These results are summarized in table 3.
These results clearly confirm the previous visual find-
ings. When the simulation-to-realism gap is small,
it can be observed that the ratio of SHAP values ly-
ing inside the region of interest versus outside is in
the range between 75% and 86%. However when the
gap between the simulation-to-realism is larger, this
ratio drastically drops and depending on the avail-
able data ranges between 40% and 53%. This indi-
cates that for these models only at best around half
of the explaining pixels are located their where a sub-
ject matter expert would expect them to be and are
thus not reliable to use. Using the proposed perfor-
mance indicator can help automate this procedure and
no longer makes it based on subjective visual obser-
vations. These results indicate that using GAN gener-
ated synthetic data on our dataset is only useful when
the simulation-to-realism gap is small. Incorporation
of the SHAP values and the performance indicator
in the workflow provides the end-user with extra in-
formation and insights in the actual performance of
the developed models by comparing information used
by the model and the information a human observer
would use for classifying the images. Besides these
extra insights, it also gives an indication on the im-
portance of the quality of the generated data since it
can be observed that when the quality of generated
data drops, the distribution of SHAP values indicate
that the classifier is mostly based on noise.
5 CONCLUSION
In this paper, the effect of utilizing GAN derived syn-
thetic data for increasing accuracy of a classifier has
been investigated and has been compared to a stan-
Impact of Using GAN Generated Synthetic Data for the Classification of Chemical Foam in Low Data Availability Environments
625
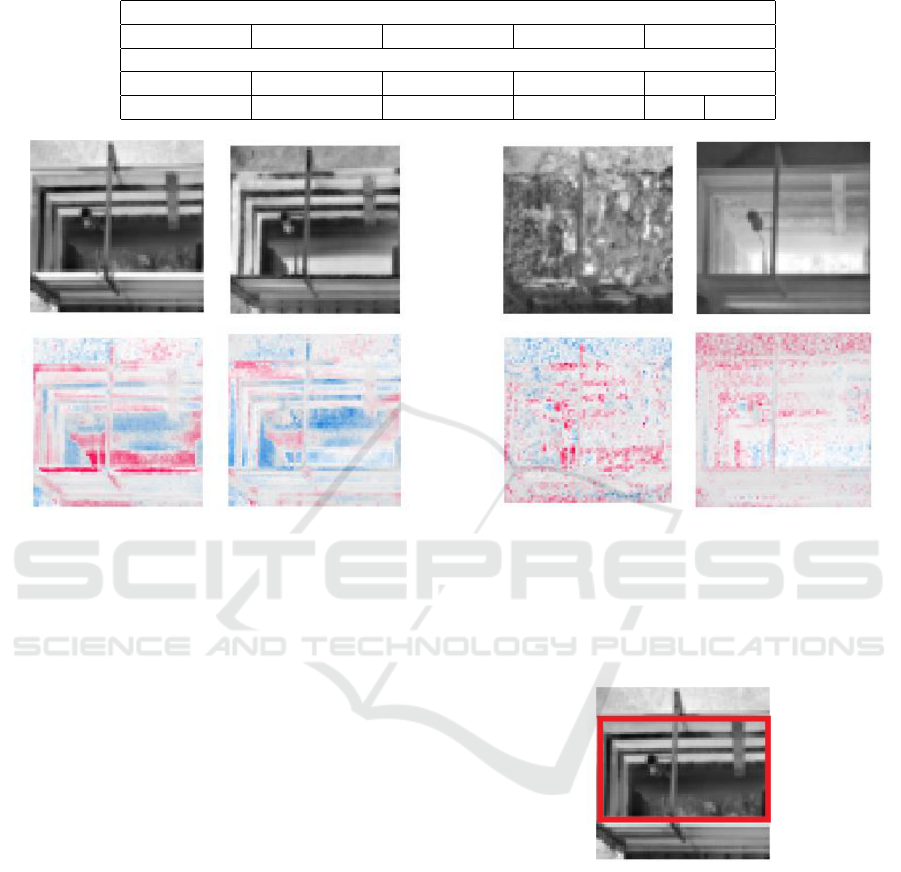
Table 3: Table showing overview of the ratio of shap values that explain classification that lie inside the defined region of
interest versus outside for the different amounts of available training data and combination of extended data.
Amount of available data from complete dataset
10% 25% 50% 75% 100%
Amount of extended data
50% 100% 50% 100% 50% 100% 50% 100% 50% 100%
0.43 0.4 0.48 0.53 0.75 0.78 0.81 0.79 0.84 0.86
(a) Foam (b) No foam
Figure 4: Example images of SHAP values for (a) an im-
age with foam, and (b) an image where no foam is present
where the model generalizes well. Red pixels indicate a
contribution towards the foam class. Blue pixels indicate a
contribution towards the no foam class.
dard augmentation method. The GAN based syn-
thetic generated data is proven to yield superior re-
sults compared to the utilised standard augmentation
techniques on the dataset used in this paper. The pro-
posed methodology employs a generative adversarial
network for generation of synthetic data. This extra
step for generating extra data before the classification,
is low effort and involves only the training of a GAN
such as, e.g. the light-weight GAN used in this paper.
This work suggest that in order to decide how much
data is enough data to create classification models that
generalize well, explanation models should be intro-
duced that can help with the interpretation of the clas-
sification results. In this paper it was shown that when
only 50% of the original data (100 training images) is
available, it is possible to increase the final accuracy
of the classifier from 57% to 91% by adding GAN
based synthetic data in our dataset while still gener-
alizing well. In comparison, standard augmentation
methods were only able to increase the accuracy to
60%.
In the future, we would like to validate the proposed
method on other datasets as well to see if the ap-
(a) (b)
Figure 5: Example images of SHAP values for (a) an image
with foam, and (b) an image where no foam is present where
the model does not generalize well. Red pixels indicate a
contribution towards the foam class. Blue pixels indicate a
contribution towards the no foam class.
Figure 6: Example image showing the buffer tank with
foam inside. The content of the red box indicate the re-
gion of interest which human observers use to determine if
foam is present or not in the image.
proach generalizes to other applications. In addition,
we would like to investigate different methods to gen-
erate synthetic data and evaluate their impact. Finally,
we want to expand our method to quantify the results
of the explanation model to work on datasets where
region of interests cannot be defined as simply as was
the case in the dataset used in this paper.
ICPRAM 2024 - 13th International Conference on Pattern Recognition Applications and Methods
626

ACKNOWLEDGEMENTS
We would like to thank VLAIO and BASF Antwerpen
for funding the project (HBC.2020.2876).
REFERENCES
Agarwal, M., Singh, A., Arjaria, S., Sinha, A., and Gupta,
S. (2020). ToLeD: Tomato leaf disease detection us-
ing convolution neural network. Procedia Computer
Science, 167:293–301. International Conference on
Computational Intelligence and Data Science.
Bowles, C., Chen, L., Guerrero, R., Bentley, P., Gunn, R.,
Hammers, A., Dickie, D. A., Hern
´
andez, M. V., Ward-
law, J., and Rueckert, D. (2018). GAN augmentation:
Augmenting training data using generative adversarial
networks. arXiv preprint arXiv:1810.10863.
Connor, S. and M., K. T. (2019). A survey on image data
augmentation for deep learning. Journal of Big Data,
6(1):60.
Dawson, H. L., Dubrule, O., and John, C. M. (2023). Impact
of dataset size and convolutional neural network archi-
tecture on transfer learning for carbonate rock classi-
fication. Computers & Geosciences, 171:105284.
Goodfellow, I., Pouget-Abadie, J., Mirza, M., Xu, B.,
Warde-Farley, D., Ozair, S., Courville, A., and Ben-
gio, Y. (2014). Generative adversarial nets. In Ghahra-
mani, Z., Welling, M., Cortes, C., Lawrence, N., and
Weinberger, K., editors, Advances in Neural Infor-
mation Processing Systems, volume 27. Curran Asso-
ciates, Inc.
Hassan, M. R., Islam, M. F., Uddin, M. Z., Ghoshal, G.,
Hassan, M. M., Huda, S., and Fortino, G. (2022).
Prostate cancer classification from ultrasound and
MRI images using deep learning based explainable ar-
tificial intelligence. Future Generation Computer Sys-
tems, 127:462–472.
Kang, L.-W., Wang, I.-S., Chou, K.-L., Chen, S.-Y., and
Chang, C.-Y. (2019). Image-based real-time fire de-
tection using deep learning with data augmentation for
vision-based surveillance applications. In 2019 16th
IEEE International Conference on Advanced Video
and Signal Based Surveillance (AVSS), pages 1–4.
Karras, T., Aittala, M., Hellsten, J., Laine, S., Lehtinen, J.,
and Aila, T. (2020). Training generative adversarial
networks with limited data. In Larochelle, H., Ran-
zato, M., Hadsell, R., Balcan, M., and Lin, H., editors,
Advances in Neural Information Processing Systems,
volume 33, pages 12104–12114. Curran Associates,
Inc.
Kingma, D. P. and Welling, M. (2013). Auto-encoding vari-
ational bayes. arXiv preprint arXiv:1312.6114.
Krizhevsky, A., Sutskever, I., and Hinton, G. E. (2012). Im-
agenet classification with deep convolutional neural
networks. Advances in neural information processing
systems, 25.
Liu, B., Zhu, Y., Song, K., and Elgammal, A. (2020). To-
wards faster and stabilized GAN training for high-
fidelity few-shot image synthesis. In International
Conference on Learning Representations.
Lucic, M., Kurach, K., Michalski, M., Gelly, S., and Bous-
quet, O. (2018). Are GANs created equal? a large-
scale study. Advances in neural information process-
ing systems, 31.
Lundberg, S. M. and Lee, S.-I. (2017). A unified approach
to interpreting model predictions. Advances in neural
information processing systems, 30.
Maharana, K., Mondal, S., and Nemade, B. (2022). A
review: Data pre-processing and data augmentation
techniques. Global Transitions Proceedings, 3(1):91–
99.
Mankodiya, H., Jadav, D., Gupta, R., Tanwar, S., Hong, W.-
C., and Sharma, R. (2022). OD-XAI: Explainable AI-
based semantic object detection for autonomous vehi-
cles. Applied Sciences, 12.
Nazki, H., Lee, J., Yoon, S., and Park, D. S. (2019). Image-
to-image translation with GAN for synthetic data aug-
mentation in plant disease datasets. Smart Media
Journal, 8(2):46–57.
Ribeiro, M. T., Singh, S., and Guestrin, C. (2016). ” why
should i trust you?” explaining the predictions of any
classifier. In Proceedings of the 22nd ACM SIGKDD
international conference on knowledge discovery and
data mining, pages 1135–1144.
Schorr, C., Goodarzi, P., Chen, F., and Dahmen, T. (2021).
Neuroscope: An explainable AI toolbox for seman-
tic segmentation and image classification of convolu-
tional neural nets. Applied Sciences, 11(5):2199.
Stuyck, T., Rousseau, A.-J., Vallerio, M., and Demeester, E.
(2022). Semi-supervised cloud detection with weakly
labeled RGB aerial images using generative adversar-
ial networks. In ICPRAM, pages 630–635.
Taylor, L. and Nitschke, G. (2018). Improving deep
learning with generic data augmentation. In 2018
IEEE symposium series on computational intelligence
(SSCI), pages 1542–1547. IEEE.
Xu, F., Uszkoreit, H., Du, Y., Fan, W., Zhao, D., and Zhu, J.
(2019). Explainable AI: A brief survey on history, re-
search areas, approaches and challenges. In Natural
Language Processing and Chinese Computing: 8th
CCF International Conference, NLPCC 2019, Dun-
huang, China, October 9–14, 2019, Proceedings, Part
II 8, pages 563–574. Springer.
Impact of Using GAN Generated Synthetic Data for the Classification of Chemical Foam in Low Data Availability Environments
627
