
Design and Implementation of a Software System for Surveillance of
Antibiotics Concentrations in Wastewater
Yousuf Al-Hakim
1
, Kosmas Dragos
1a
, Kay Smarsly
1b
, Silvio Beier
2
and Claudia Klümper
3
1
Institute of Digital and Autonomous Construction, Hamburg University of Technology, Germany
2
Chair of Urban Bioengineering for Resource Recovery, Bauhaus University Weimar, Germany
3
Laboratory of Environmental Analysis, Department HAM 2, Hamm-Lippstadt University of Applied Sciences, Germany
Keywords: Antibiotics, Antibiotic Resistance, Monitoring, Software Design, Wastewater Surveillance.
Abstract: Antibiotics are important drugs for treating infectious diseases. The extensive use of antibiotics for human,
veterinary, and agricultural purposes has led to the permanent release of antibiotics into the environment,
particularly into municipal wastewater. In turn, the widespread release of antibiotics into the environment has
led to the emergence of antibiotic-resistant bacteria and antibiotic-resistant genes (collectively referred to as
“antibiotic resistance”), which reduce the effectivity of antibiotic treatment. To counteract antibiotic
resistance, surveillance of the release of antibiotics into the environment is necessary. Municipal wastewater
surveillance may provide insights into the release of antibiotics into the environment. Current municipal
wastewater surveillance systems, dedicated to antibiotics concentrations, rely on the ad-hoc use of third-party
software, which may compromise the efficiency and user-friendliness of municipal wastewater surveillance
systems. Designing software systems dedicated to the surveillance of antibiotics concentrations in municipal
wastewater, based on well-established software design concepts, has received scarce research attention. In
this study, a software system is proposed, which serves as a technological basis for the surveillance of the
concentration of antibiotics in municipal wastewater in an efficient and user-friendly manner. The software
system implements well-established software design concepts and is capable of conducting on-demand data
analysis, as well as providing various user interfaces. The software system is validated using both data derived
from simulations and real-world wastewater data recorded from a wastewater treatment plant. The results
showcase the efficiency and user-friendliness of the proposed software system for the surveillance of
antibiotics concentrations in municipal wastewater.
1 INTRODUCTION
Antibiotics are used for treating infectious diseases in
human and veterinary medicine as well as for
agricultural purposes (Davies, 2010). Since the
introduction of the antimicrobial agent sulfonamide
in the 1930s, usage of antibiotics has increased
(Adler, 2018), leading to permanent release of
antibiotics into the environment (Rizzo, 2013).
Through feces of animals that have received
antibiotics treatment, as well as through wastewater
treatment plants, antibiotics are released into fields,
soils, and local waters. The release of antibiotics into
the environment poses risks to human and
environmental health (Paulus, 2019). One of the most
a
https://orcid.org/0000-0002-4204-6547
b
https://orcid.org/0000-0001-7228-3503
significant health risks is the emergence of antibiotic-
resistant bacteria (ARB) and antibiotic-resistant
genes (ARG), collectively referred to as “antibiotic
resistance” (Nguyen, 2021). Antibiotic resistance
(AR) limits the effectiveness of antibiotics for
treating infectious diseases (CDC, 2021). National
and international institutions have realized the risk of
the emergence of AR and have introduced measures
for reducing the impact of AR on the health of
humans, animals, and the environment (Aminov,
2010; Manzetti, 2014). However, since neither the
EU nor other international and national institutions
have set standards for the maximum allowable
concentration of antibiotics in municipal wastewater
(WHO, 2020), surveillance of antibiotics
Al-Hakim, Y., Dragos, K., Smarsly, K., Beier, S. and Klümper, C.
Design and Implementation of a Software System for Surveillance of Antibiotics Concentrations in Wastewater.
DOI: 10.5220/0012304500003657
Paper published under CC license (CC BY-NC-ND 4.0)
In Proceedings of the 17th International Joint Conference on Biomedical Engineering Systems and Technologies (BIOSTEC 2024) - Volume 2, pages 285-292
ISBN: 978-989-758-688-0; ISSN: 2184-4305
Proceedings Copyright © 2024 by SCITEPRESS – Science and Technology Publications, Lda.
285

concentrations in the environment is rarely
conducted. Gaining insights into the release of
antibiotics into the environment could stand to benefit
from existing approaches on the surveillance of
municipal wastewater at wastewater treatment plants,
the most important literature on which is reviewed in
the following paragraph, focusing on the underlying
software systems.
Seminal works discussing the software of
surveillance systems in general include, for example,
surveillance approaches for geospatial data (Mutuku,
2022) and approaches for livestock surveillance
(Mena, 2019). Generally, the literature shows the
case-specific manner in which software for
surveillance systems is designed, which is underlined
by software development without clear software
design concepts. Regarding the surveillance of
municipal wastewater, a surveillance system
proposed by Selisteanu et al. (2020) has been
designed using three third-party software
environments. Martinez et al. (2020) have used third-
party middleware for designing surveillance systems.
Finally, studies that have focused on the surveillance
of antibiotics concentrations in municipal wastewater
have been conducted by Mtetwa et al. (2021) with
wastewater samples from wastewater treatment
plants in South Africa, by Majlander et al. (2021) with
wastewater samples from two hospitals in Finland,
and by Huijbers et al. (2020), with wastewater
samples from municipal wastewater treatment plants
of several European countries. In summary, the
studies show that municipal wastewater surveillance
systems typically lack underlying software that is
designed specifically for the surveillance of
municipal wastewater. To improve efficiency and
user-friendliness, dedicated software systems based
on well-established design concepts are necessary.
This study proposes a software system for
efficient and user-friendly surveillance of antibiotics
concentrations in municipal wastewater. The
software system supports executing multiple tasks
simultaneously, such as data storage and
management, data analysis, and data visualization. In
data storage and management, the software system
stores wastewater data in a database, specifically
designed for the surveillance of antibiotics
concentrations. In data analysis, algorithms are
implemented to analyze wastewater data and identify
parameters that are critical to the surveillance of
antibiotics concentrations in municipal wastewater.
In data visualization, the parameters are visualized in
multiple views. The software system is validated with
data derived from simulations as well as from a real-
world municipal wastewater treatment plant
(WWTP). The software system increases the
efficiency and user-friendliness of the surveillance of
antibiotics concentrations in municipal wastewater by
organizing and bundling tasks into one software
system. With the software system, surveillance of
municipal wastewater may be used as a reliable tool
to limit the release of antibiotics concentration. The
remainder of this paper is structured as follows: The
design of the software system is discussed in the next
section, followed by the implementation. Then, the
software system is validated and, finally, conclusions
are drawn, and an outlook on future research is given.
2 DESIGN OF THE SOFTWARE
SYSTEM
In this section, the design of the software system is
discussed. Upon defining the requirements, the
software design is presented, showing how the
requirements are met. For designing the software
system for the surveillance of antibiotics
concentrations in municipal wastewater, functional
and non-functional software requirements are
defined.
Functional requirements are directed to project-
related properties and ensure high quality and
feasibility of the software system (Glinz, 2007). The
main functional requirements for the software system
are:
The software system must allow accessibility
through web browsers and smartphone
applications;
The visualization of the wastewater data must
be adaptable to the requirements of every user;
The software system must consider data
analysis functionalities with the option to
switch between algorithms;
The concepts of the software system must be
valid generally, meaning that the software
system can be used in different environments.
The main non-functional software requirements
for the software system are correctness, robustness,
extensibility, and reusability. For further information
on non-functional software requirements, interested
readers are referred to the IEEE Standard Glossary of
Software Engineering Terminology (IEEE, 1990).
The software system for the surveillance of
antibiotics concentrations in municipal wastewater is
presented in Figure 1. The rectangles represent main
components of the software system. The squares
resemble ports (P1-P3), to which interfaces are
connected. The ports allow extensions to the software
HEALTHINF 2024 - 17th International Conference on Health Informatics
286
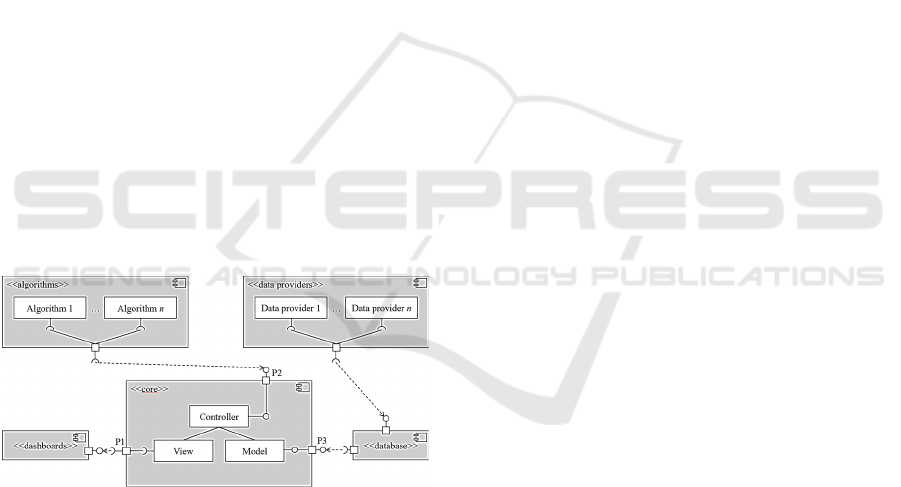
system, which enable users to access the software
system through web browsers and smartphone
applications. The full circles resemble interfaces
provided by a component, and the half circles
resemble interfaces required for a component. For the
software design, the model-view-controller (MVC)
software design concept is pursued because MVC
separates the core of the software system into three
components (Smarsly et al., 2023): The model
component, the view component, and the controller
component. Separating the software system reduces
the complexity, since different functionalities are
separated accordingly. The aspect of separation is an
advantage of MVC over other software design
concepts, such as the microkernel software design
concept or the event-driven software design concept.
In the <<Core>> component, which resembles the
software architecture of the software system, the port
P1 enables the view component to visualize
wastewater data with dashboards, charts, or
spreadsheets, according to the requirements of
respective users. The port P2 enables switching
between algorithms, with which wastewater data is
processed and analyzed. The port P3 offers interfaces
to connect databases to the model component of the
software system, allowing analysis and visualization
of wastewater data from multiple sources. To ensure
general validity of the database of the software
system, switching between different databases as a
whole is enabled by P3, as well.
Figure 1: Software system for the surveillance of antibiotics
concentrations in municipal wastewater.
3 IMPLEMENTATION OF THE
SOFTWARE SYSTEM
This section describes the implementation of the
software system. The components of the software
system are listed, and the functionalities are explained
in detail.
3.1 Model Component
The database system of the software system resides in
a cloud, on which wastewater data can be stored and
shared with project partners. The cloud of the
software system is based on the client-server software
Nextcloud, with which clouds can individually be
scaled and used on various systems such as small
microcontrollers or large data centers. Additionally,
Nextcloud offers a web-based application and a
smartphone application. Nextcloud enables the
assignment of different rights to different users. By
sharing individual access codes, or by including users
to access lists, the users may access the wastewater
data to the degree designated. The cloud is managed
by a data manager, which is responsible for the
following tasks:
Assigning rights to users;
Ensuring the wastewater data is always up to
date, old versions are deleted or backed up, and
only the newest version is passed to the model
component;
Unifying data file types, for example .csv or
.xls, and assuring that the providers of
wastewater data conform to the formats of the
predefined data file types.
Performing any non-automated task necessary
for the operation of the database system, such
as maintaining the database system structure,
identifying and correcting errors, or performing
updates of hardware and software.
3.2 Controller Component
Once the wastewater data has been collected, the
wastewater data is analyzed. The controller
component performs data analysis tasks, including
correcting the wastewater data and preparing the
wastewater data for forecasting. The controller
component is built using the Python programming
language. The Python programming language is used,
because the native libraries of the Python
programming language include a variety of different
algorithms (Bogdanchikov, 2013), which reduce the
need to install external libraries when analyzing the
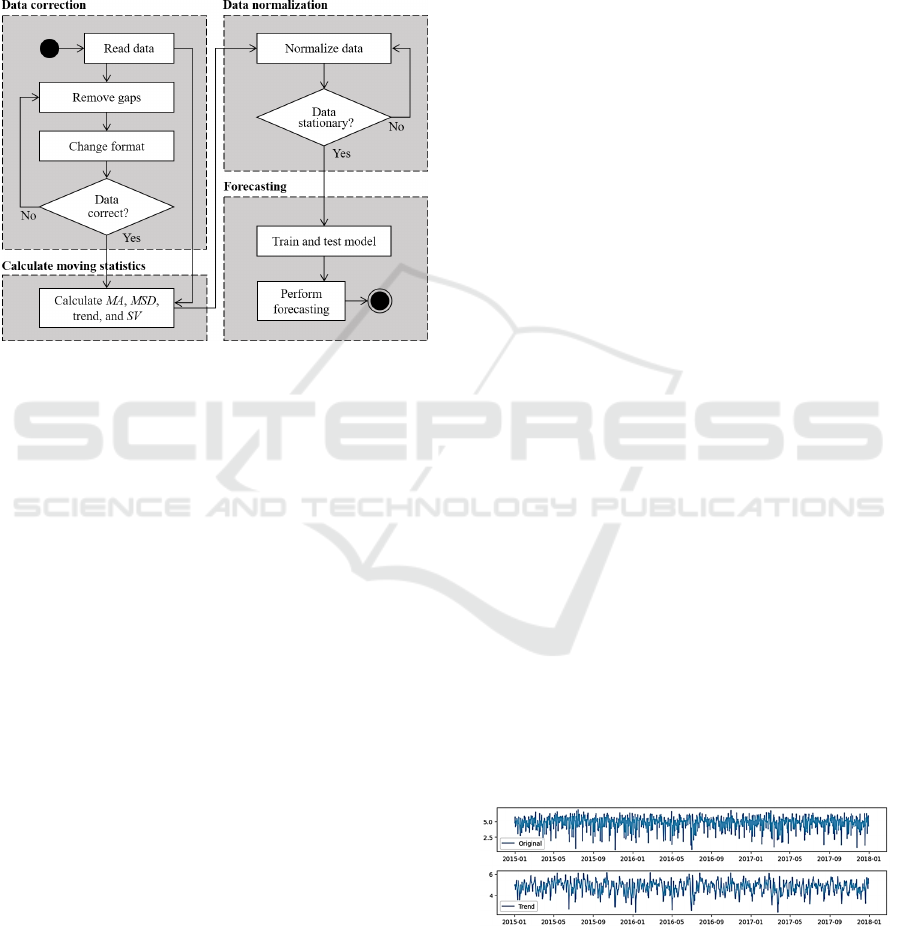
wastewater data. Wastewater data is analyzed in the
controller component in four steps, described in the
following sub sections. A flowchart, showcasing the
workflow of the data analysis, in the controller
component is shown in Figure 2.
Design and Implementation of a Software System for Surveillance of Antibiotics Concentrations in Wastewater
287

3.2.1 Data Correction
Raw wastewater data is often not ready for data
analysis immediately after the data is created. Several
factors can lead to gaps in the wastewater data, such
as:
Disturbances during municipal wastewater
sampling, or even loss of municipal wastewater
samples;
The human factor, such as illness of the worker
on the day in which collection of municipal
wastewater samples is scheduled;
Errors in devices for extracting the data
samples.
First, the controller component locates gaps in the
wastewater data. For analyzing wastewater data,
particularly when advanced data analysis methods are
applied to the wastewater data, gaps are detrimental.
The controller component applies linear interpolation
to fill the gaps.
3.2.2 Calculation of Moving Statistics
Once the wastewater data is corrected, moving
statistics are calculated, since moving statistics are
used for modelling, forecasting, and gaining insights
into the wastewater data. First, the controller
component calculates the moving average (MA) over
a range of antibiotics concentrations. Upon
computing the moving average, the controller
component calculates the moving standard deviation
(MSD)
()
1
1
,
n
i
i
M
SD y MA
n
=
=−
(1)
where y
i
is the wastewater data point. In addition
to the MA and the MSD, the controller calculates the
trend and the seasonality of the wastewater data.
The seasonality is determined by calculating the
seasonal variation (SV) of the wastewater data
.
i
SV y MA=−
(2)
Plotted over time, the seasonal variation shows
the recurring, short-term cycle of the wastewater data.
3.2.3 Data Normalization and Stationarity
Calculating the statistics MA and MSD, as well as the
trend and SV, provides insight into the wastewater
data. With the MA, the wastewater data can be
examined for stationarity. Stationarity is defined as
follows (NIST, 2023):
A stationary process has the property that the
mean, variance and autocorrelation structure do not
change over time.
Stationarity is particularly important for modeling
and for forecasting the wastewater data. If the
wastewater data is non-stationary, the wastewater
data is normalized to achieve a constant MA. The
controller component checks the following
normalizations for stationarity:
The logarithmic normalization:
() ()
log ;
f
xx=
(3)
The square-root normalization:
()
;
f
xx=
(4)
The cube-root normalization:
()
3
.
f
xx=
(5)
The Augmented Dickey-Fuller Test (ADF)
(Paparoditis, 2013) is performed to select the
appropriate normalization with respect to stationarity.
The normalized dataset is used for modeling and
forecasting of the wastewater data. To increase
efficiency of the software system, the controller
component automatically finds the appropriate
normalization with respect to stationarity.
3.2.4 Forecasting
To estimate the future behavior of the wastewater
data, the controller component performs forecasting.
A model of the wastewater data is built in the
controller component using linear regression, which
is an efficient way to model time series data (Myers,
1990). The Python library XGBoost (XGB) is used for
forecasting. XGB is a decision-tree machine learning
library, used for regression, classification, and
ranking problems (He, 2016). To train the regression
model, the wastewater data is split into three parts.
The first two parts are used by the controller
component for training the regression model. The last
part is used to test the regression model. The metric,
with which the controller component trains the
regression model is the root mean squared error
(RMSE):
()
2
1
1
ˆ
n
ii
i
RMSE y y
n
=
=−
(6)
HEALTHINF 2024 - 17th International Conference on Health Informatics
288
where y
i
are the actual measurements and ŷ
i
are
the corresponding predictions of the wastewater data.
The regression model runs multiple training iterations
to reduce the RMSE as much as possible. For
efficiency, training of the model stops automatically
as soon as the RMSE reaches the lowest value, with a
minimum of 10 training iterations, as an empirical
value.
Figure 2: Flowchart of the data analysis conducted by the
controller component.
3.3 View Component
Once the data analysis has been completed, the
controller component passes the wastewater data to
the view component of the software system, where
the wastewater data is visualized. To visualize the
wastewater data, the software system uses the Python
library Matplotlib. Matplotlib is a library for creating
static, animated, and interactive visualizations with
Python, without the need to install third-party
software. The wastewater data is visualized using
interactive figures that are updated automatically and
that can be formatted individually. In addition to the
visualization techniques provided by Matplotlib, the
Python programming language provides interfaces
that allow several third-party software packages to be
used for visualizing the wastewater data, such as the
Python extension Streamlit, which allows visualizing
wastewater data with dashboards containing
interactive figures and graphics.
3.4 Validation Tests
This section discusses the tests, which have been
devised to validate the software system. The
validation tests consist of a test using data derived
from simulations, as will be explained in the next
paragraph, and a test using real-world municipal
wastewater data.
For validating the software system with data
derived from simulations, a wastewater data set is
simulated using the Monte Carlo Simulation (MCS).
The MCS is used to simulate different outcomes of a
process that cannot be predicted due to the
intervention of random values. The MCS is
conducted in four steps, on which details may be
found in Harrison (2009). The real-world wastewater
data has been measured at the Neugut WWTP in
Dübendorf, Switzerland. The Neugut WWTP treats
wastewater from 150,000 people, with an industrial
contribution of approximately 50%. The flow of the
Neugut WWTP averages 19,000 m³/day at dry
weather conditions (Enz, 1992).
The database system is located on the Nextcloud
server of Hamburg University of Technology. To
validate the functionality of the database system,
some users are assigned the right to download and
reshare the folder, in which the wastewater data is
stored, while other users are assigned the right to edit
the wastewater data and create new files of the
wastewater data. Users of the database have received
a personalized invitation link, with which access to
the database is granted. After reading the wastewater
data, the model component passes the wastewater
data to the controller component, where the
wastewater data is corrected. No gaps are present in
the data derived from simulations, which is why the
controller component skips the data correction step in
the first validation test.
Next, the controller component performs data
analysis on the wastewater data. The MA and the
MSD are calculated, as well as the trend m and the
seasonal variation SV. To calculate the trend and
seasonal variation, the controller component uses the
Python library Statsmodels, which contains statistical
functions for data analysis. The original wastewater
data and the trend are depicted in Figure 3. For the
visualization of the trend, visualization techniques
provided by the internal Python library Matplotlib are
used.
Figure 3: Line graphs for the original wastewater data,
derived from simulations, and the trend.
Since the MCS is used, random values are present
in the wastewater data. The random values of the data
Design and Implementation of a Software System for Surveillance of Antibiotics Concentrations in Wastewater
289

derived from simulations are apparent in the trend, as
the trend line is highly periodic. To achieve
stationarity, the controller component identifies the
appropriate normalization by applying the ADF. The
result of the ADF shows that the cube root
normalization is appropriate with respect to
stationarity.
Next, the controller component uses the data
derived from simulations for training and testing the
regression model. The wastewater data is split into
three parts, the first two being used for training. The
controller component stops the training phase after 18
training iterations, since the RMSE reaches the lowest
value. Finally, the controller component checks the
forecasting capabilities of the regression model, using
the third part of the data derived from simulations for
testing the model.
The software system then performs the data
analysis of the real-world wastewater data similarly
to the data derived from simulations. The controller
component normalizes the real-world wastewater
data with the logarithmic normalization. Next, the
controller component splits the normalized real-
world wastewater data into three parts. When training
the regression model with the real-world wastewater
data, the controller component stops after 39 training
iterations. The visualization and the analysis results
of the real-world wastewater data are conducted using
a dashboard, provided by the view component which
uses the Streamlit extension of Python. The
dashboard is shown in Figure 4.
The dashboard of the software system bundles
multiple visualization techniques in one interactive
screen. The wastewater data is visualized, alongside
the forecast conducted by the regression model. The
data analysis results, such as MA and MSD of
antibiotics concentrations, are depicted in the form of
line charts. The visualization techniques in the
dashboard can be changed interactively, according to
user preferences.
As a result, the validation tests with data derived
from simulations show the efficient und user-friendly
manner with which the database system is designed.
The cloud allows assigning different rights to
different users. Users are able to perform data
management (depending on the rights assigned) from
web-browsers or the Nextcloud smartphone
application. A particularly efficient feature of the
controller component is identifying the normalization
for modelling. The visualization of the real-world
wastewater data increases the user-friendliness of the
software system. In conclusion, the software system
significantly improves the efficiency and user-
friendliness of the surveillance of antibiotics in
municipal wastewater. The database allows user-
friendly data management through the folder
structure and rights assignment. The controller
component analyses data efficiently, without the need
of intervention between calculation steps. The view
component enables user-friendly visualization of
antibiotics concentrations in wastewater data and the
analysis results through a variety of visualization
techniques, including dashboards.
4 SUMMARY AND CONCLUSION
Antibiotic resistance poses serious health risks to
humans, animals, and the environment. High
concentrations of AR, particularly in municipal
wastewater, threaten the potential effectivity of
antibiotics in treating infectious diseases.
Surveillance of municipal wastewater is, therefore, a
vital step to reduce the release of antibiotics in the
environment. This study has proposed a software
system for efficient and user-friendly surveillance of
antibiotics concentrations in municipal wastewater.
The software system is based on the model-view-
controller software design concept. The MVC
concept separates the core of the software system into
three components. In the model component,
wastewater data is stored and managed, the controller
component is responsible for data analysis, and the
view component is designed for visualization. The
software system has been validated using data derived
from simulations as well as wastewater data obtained
from a real-world wastewater treatment plant.
The validation tests have demonstrated the high
efficiency and user-friendliness of the surveillance of
municipal wastewater using the proposed software
system. In particular, the MVC software design
concept has exhibited its positive attributes within
every component of the software system: (i) the
model component has allowed user-friendly data
management with an efficient folder structure, (ii) the
controller component has conducted the data analysis
in an efficient manner, including normalizations to
achieve stationary wastewater data, and (iii) the view
component has allowed a variety of data
visualizations, while enabling multiple project
partners at different locations to collaborate. The
study aspires to provide a tool that helps adhere to
standards and regulations regarding antibiotics
concentrations in municipal wastewater. Future work
may include coupling the software system with digital
models of wastewater treatment plants, building upon
previous studies reported in Söbke et al. (2018; 2021).
The software system focusses on connecting to
HEALTHINF 2024 - 17th International Conference on Health Informatics
290
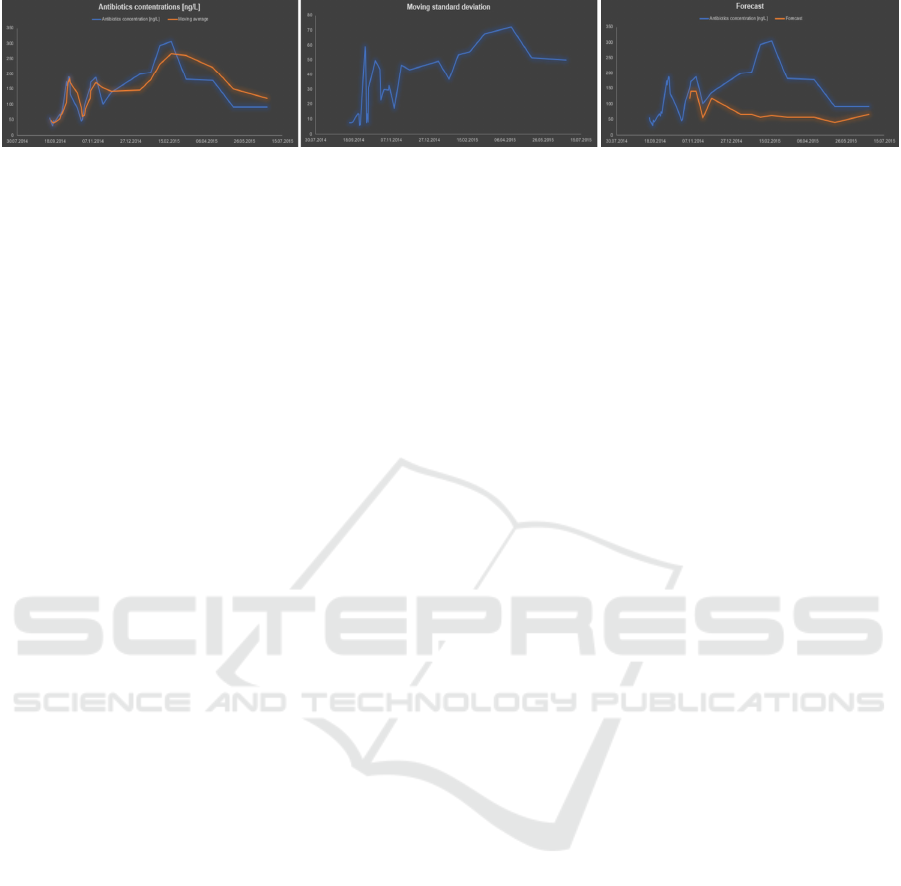
Figure 4: Dashboard created by the view component of the software system.
dashboards and similar visualization techniques.
Future work may focus on integrating the monitoring
data into 3D models, such as building information
models. Also, future work may focus on optimizing
the algorithms used for analyzing the wastewater
data, enabling the software system to predict
antibiotics concentrations in municipal wastewater
with high accuracy.
ACKNOWLEDGEMENTS
This collaborative research is partially funded by
Thüringer Aufbaubank (grant number 2021 FE
9143/44) through Bauhaus University Weimar,
Germany (grant number 2360200276-2/21), by the
Deutsche Bundesstiftung Umwelt (DBU) under grant
number 38351/01-25, by the German Research
Foundation (DFG) under grant SM 281/20-1, and by
the German Federal Ministry for Digital and
Transport (BMDV) within the mFUND program
under grant 19FS2059C. The authors would like to
sincerely thank the Swiss Federal Institute of Aquatic
Science and Technology (EAWAG) for openly
sharing data and accelerating scientific progress
through transparency. Any opinions, findings,
conclusions, or recommendations expressed in this
paper are those of the authors and do not necessarily
reflect the views of EAWAG or the sponsors.
REFERENCES
Adler, N., Balzer, F., Blondzik, K., Brauer, F., Chorus, I.,
et al. (2018). Antibiotics and Antibiotics Resistances in
the environment – Background, challenges and options
for action. German Environment Agency, Dessau-
Roßlau, Germany.
Aminov, R.I. (2010). A brief history of the antibiotic era:
Lessons learned and challenges for the future. Frontiers
in Microbiology. Vol. 1, ID: 134.
Bogdanchikov, A., Zhaparov, M., Suliyev, R. (2013).
Python to learn programming. In: Proc. of the
International Conference on Science & Engineering in
Mathematics, Chemistry and Physics. Jakarta,
Indonesia, 01/25/2013.
Centers for Disease Control and Prevention, CDC. (2021).
Actions to fight antimicrobial resistance. Available at:
https://www.cdc.gov/drugresistance/actions-to-
fight.html (Accessed on: 10/03/2023).
Davies, J., Davies, D. (2010). Origins and evolution of
antibiotic resistance. Microbiology and Molecular
Biology Reviews. Vol. 74, No. 3, p. 417–433.
Enz, D. (1992). Dübendorf, Kläranlage Neugut, Digital
Equipment. Available at: https://www.e-
pics.ethz.ch/index/ETHBIB.Bildarchiv/ETHBIB.Bilda
rchiv_26755.html (Accessed on: 10/03/2023).
Glinz, M. (2007). On non-functional requirements. In:
Proc. of the 15th IEEE International Requirements
Engineering Conference. Delhi, India, 10/15/2007.
Harrison, R.L. (2009). Introduction to Monte Carlo
Simulation. In: Proc. of the Nuclear Physics Methods
and Accelerators in Biology and Medicine: Fifth Int.
Summer School on Nuclear Physics Methods and
Accelerators in Biology and Medicine. Bratislava,
Slovakia, 07/06/2009.
He, T. (2016). XGBoost: Scalable and Flexible Gradient
Boosting. Available at: https://xgboost.ai/ (Accessed
on: 10/01/2023)
Huijbers, P., Larsson, J., Flach, C.-F. (2020). Surveillance
of antibiotic resistant Escherichia coli in human
populations through urban wastewater in ten European
countries. Environmental Pollution. Vol. 261, ID:
114200.
Majlander, J., Anttila, V-J., Nurmi, W., Seppäla, A., Tiedje,
J., Muziasari, W. (2021), Routine wastewater-based
monitoring of antibiotic resistance in two Finnish
hospitals: Focus on carbapenem resistance genes and
genes associated with bacteria causing hospital-
acquired infections. Journal of Hospital Infection. Vol.
117, p. 157–164.
Manzetti, S., Ghisi, R. (2014). The environmental release
and fate of antibiotics. Marine Pollution Bulletin. Vol.
79, No. 1–2, p. 7–15.
Martínez, R., Vela, N., El Aatik, A., Murray, E., Roche, P.,
Navarro, J.M. (2020). On the use of an IoT integrated
system for water quality monitoring and management
in wastewater treatment plants. Water. Vol. 12, No. 4,
ID: 1096.
Mena, M., Corall, A., Iribarne, L., Criado, J. (2019). A
progressive web application based on microservices
combining geospatial data and the IoT. IEEE Access.
Vol. 7, p. 104577-104590.
Mtetwa, H.N., Amoah, I.D., Kumari, S., Bux, F., Reddy, P.
(2021). Wastewater-based surveillance of antibiotic
resistance genes associated with tuberculosis treatment
Design and Implementation of a Software System for Surveillance of Antibiotics Concentrations in Wastewater
291

regimen in KwaZulu Natal, South Africa. Antibiotics.
Vol. 10, No. 11, ID: 1362.
Mutuku, C., Gazdag, Z., Melegh, S. (2022). Occurrence of
antibiotics and bacterial resistance genes in wastewater:
Resistance mechanisms and antimicrobial resistance
control approaches. World Journal of Microbiology and
Biotechnology. Vol. 38, No. 9, ID: 152.
Myers, R.H. (1990). Classical and modern regression with
applications. Duxbury/Thompson Learning, Pacific
Grove, CA, USA.
National Institute of Standards and Technology (NIST)
(2023). Stationarity. In: “NIST/SEMATECH e-
Handbook of Statistical Methods”. Available at:
https://www.itl.nist.gov/div898/handbook/pmc/section
4/pmc442.htm (Accessed on 07/19/2023).
Nguyen, A.Q., Vu, H. P., Nguyen, L.N., Wang, Q.,
Djordjevic, S.P., Donner, E., Yin, H., Nghiem, L.D.
(2021). Monitoring antibiotic resistance genes in
wastewater treatment: Current strategies and future
challenges. Science of The Total Environment. Vol.
783, ID: 146964.
Paparoditis, E., Politis, D.N. (2013). The asymptotic size
and power of the augmented Dickey-Fuller test for a
unit root. Econometric Reviews. Vol. 37, No. 9, p. 955-
973.
Paulus, G.K., Hornstra, L.M., Alygizakis, N., Slobodnik, J.,
Thomaidis, N., Medema, G. (2019). The impact of on-
site hospital wastewater treatment on the downstream
communal wastewater system in terms of antibiotics
and antibiotic resistance genes. In: International
Journal of Hygiene and Environmental Health. Vol.
222, No. 4, p. 635–644.
Rizzo, L., Manaia, C., Merlin, C., Schwartz, T., Dagot, C.,
Ploy, M.C., Michael, I., Fatta-Kassinos, D. (2013).
Urban wastewater treatment plants as hotspots for
antibiotic resistant bacteria and genes spread into the
environment: A review. Science of The Total
Environment. Vol. 447, p. 345–360.
Selișteanu, D., Petre, E., Prejbeanu, R., Popescu, I.M.,
Mehedințeanu, S. (2020). Software solutions for
simulation, monitoring and data acquisition in
wastewater treatment plants. In: Proc. of the 21th
International Carpathian Control Conference (ICCC).
High Tatras, Slovakia, 10/27/2020.
Smarsly, K., Al-Hakim, Y., Peralta, P., Beier, S., Klümper,
C. (2023). A systematic review and recommendation of
software architectures for SARS-CoV-2 monitoring. In:
Proc. of the 16th International Conference on Health
Informatics. Lisbon, Portugal, 02/18/2023.
Söbke, H., Peralta, P., Smarsly, K., Armbruster, M. (2021).
An IFC schema extension for BIM-based description of
wastewater treatment plants. Automation in
Construction. Vol. 129, ID: 103777.
Söbke, H., Theiler, M., Tauscher, E., Smarsly, K. (2018).
BIM-based description of wastewater treatment plants.
In: Proc. of the 16th International Conference on
Computing in Civil and Building Engineering
(ICCCBE). Tampere, Finland, 06/05/2018.
The Institute of Electrical and Electronics Engineering
(1990). IEEE Standard Glossary of Software
Engineering Terminology. IEEE, New York, NY, USA.
World Health Organization (2020). Antibiotic resistance.
Available at: https://www.who.int/news-room/fact-
sheets/detail/antibiotic-resistance. (Accessed on:
03/10/2023).
HEALTHINF 2024 - 17th International Conference on Health Informatics
292
