
Enhanced Multimodal Timely Prediction of Pulmonary Fibrosis
Progression with Uncertainty Estimation from Chest CT Images and
Clinical Metadata
Mohamed Dahmane
a
Computer Research Institute of Montreal (CRIM),
405 Av. Ogilvy #101, Montreal, Quebec, Canada
Keywords:
CT Scans, Uncertainty Estimation, Pulmonary Fibrosis, Multimodal Deep Learning, Clinical Metadata.
Abstract:
Pulmonary Fibrosis (PF) is a progressive chronic illness in which the lung tissues become increasingly scarred
and damaged, leading to irreversible loss of their capacity to oxygenate vital organs. The specific causes of
the illness are often unknown in many cases. Assessment of the severity of the lung disease is critical for
physicians to diagnose PF early, control disease decline, and manage damage progression. The Forced Vital
Capacity (FVC) of the lungs measured by a spirometer, is a good indicator of the severity of the condition of
the lungs. In this work, we investigated an approach for early diagnosis of PF and showcased a multimodal
architecture that predicts the FVC of patients at different stages of the disease. We propose an anti-Elu interme-
diate block and an anti-Relu confidence block to predict the pulmonary fibrosis progression. The uncertainty
estimation block proved effective in predicting the FVC using data from initial spirometry measurements, clin-
ical meta-data and CT images. Evaluation of the model on the OSIC pulmonary fibrosis progression dataset
showed improved performance compared to state-of-the-art methods, with an average modified Laplace log-
likelihood score of -6.8227 on a private test set.
1 INTRODUCTION
Pulmonary Fibrosis (PF) is often characterized by dif-
ficulty breathing, which can progressively worsen un-
til the lungs are no longer able to supply vital organs
with sufficient oxygen. In some cases, this damage
can lead to serious health conditions such as Progres-
sive Fibrosis Interstitial Lung Disease (PID) or Idio-
pathic Pulmonary Fibrosis (IPF). Timely and accurate
diagnosis of the stage of pulmonary fibrosis is essen-
tial in reducing the burden of morbidity and mortality
related to lung diseases. Chest imaging, such as X-ray
and high-resolution computed tomography (HRCT),
is one means of diagnosing PF, as well as other tests
and procedures used by radiologists. However, accu-
rately diagnosing PF, particularly predicting the stage
of a progressive disease like PID, can be challenging.
Radiological imaging provides a dedicated tool for vi-
sually assessing the presence of fibrotic tissue and de-
termining the development of lung scarring.
Several research works propose imaging diagno-
sis approaches to aid radiologists in diagnosing lung
a
https://orcid.org/0000-0002-2670-1433
diseases. Various consortiums worldwide, such as the
Open Source Imaging Consortium (OSIC), Radiolog-
ical Society of North America (RSNA), and Society
of Thoracic Radiology (STR), bring together clinical
researchers and data scientists to improve radiology-
based imaging through deep learning and artificial
intelligence. These organizations collect extensive
datasets of high-resolution CT images and relevant
metadata to develop advanced multimodal solutions.
In the literature, many research works have pro-
posed using CT scans as a unimodal source of in-
formation to assess the evolution of Idiopathic Pul-
monary Fibrosis. However, few studies have explored
predicting the disease progression from multimodal
data by predicting the Forced Vital Capacity (FVC),
which is an important indicator of pulmonary function
in IPF (du Bois et al., 2011). Moreover, in this work
we enhanced the the uncertainty estimation by intro-
ducing a new anti-Relu block. The paper is organized
as follows: Section 2 discusses the related works in
computer-assisted fibrotic lung disease assessment. In
section 3, we investigate the OSIC pulmonary fibro-
sis data used to evaluate our approach. Section 4 pro-
vides a detailed description of the methodology. Sec-
Dahmane, M.
Enhanced Multimodal Timely Prediction of Pulmonary Fibrosis Progression with Uncertainty Estimation from Chest CT Images and Clinical Metadata.
DOI: 10.5220/0012304100003660
Paper published under CC license (CC BY-NC-ND 4.0)
In Proceedings of the 19th International Joint Conference on Computer Vision, Imaging and Computer Graphics Theory and Applications (VISIGRAPP 2024) - Volume 4: VISAPP, pages
461-468
ISBN: 978-989-758-679-8; ISSN: 2184-4321
Proceedings Copyright © 2024 by SCITEPRESS – Science and Technology Publications, Lda.
461

tion 5, presents the evaluation and the performance of
the proposed approach. Finally, section 6 gives con-
clusions and some insights on potential direction and
future works.
2 RELATED WORK
In recent years, there has been an increasing trend
in the prevalence of idiopathic pulmonary fibrosis
(IPF) in the USA (Nalysnyk et al., 2012). In a study
by (Raghu et al., 2014) on US Medicare patients aged
65 years and older, the authors found that patients
with a median age of 79.4±7.2 years had a survival
time of 3.8 years. The study also revealed an overall
incidence ratio of 93.7 cases per 100k persons. An-
other study by (Hutchinson et al., 2015) reported an
increase in mortality due to pulmonary fibrosis, rang-
ing from 4.64 per 100k for Spain to 8.28 for England
and Wales.
The integration of assitive vision and AI in health-
care has become essential due to the abundance of
clinical data. CT scans are particularly useful for
visually estimating the stage of lung deterioration.
A clinical association was found between interstitial
lung abnormalities (ILA) judged by high-resolution
computed tomography (HRCT) and idiopathic pul-
monary fibrosis (IPF), as reported in (Wells and
Kokosi, 2016; Scatarige et al., 2003).
Motivated by recent advances in deep learning and
computer vision, researchers have investigated vari-
ous architectures for interstitial lung disease (IDL) de-
tection, segmentation, and classification (Soffer et al.,
2022). For instance, in a study by Walsh et al. (Walsh
et al., 2018), deep learning was used to classify fi-
brotic lung diseases from high-resolution CT scans,
and the algorithm outperformed 60 out of 91 radiol-
ogists with a median accuracy of 73.3% compared to
the physicians’ accuracy of 70%. In another study,
Comelli et al. (Comelli et al., 2020) evaluated the
UNet and E-Net segmentation models on 10 patients
with idiopathic pulmonary fibrosis (IPF) and achieved
a segmentation accuracy of 96% using the dice simi-
larity coefficient without any radiologist intervention.
Kido et al. (Kido et al., 2022) developed a deep
neural-network architecture for three-dimensional
segmentation of lung nodules for lung cancer diag-
nosis from CT images. The 3D UNet model’s per-
formance was comparable to human experts with a
dice similarity coefficient of 84.5% and 82.2%, re-
spectively. The authors found that traditional machine
learning techniques such as watershed and graph-cut
provided lower accuracy compared to neural-network
based models, with only 62.8% and 56.6% dice sim-
ilarity coefficient, respectively. In another study
by (Christe et al., 2019), an integrated computer-aided
diagnosis system for IPF was developed using deep
learning on CT images. The system’s performance
was similar to that of radiologists under certain evalu-
ation criteria. The study conducted by (Zucker et al.,
2020) utilized a DCNN model based on ResNet-18
to predict Brasfield scores, which are indicative of
various lung function features such as air trapping,
linear markings, nodular cystic lesions, large lesions,
and overall severity. The authors reported minimal
differences between the model’s Brasfield scores and
those of the experts, except for the large lesion fea-
tures, which had an average Spearman correlation
of only 32% between the model and the radiolo-
gists. However, the correlation rate for large lesion
scores showed a higher rate of 80.2%. In (Agarwala
et al., 2020), a convolutional neural network was first
trained on natural images and then fine-tuned on CT
images to automatically segment interstitial lung dis-
ease (ILD) patterns such as emphysema, consolida-
tion, and fibrosis. The reported results were accept-
able, with a classification rate of 90% for fibrosis pat-
tern segmentation.
Several research studies based their works on the
OSIC data (Osic, 2023) to predict the decline in
lung function severity which is assessed by measur-
ing the forced vital capacity using a spirometer (Wat-
ters et al., 1986; Noth et al., 2021). The best perfor-
mance was obtained using a bimodal deep learning
model to process CT images and a neural net regres-
sor to process patient clinical metadata. The objec-
tive function was optimized using a multiple quantile
loss function. Efficient-Net was adopted as a back-
bone to process the images. In their study, (Wong
et al., 2021) developed Fibros-Net, an architecture
designed to predict fibrosis progression from chest
scans. The model used CT images, spirometry mea-
surements, and patient clinical metadata to estimate
forced vital capacity (FVC) over a specific time in-
terval from the OSIC data. The model achieved a
good Laplace log-likelihood score of -6.8188. In con-
trast, FVC-Net from (Yadav et al., 2022) represents
a different architecture that estimates FVC from de-
rived honeycombing features, CT scans, and meta-
data of the OSIC dataset. The model showed a higher
Laplace log-likelihood coefficient of -6.64. A study
by (Mandal et al., 2020) compared the performance
of machine learning models with CNN architecture
in predicting FVC from CT images and patient meta-
data. The experiments showcased good results using
an Elastic-Net regression method achieving a higher
likelihood score of -6.73 on the OSIC dataset.
VISAPP 2024 - 19th International Conference on Computer Vision Theory and Applications
462
3 OSIC PULMONARY FIBROSIS
PROGRESSION DATA
The data used in this study comprises CSV metadata
and CT scans from the OSIC-Pulmonary Fibrosis Pro-
gression dataset (Osic, 2023). The CSV file contains
metadata information such as age, sex, weeks, smok-
ing status, and FVC percent, which is defined as the
percentage of the typical FVC measure for a person
with similar characteristics. Each patient has a unique
ID, and a baseline chest CT scan is available corre-
sponding to the reference visiting week, i.e., week=0.
The FVC of the patient is measured as a function of
the week number during the follow-up visits, which
span approximately 1 to 2 years. Pre/post visits re-
lating to the reference week are referred to by nega-
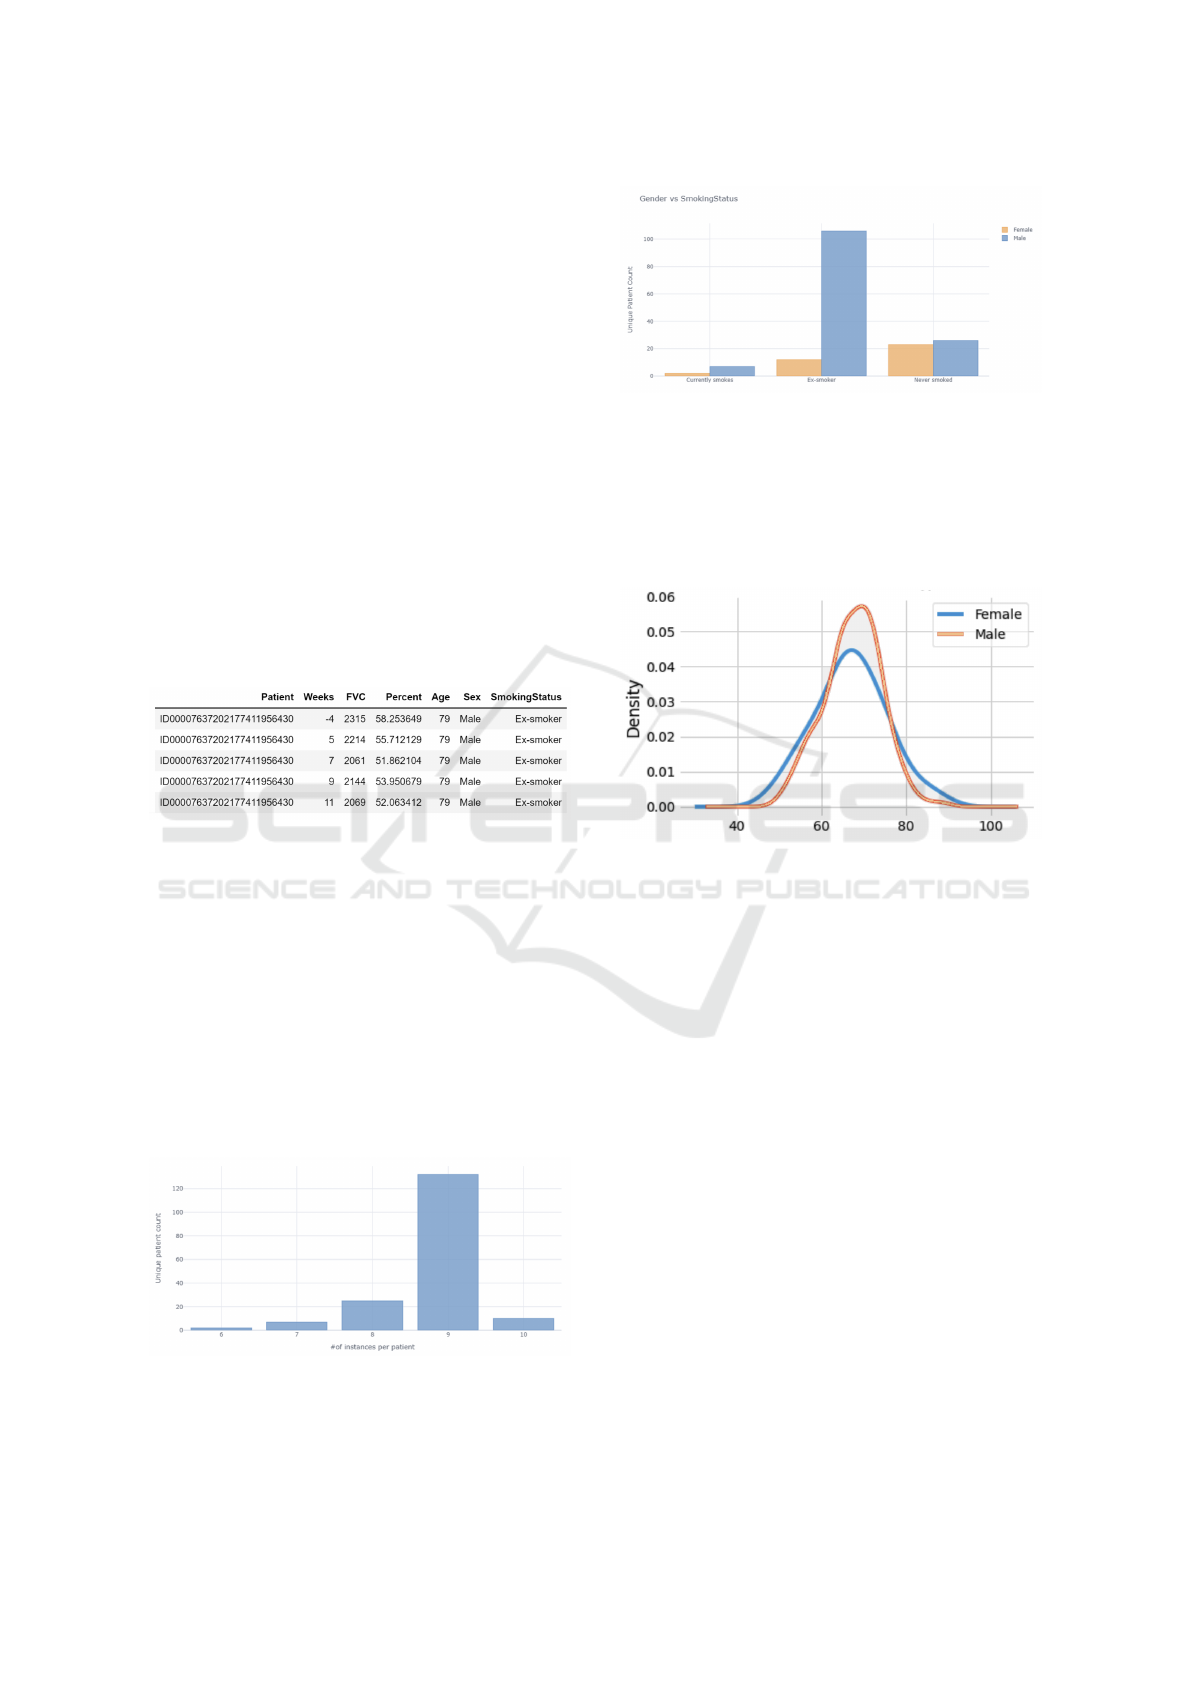
tive/positive values. Table 1 provides an example of
the metadata for a particular patient.
Table 1: FVC ground-truth per week and metadata of pa-
tient ID00007637202177411956430.
The task at hand is to predict the Forced Vi-
tal Capacity of a group of patients for expected
weeks. There are 176 unique patients with an aver-
age of 9 visits per person, which occur at different
weeks throughout the year. Figure 1 presents a his-
togram of the number of visiting weeks referred to as
the number of instances per patient. Figure 2, depicts
the distribution of ‘smoking status’ vs. ‘gender’ of the
patients in the dataset. Male ex-smokers are the most
prevalent group, while there are more never-smoked
cases among female patients. The proportion of non-
smokers is almost equal for both sexes. The figure
highlights the importance of smoking as a risk factor
for pulmonary diseases such as fibrosis.
Figure 1: Instance distribution of unique patients.
The majority of the patients are around 67 years
old with a roughly equal distribution of males and fe-
Figure 2: Instance distribution over smoking status and gen-
der.
males as shown in Figure 3. This is consistent with
the fact that, like many other diseases, age is a major
risk factor for the incidence and prevalence of fibro-
sis. Patients over 60 years old are more likely to be
diagnosed with fibrosis (Raghu et al., 2006).
Figure 3: Distribution of the age of the patients by their
gender.
In figure 4, the FVC distribution across ‘Smoking
status’ and ‘Gender’ is shown. The measurements are
spread over different intervals, and the average FVC
value of male patients is higher than the correspond-
ing female average for each smoking status, which is
in line with expectations. Figure 5 depicts 28 slices
of the chest Computerized Tomography scan of a par-
ticular patient. Notice that he number of images may
differ for each person.
In the next section, the methodology is covered,
and the predictive models of pulmonary fibrosis pro-
gression are described.
4 MULTIPLE QUANTILE
REGRESSION-BASED MODELS
To estimate the FVC value, we propose a multi-
modal model that incorporates computed tomogra-
phy scans, demographic, and clinical data, including
‘Age’, ‘FVC percent’, ‘Sex’, ‘Week number’, and
‘Smoking status’. First, model
CL
a clinical data-
based model using only clinical information. Next,
Enhanced Multimodal Timely Prediction of Pulmonary Fibrosis Progression with Uncertainty Estimation from Chest CT Images and
Clinical Metadata
463
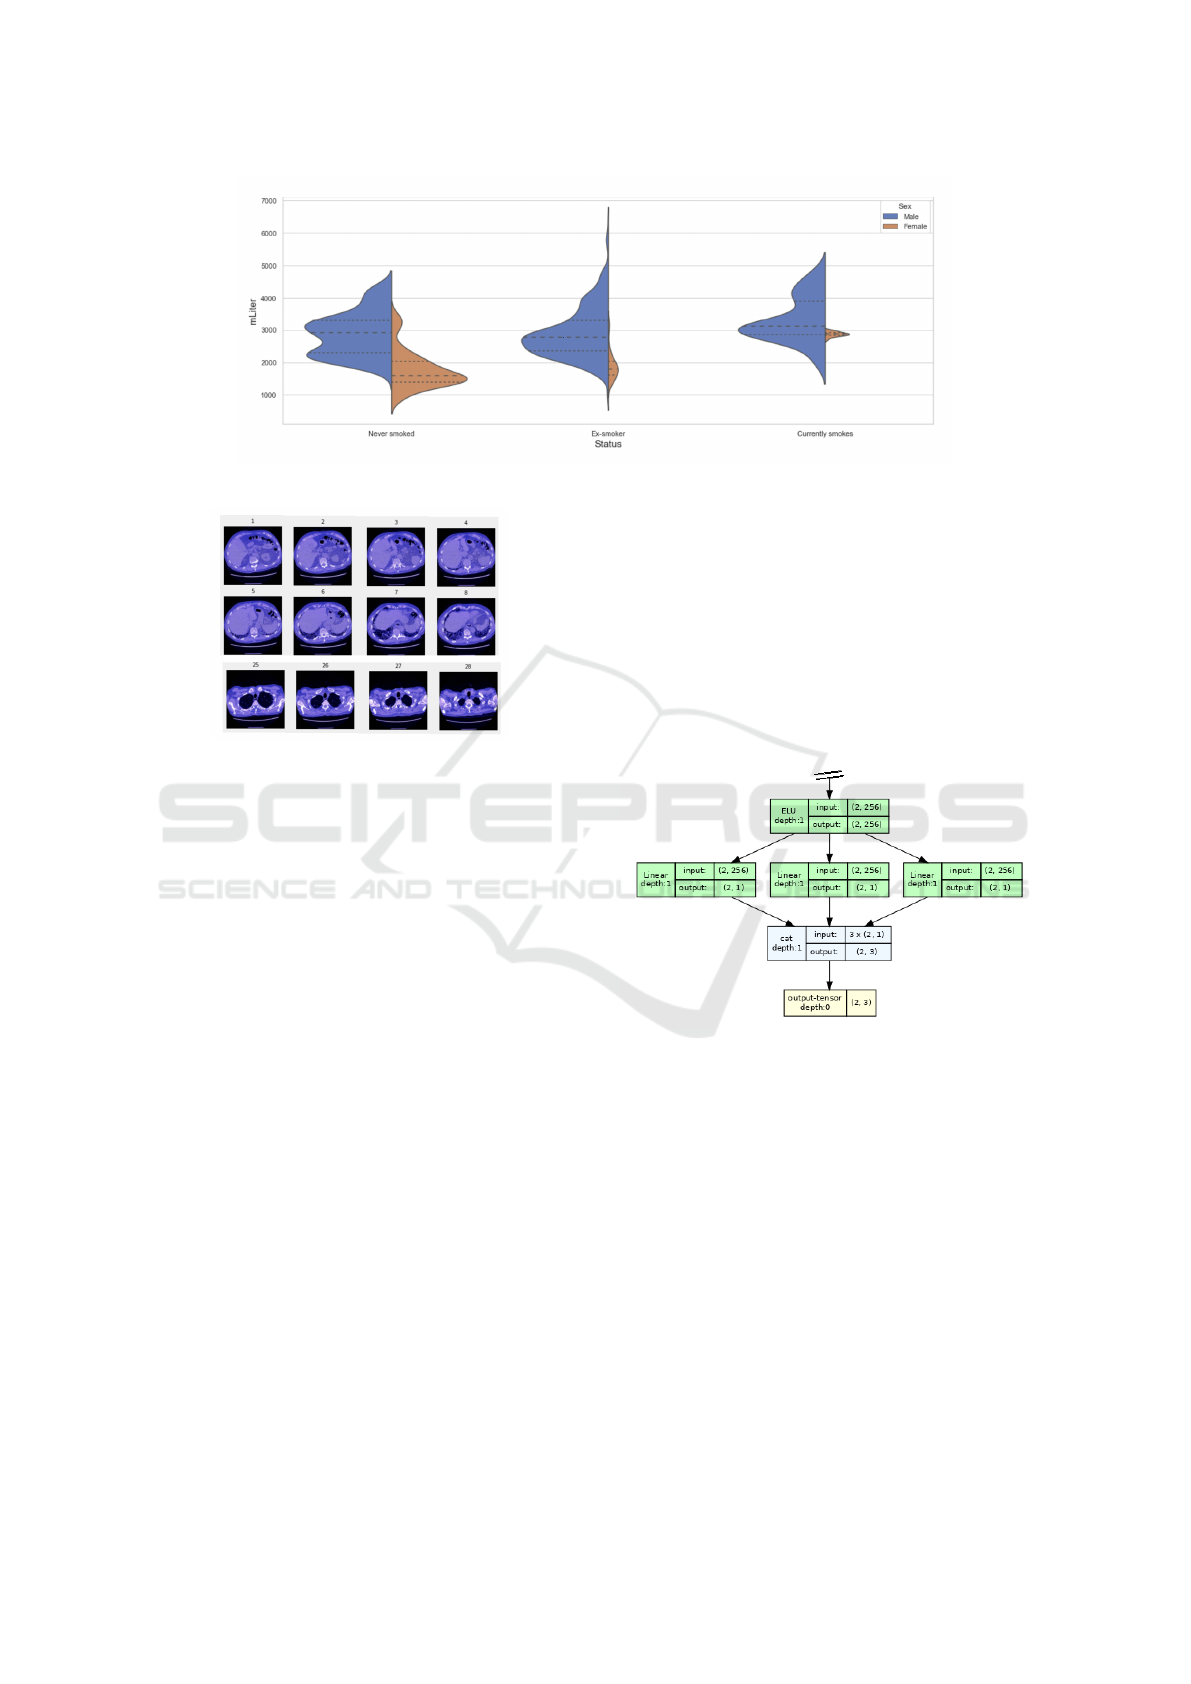
Figure 4: The measured Forced Vital Capacity distribution across smoking-status and gender.
Figure 5: Chest CT-scan from patient
ID00007637202177411956430.
the multimodal model
CL-CT
is trained and evaluated
on both clinical and CT images. Finally, model
Blend
a blended model predicts the final FVC value and the
confidence interval for each week of the considered
period. The performance of the models is analyzed
using the Laplace Log Likelihood (LLL) evaluation
metric, which considers the uncertainty when evalu-
ating the accuracy of the predictions. The problem is
approached as multiple quantile regression problem.
4.1 Clinical Data-Based Model
The clinical data-based model model
CL
depends only
on the clinical data. We applied our confidence block
to the baseline model from (Lhagiimn, 2023). The
input variables of the model consist of both contin-
uous and categorical features. The continuous fea-
tures includes ‘Male’, ‘Female’, ‘Ex-smoker’, ‘Never
smoked’, ‘Currently smokes’, ‘Age’, ‘Week’, ‘Base’,
‘Min percent norm’, and ‘Age week norm’, while the
categorical features consist of ‘Gender’ and ‘Smok-
ing status’. The model incorporates four sequential
blocks and two input blocks. The categorical input
version of the variables ‘Gender’ and ‘Smoking sta-
tus’ are fed to the embedding layer of the prepro-
cessing block for encoding whereas the continuous
variables are fed directly to the self-attention block
with the encoded variables. The confidence block
is plugged to the bottom component of the model
(Fig. 9). As a quantile regressor, the model estimates
the quantiles of a dependent variable expressed as the
conditional median, low quantile, and high quantile
respectively at 50%, 20%, and 80%. Hence, the esti-
mation of the confidence interval is given in general as
a concatenation of the outputs of 3 linear layers since
the model (Fig. 6) has to predict a confidence range
[FVC
L
, FVC
M
, FVC
H
] as in equation 1.
Figure 6: A conventional confidence block.
FVC
L
= Linear(o
block B
)
FVC
M
= Linear(o
block B
) (1)
FVC
H
= Linear(o
block B
)
We applied a anti-Elu layer (Eq. 2) to the output of
intermediate block A (see Fig. 9). That handles both
negative and positive activation with doubled output
dimension (Fig. 7) compared to the traditional Elu
layer (Eq. 3).
o
−
= −Elu(−Linear(o
block A
))
o
+
= −Elu(Linear(o
block A
)) (2)
o = Concat(o
−
, o
+
)
o = Elu(Linear(o
block A
)) (3)
VISAPP 2024 - 19th International Conference on Computer Vision Theory and Applications
464
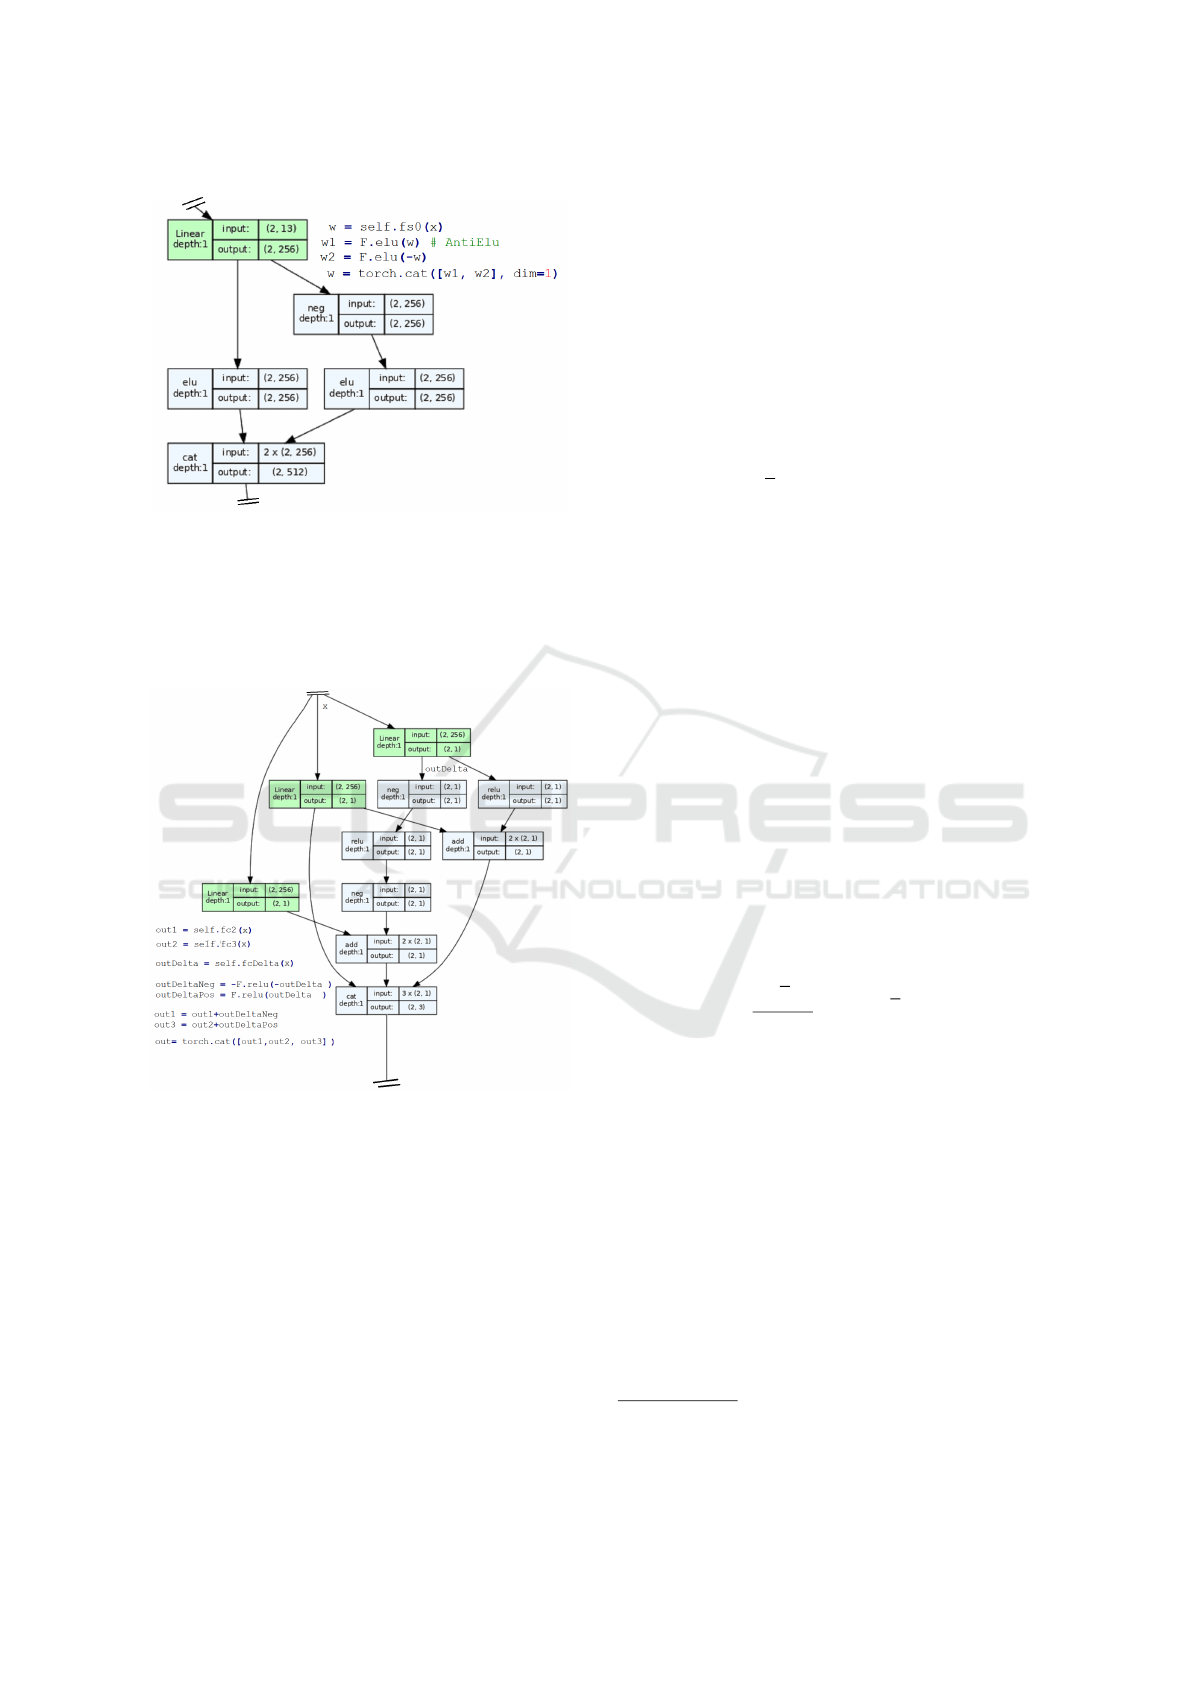
Figure 7: The anti-Elu block.
In comparison to a conventional confidence block, our
confidence block (Fig. 8) uses anti-Relu layers to give
the final estimate of the FVC in block C (see Fig. 9).
As defined in (Eq. 4), the layer helps to enforce the
inequality constraint of equation 5.
Figure 8: The anti-Relu-based confidence block.
x = Linear( Concat(o
CL
, o
CT
))
y = Linear(Concat(o
CL
, o
CT
))
δ = Linear(Concat(o
CL
, o
CT
))
δ
−
= −Relu(−δ) (4)
δ
+
= Relu(δ)
FVC = Concat(x + δ
−
, y, y + δ
+
)
It should be noted that the conventional confidence
of equation 1 may not ensure the desired inequality
(Eq. 5) as it depends only on the model initialisation
and the loss behavior during training.
FVC
L
≤ FVC
M
≤ FVC
H
(5)
4.2 Model Optimization
The mean pinball loss function is used to train the pre-
dictive model as a quantile regression model. As de-
fined in (Eq. 6), the value of the loss is equivalent to
half of the mean absolute error when the quantile pa-
rameter α is set to 0.5.
Pinball(y, ˆy) =
1
n
n
∑
i
α max(y
i
− ˆy
i
, 0)
+(1 −α) max( ˆy
i
−y
i
, 0) (6)
4.3 Evaluation Metric
Since the model should predict both the FVC and its
confidence, we used the Laplace log likelihood (LLL)
as defined in (Eq. 7). It is a well designed metric to
handle the uncertainty on the predictions.
To avoid penalization from large errors, the maxi-
mum error is limited to 1000 ml. The minimum con-
fidence values are clipped to 70 as to reflect the ap-
proximate measurement uncertainty in FVC. The fi-
nal score is calculated by averaging the metric across
all test set Patient-Weeks. For details and more spe-
cific considerations, refer to the modified version of
the LLL used in the challenge
1
.
σ
clipped
= max(σ, 70)
∆ = min(
FVC
gt
−FVC
pred
, 1000) (7)
score = −
√
2∆
σ
clipped
− log
√
2σ
clipped
5 EXPERIMENTATION
The multimodal model portrayed in figure 9, aggre-
gates the clinical data-based model model
CL
and the
CT image-based model model
CT
, in what follows we
will refer to the multimodal model as model
CL,CT
.
The CT scan-based architecture uses efficientNet-
B5 as a backbone model with an input channel dimen-
sion of 1 as the scans are single channel. The classifier
layer of the backbone model was replaced by a linear
layer to extract the image embedding vector that is
concatenated with the clinical embeddings.
1
https://www.kaggle.com/competitions/osic-
pulmonary-fibrosis-progression/overview/evaluation
Enhanced Multimodal Timely Prediction of Pulmonary Fibrosis Progression with Uncertainty Estimation from Chest CT Images and
Clinical Metadata
465
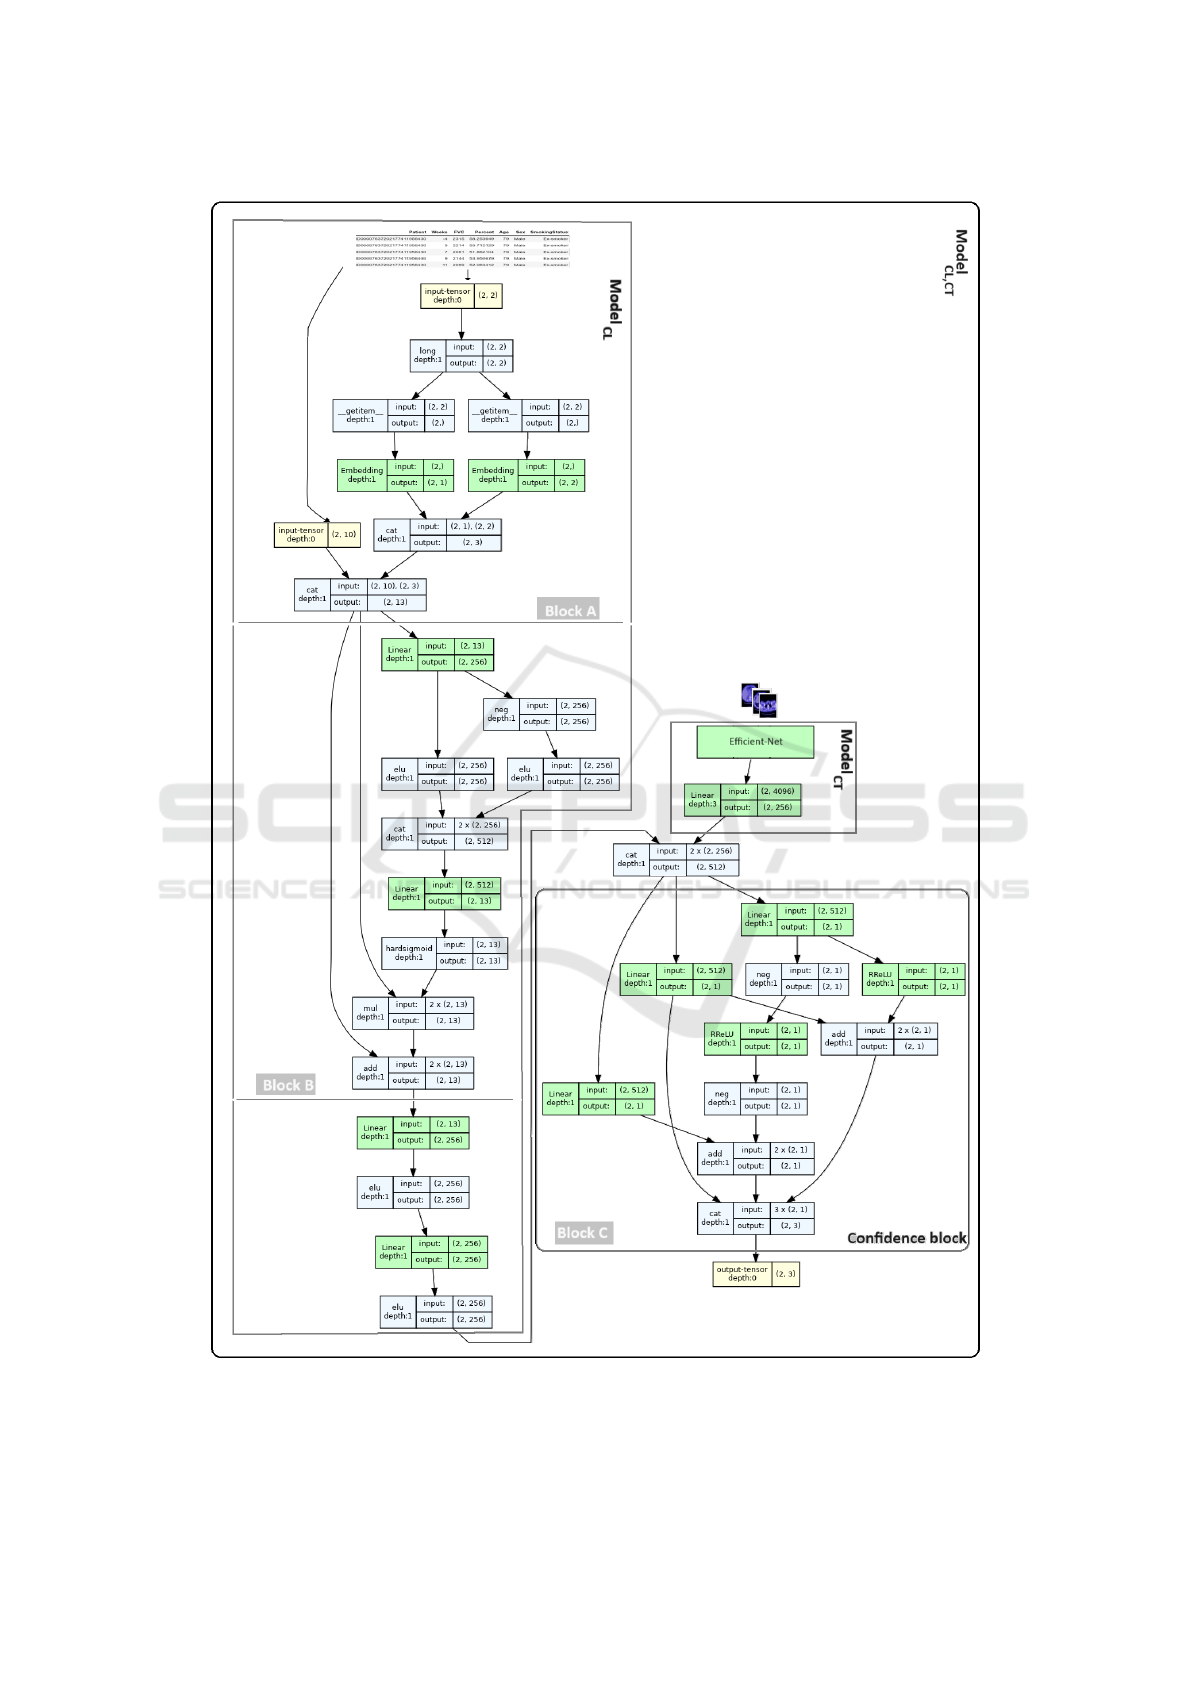
Figure 9: The multimodal model
CL,CT
concatenating the image model and the clinical data-based model
CL
. It combines
three inputs, 10 continues, 2 categorical variables, and CT images.
VISAPP 2024 - 19th International Conference on Computer Vision Theory and Applications
466
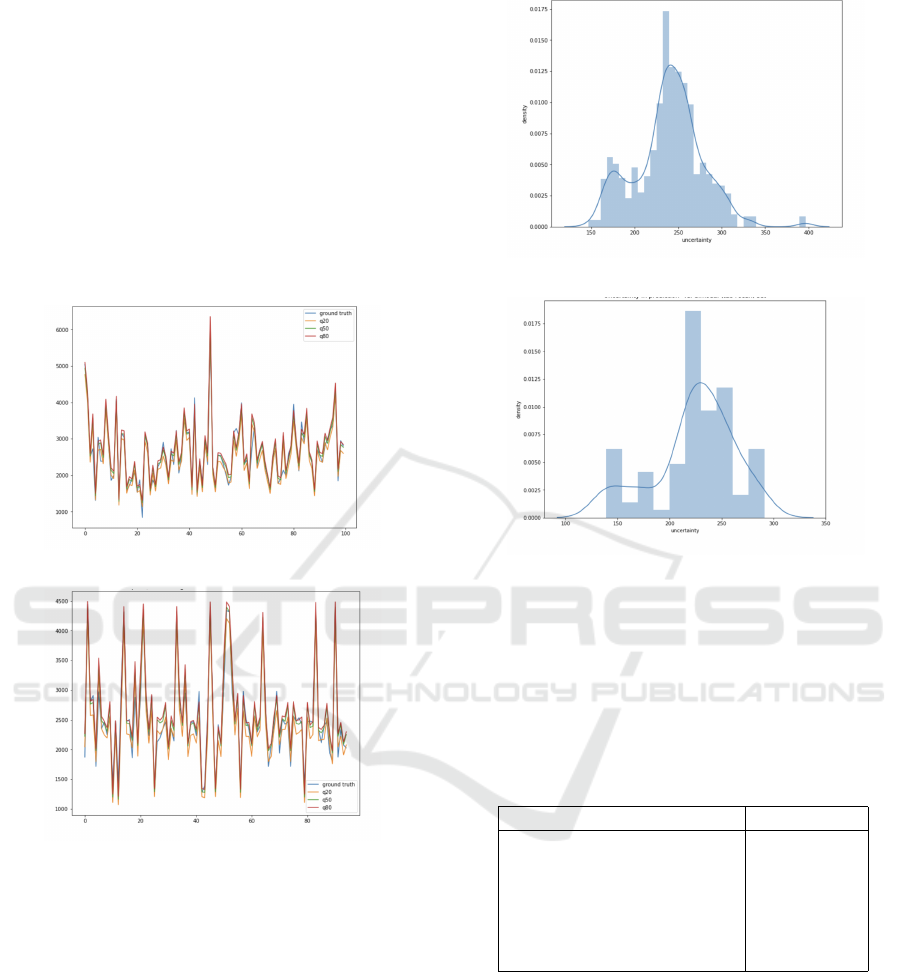
In Figure 10, the predictions of the multiple quan-
tile regression models model
CL
and model
CL,CT
are
shown using the validation dataset. The plots corre-
sponding to the low and high quantile, respectively,
FVC
@.2
and FVC
@.8
, suitably delimit the validation
data. The plot referring to FVC
@.5
is well aligned
with the groundtruth FVC data.
Figure 11 depicts the distribution of the FVC
prediction uncertainty of model
CL
and model
CL,CT
on the validation data. The distributions show how
well the distribution is preserved for both the clinical
data-based model
CL
and the scan-based model
CL,CT
.
Globally, the distributions are almost similar.
(a) Clinical data model
CL
.
(b) Multimodal model
CL,CT
.
Figure 10: Multiple quantile regression: FVC - predictions
on the validation set.
The final FVC values and the corresponding un-
certainty was formulated as a blending of model
CL
and model
CL,CT
predictions (Eq. 8). The weighting
parameters w
CL,CT
= 0.1 and w
CL
= 0.9 that repre-
sent the contribution of the respective model were ex-
perimentally determined.
FVC
Blend
= w
CL,CT
FVC
CL,CT
+ w
CL
FVC
CL
(8)
Table 2 summarizes the performance of the
blended model on the private test set. The baseline
model achieved a LLL score of -6.8272. Compared
to the LLL of the state of the art approach which ob-
(a) Clinical data model
CL
(b) Multimodal model
CL,CT
Figure 11: Uncertainty distribution from validation data.
tained a score of -6.8305, our enhanced model
Blend
achieved a superior LLL of -6.8227 using the pro-
posed anti-Elu of the intermediate block and the anti-
Relu confidence block.
Table 2: The Laplace log likelihood scores of the state-of-
the-art models.
Method LLL score ↓
Baseline (Lhagiimn, 2023) -6.8272
OSIC 1
st
place (Osic, 2023) -6.8305
- 2
nd
place -6.8311
- 3
rd
place -6.8336
model
CL
(ours) -6.8234
model
Blend
(ours) -6.8227
6 CONCLUSION
In this article, we investigated the problem of pre-
dicting the progression of pulmonary fibrosis (FVC)
from clinical data and CT-scan images. The prob-
lem was approached as a multiple quantile regression
problem. The visual scan data modality was com-
pared to clinical metadata modality, and then used to-
gether in a multimodal model. The introduced anti-
Enhanced Multimodal Timely Prediction of Pulmonary Fibrosis Progression with Uncertainty Estimation from Chest CT Images and
Clinical Metadata
467

Elu block intermediate block with the anti-Relu con-
fidence block enhanced the multimodal timely predic-
tion of the pulmonary fibrosis progression with uncer-
tainty estimation. The achieved performance against
the state-of-the-art models proved the effectiveness
of the proposed multimodal quantile regression-based
approach. This demonstrates once again that integrat-
ing the visual modality along with clinical metadata is
beneficial for the robustness of the predictive model.
ACKNOWLEDGEMENTS
We gratefully acknowledge the support of the Com-
puter Research Institute of Montreal (CRIM) and the
Minist
`
ere de l’
´
Economie et de l’Innovation (MEI) of
Quebec.
REFERENCES
Agarwala, S. et al. (2020). Deep learning for screening of
interstitial lung disease patterns in high-resolution CT
images. Clinical Radiology, 75(6):481.e1–481.e8.
Christe, A. et al. (2019). Computer-aided diagnosis of pul-
monary fibrosis using deep learning and CT images.
Investigative Radiology, 54(10):627–632.
Comelli, A. et al. (2020). Lung segmentation on high-
resolution computerized tomography images using
deep learning: A preliminary step for radiomics stud-
ies. Journal of Imaging, 6(11).
du Bois, R. M. et al. (2011). Forced vital capacity in pa-
tients with idiopathic pulmonary fibrosis. American
Journal of Respiratory and Critical Care Medicine,
184(12):1382–1389.
Hutchinson, J. et al. (2015). Global incidence and mortality
of idiopathic pulmonary fibrosis: a systematic review.
European Respiratory Journal, 46(3):795–806.
Kido, S. et al. (2022). Segmentation of Lung Nodules on
CT Images Using a Nested Three-Dimensional Fully
Connected Convolutional Network. Frontiers in Arti-
ficial Intelligence, 5.
Lhagiimn (2023). www.kaggle.com/code/lhagiimn/solution-
for-the-first-place-but-we-didn-t-select (accessed:
15.10.2023).
Mandal, S., Balas, V. E., Shaw, R. N., and Ghosh, A. (2020).
Prediction analysis of idiopathic pulmonary fibrosis
progression from osic dataset. In 2020 IEEE Inter-
national Conference on Computing, Power and Com-
munication Technologies (GUCON), pages 861–865.
Nalysnyk, L., Cid-Ruzafa, J., Rotella, P., and Esser, D.
(2012). Incidence and prevalence of idiopathic pul-
monary fibrosis: review of the literature. European
Respiratory Review, 21(126):355–361.
Noth, I. et al. (2021). Home spirometry in patients with id-
iopathic pulmonary fibrosis: data from the INMARK
trial. Eur. Respir. J., 58(1):1–10.
Osic (2023). OSICcompetition leaderboard.
www.kaggle.com/competitions/osic-pulmonary-
fibrosis-progression/leaderboard (accessed:
15.10.2023).
Raghu, G., Chen, S.-Y., Yeh, W.-S., Maroni, B., Li, Q.,
Lee, Y.-C., and Collard, H. R. (2014). Idiopathic
pulmonary fibrosis in us medicare beneficiaries aged
65 years and older: incidence, prevalence, and sur-
vival, 2001–11. The Lancet Respiratory Medicine,
2(7):566–572.
Raghu, G. et al. (2006). Incidence and prevalence of idio-
pathic pulmonary fibrosis. American Journal of Res-
piratory and Critical Care Medicine, 174(7):810–816.
Scatarige, J. C. et al. (2003). Utility of high-resolution ct
for management of diffuse lung disease: Results of a
survey of u.s. pulmonary physicians. Academic Radi-
ology, 10(2):167–175.
Soffer, S. et al. (2022). Artificial intelligence for interstitial
lung disease analysis on chest computed tomography:
A systematic review. Academic Radiology, 29:S226–
S235. Special Issue: Pulmonary.
Walsh, S. L. F. et al. (2018). Deep learning for classify-
ing fibrotic lung disease on high-resolution computed
tomography: a case-cohort study. The Lancet Respi-
ratory Medicine, 6(11):837–845.
Watters, L. C. et al. (1986). A clinical, radiographic, and
physiologic scoring system for the longitudinal as-
sessment of patients with idiopathic pulmonary fi-
brosis. American Review of Respiratory Disease,
133(1):97–103.
Wells, A. U. and Kokosi, M. A. (2016). Subclinical in-
terstitial lung abnormalities: Toward the early detec-
tion of idiopathic pulmonary fibrosis? American
Journal of Respiratory and Critical Care Medicine,
194(12):1445–1446.
Wong, A. et al. (2021). Fibrosis-net: A tailored deep convo-
lutional neural network design for prediction of pul-
monary fibrosis progression from chest CT images.
Frontiers in Artificial Intelligence, 4.
Yadav, A. et al. (2022). FVC-NET: An automated diagno-
sis of pulmonary fibrosis progression prediction using
honeycombing and deep learning. Computational In-
telligence and Neuroscience, 2022:1–12.
Zucker, E. J. et al. (2020). Deep learning to automate
brasfield chest radiographic scoring for cystic fibrosis.
Journal of Cystic Fibrosis, 19(1):131–138.
VISAPP 2024 - 19th International Conference on Computer Vision Theory and Applications
468
