
Activity Recognition in Smartphones Using Non-Intrusive Sensors
Pedro Fernandes
1 a
, Cesar Analide
1 b
and Bruno Fernandes
1,2 c
1
University of Minho, Largo do Pac¸o, 4704-553, Braga, Portugal
2
PluggableAI, Braga, 4700-312, Portugal
Keywords:
Activity Recognition, Human Behavior, Machine Learning, Mobile Device, Sensor Data and Smartphones.
Abstract:
Activity recognition using smartphones has gained increased attention in recent years due to the widespread
adoption of these devices and, consequently, their various sensors. These sensors are capable of providing
very relevant data for this purpose. Non-intrusive sensors, in particular, offer the advantage of collecting data
without requiring the user to perform any specific action or use any additional devices. The objective of this
study was, therefore, the development of an application designed for activity recognition using exclusively
non-intrusive sensors available in any smartphone. The data collected by these sensors underwent several
processing stages, and after numerous iterations, a set of highly favorable features for training the machine
learning models was obtained. The most prominent result was achieved by the model using the XGBoost
algorithm, which achieved an impressive accuracy rate of 0.979. This quite robust result confirms the high
effectiveness of using this type of sensors for activity recognition.
1 INTRODUCTION
Lately, there has been a rapid increase in smartphone
usage (Tucker and Miller, 2022). Moreover, the num-
ber of individuals adopting sedentary lifestyles is in-
creasing, which can lead to many health problems.
Fitness trackers have provided some evidence that
they help improving human health (Reinberg, 2022).
So, why not leveraging smartphones to recognize peo-
ple’s daily activities? Smartphones contain a wide va-
riety of sensors inside (Nield, 2020), including the ac-
celerometer, magnetometer, gyroscope, gravity sen-
sors, et al. Utilizing the data collected from this
sensors, it is possible, using machine learning, to
detect numerous activities that a user might be do-
ing(Vaughn et al., 2018). One of the main goals
from this paper is to study and identify activities using
smartphone non-intrusive sensors.
Therefore, this study aims to achieve the following
objectives:
1. Develop a mobile app capable of collecting sensor
data;
2. Explore, study and treat the collected data;
a
https://orcid.org/0009-0003-5534-4476
b
https://orcid.org/0000-0002-7796-644X
c
https://orcid.org/0000-0003-1561-2897
3. Designing machine learning models capable if
predicting human activities;
4. Create a software prototype capable of utilizing
the best model.
Through the accomplishment of the objectives,
our aim is to develop an accurate activity prediction
model only utilizing non-intrusive sensors found in
smartphones.
2 STATE OF ART
Sensorization is a modern technology trend that in-
volves incorporating multiple similar sensors into de-
vices or applications. A sensor, on the other hand, is
something capable of perceiving a phenomenon it is
observing and subsequently transmitting its state (Fer-
nandes and Analide, 2022). There are two main types
of sensors, physical and virtual. Physical sensors, as
the name might imply, exist in the physical world.
These devices are used to measure physical quanti-
ties that are converted into signals, typically electri-
cal signals. On the other hand, virtual sensors are
purely based on software. They produce signals au-
tonomously through the combination and aggregation
of other signals that they receive from other sensors,
virtual and physical (Martin et al., 2021). There are a
88
Fernandes, P., Analide, C. and Fernandes, B.
Activity Recognition in Smartphones Using Non-Intrusive Sensors.
DOI: 10.5220/0012303900003636
Paper published under CC license (CC BY-NC-ND 4.0)
In Proceedings of the 16th International Conference on Agents and Artificial Intelligence (ICAART 2024) - Volume 3, pages 88-93
ISBN: 978-989-758-680-4; ISSN: 2184-433X
Proceedings Copyright © 2024 by SCITEPRESS – Science and Technology Publications, Lda.

lot of different sensors, however for the current study
only the ones in table 1 are relevant.
Machine learning is another important concept for
this study. In summary, it is a system capable of learn-
ing from data fed to it, rather than relying on explicit
coding. One very important subcategory of machine
learning is Supervised learning. This paradigm al-
ways starts with a pre-established dataset that con-
tains some understanding of its classification. Its fo-
cus is on finding patterns in the data that can later be
used in analytical processes.
In the literature, there are articles discussing ma-
chine learning models that utilize sensors to predict
human activities. In (Su et al., 2014), the authors be-
gin by mentioning sensors that could be employed for
this purpose, including several we have already dis-
cussed. Following this, they categorize the activities
that are typically predicted into different categories,
with the activities we aim to predict mainly falling
into the simple activities category. Next, they em-
phasize the significance of the features collected for
the models, highlighting that time and frequency fea-
tures are fundamental for studies of this nature. To
conclude the article, they mention various machine
learning models that could be used, such as deci-
sion trees, SVM, neural networks, among others. In
articles (Wang and Kim, 2015) and (Vaughn et al.,
2018), they predicted human activities using smart-
phone sensors specifically, and both developed an An-
droid app for collecting the data. In article (Wang and
Kim, 2015) the results obtained were not analyzed in
terms of accuracy, whereas in article (Vaughn et al.,
2018) the best outcome reported was an 89.5636% ac-
curacy achieved by a random forest model.
3 DATA COLLECTION
3.1 Android App
In order to accomplish the first objective mentioned
earlier, an Android app was developed to collect sen-
sor data. This app is capable of collecting data
from the smartphone accelerometer, gyroscope, grav-
ity sensor, orientation sensor, luminosity sensor, prox-
imity sensor, Bluetooth sensor, and connectivity sen-
sor. Additionally, a smartphone identifier was also
collected to detect malfunctioning data collection de-
vices. It was constructed using the Android sensors
framework, enabling users to collect data for each
activity. Users can initiate data collection, stop it,
save the data to the database, or delete the current
data collection session. Since sensor data is consid-
ered sensitive by Google, it was necessary to create
a foreground service in Android that displays a noti-
fication to the user, indicating that data is being col-
lected in the background. The resulting app is avail-
able for download on the Play Store at the following
link https://play.google.com/store/apps/details?id=co
m.exercisetracker.switchingactivities&pcampaignid=
web share.
3.2 Web Server
To save the data collected by the Android app, a Java-
based app was developed to communicate with it. To
ensure that this app was always available, allowing
users to collect data at any time, it was deployed on
the Google Cloud Platform. It was developed us-
ing the Quarkus framework, typically used for build-
ing applications capable of communication via REST
APIs. In doing so, it was subdivided into four main
types of classes: entities, repositories, services, and
resources. Entities are classes that are meant to be
persisted, in other words, they are supposed to be
saved into the database. In this study, two entities
were created: an ’Activity’ that represents a data col-
lection session and a ’Timestamp’ that represents the
sensor values at each second. Repositories are classes
that allow the communication between entities and
the database. Services, on the other hand, are classes
where all the logic of the application is built. These
classes access the database through the repositories
and are then able to manipulate the entities according
to what they want to do. To conclude, the resources
are the ones capable of communicating with the out-
side, in this case, the Android app. They provide an
API that, when called, will use the services to retrieve
the desired response.
4 EXPERIMENTAL SETUP
4.1 Methodology
In order to be able to get predictions from the final
model, it was necessary to create a tunnel of commu-
nication between the data collection app and the final
model. This tunnel was a python app developed us-
ing the framework Flask so it could communicate via
a REST API. This app primarily focuses on a POST
method that receives a 6-second data sample and pro-
vides an activity prediction.When this app is called,
the first thing it does is read the JSON body of the re-
quest and transform it into a pandas dataframe. After-
ward, the dataframe undergoes the necessary data pre-
processing before being passed to the model, which
then retrieves the final prediction.
Activity Recognition in Smartphones Using Non-Intrusive Sensors
89
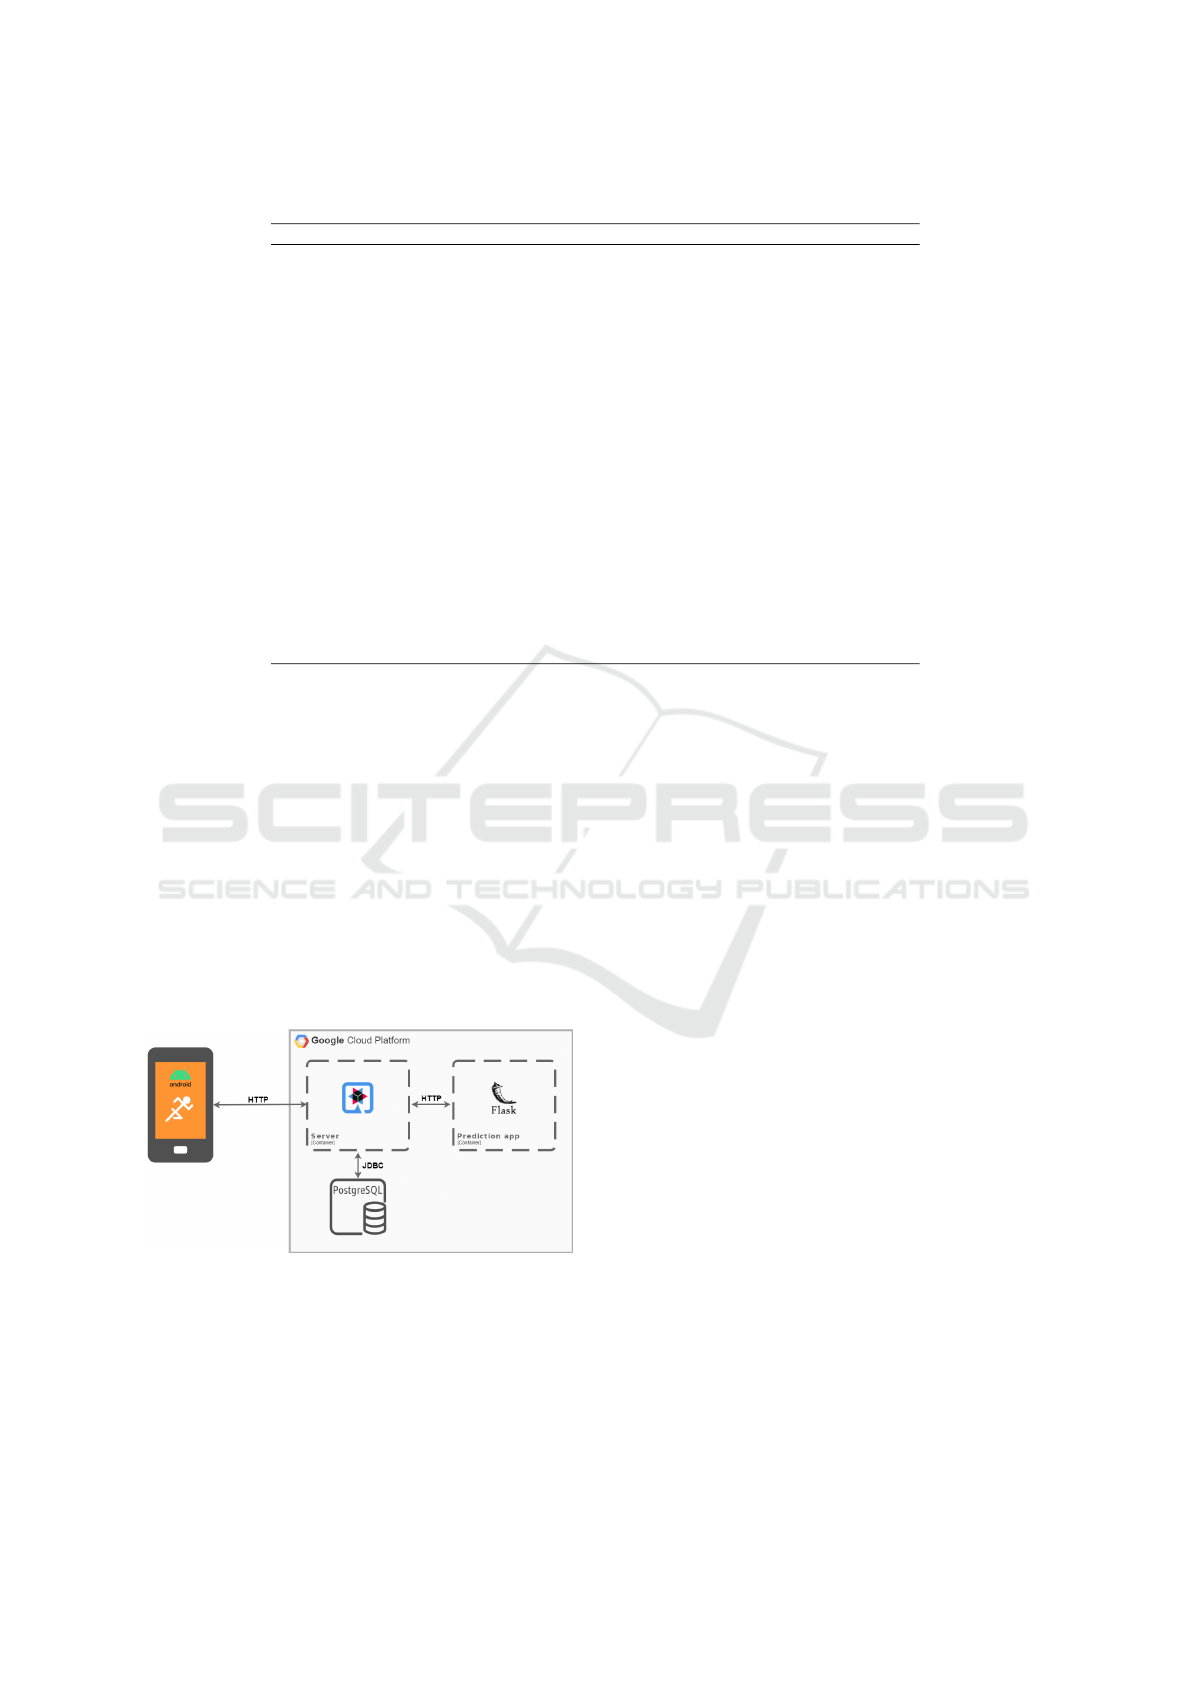
Table 1: Sensors description.
Sensor Description Value Dimension
Accelerometer
Represents the acceleration forces being
applied on the device.
3-dimensional value
Gyroscope
Represents the device’s orientation for
each axis.
3-dimensional value
Gravity sensor
Measures the vectors of gravity
components relative to the device.
3-dimensional value
Orientation sensor Measures the device’s angle orientation. 3-dimensional value
Luminosity sensor
Provides a measurement of the light
intensity incident on the device in lux.
Single value
Proximity sensor
Provides information about the
proximity of objects to it.
Single value
Bluetooth sensor Measures the device’s Bluetooth state. Single value
Connectivity sensor
Provides the device’s current state of
connectivity.
Single value
The final project architecture can be find in the fig-
ure 1. Explaining the flow of communication, let’s
start with a user using the Android app. Within the
app, a user can either collect data or predict his cur-
rent activity. In both cases the flow starts with the an-
droid app communicating with the Java server, hosted
in google cloud platform, using HTTP. Afterwards in
case the request is meant to save data, the data will be
stored into a PostgreSQL database through a JDBC
driver. However, if the request was to predict an ac-
tivity, the sample data will be sent to the Python app
via HTTP, and the response will also be received via
HTTP. Subsequently, in both cases, the flow will con-
clude with the server responding to the Android app.
Figure 1: Project final architecture.
4.2 Data Preprocessing
The raw data collected from sensors represent loose
measurements that, without any processing, don’t
mean anything. So the preparation of the data started
with dividing the data per collection session. After-
wards, numerical data underwent subtraction between
each two consecutive data points, while categorical
data retained the value of the first data point. The next
step was applying some feature engineering and cal-
culating new features, such as linear acceleration, the
magnitude of linear acceleration, and the magnitude
of linear gravity. Following that all the categorical
data was encoded into numerical values. Next to that,
the data was divided into 6-second samples, and for
numerical data, the mean, min, max, and standard de-
viation for each feature were calculated, while for cat-
egorical data, the mode was kept. Finally all features
with correlation higher than 85% were excluded.
After this data manipulation the objective was to
balance the data. The final data distribution was very
uneven, with walking, cycling and running samples
floating between 10 000 and 20 000 samples, while
driving having close to 50 000 samples and resting
only 9 322 samples. An imbalanced dataset is not
suitable for machine learning models because they
might develop biases toward certain classes. To ad-
dress this issue, the dataset underwent undersampling,
with 10 000 random samples kept for each activity.
Upon closer examination of specific feature val-
ues, it was observed that certain features contained a
noticeable number of outliers. However, it was de-
cided not to remove them in order to avoid signifi-
cantly reducing the variability of the values.
Looking at the categorical data for each activity, it
was found a clear correlation between the Bluetooth
and connectivity sensors with each activity. This cor-
ICAART 2024 - 16th International Conference on Agents and Artificial Intelligence
90

relation was due to the lack of variability in the data
and not a clear indicator to choose one class over the
other. So it was decided to drop any features from this
sensors. The final dataset ended up with 30 different
features from which the model can train and predict
each activity.
4.3 Experiments
To obtain the best results for each model, we used
grid search to train the models. This is a technique
utilized to identify the optimal hyperparameters for a
specific model. In practice, what this technique does
is create various models for each combination of hy-
perparameters and then evaluates them using cross-
validation. This evaluation method allows us to as-
sess how well a model generalizes. It involves a
resampling method that uses different data samples
for testing and training the model in various itera-
tions. Within our experiments, we tuned the hyper-
parameters used by the GridSearchCV method from
the Python library scikit-learn. The ’cv’ parameter
was set as ’KFold(n splits=10)’ to establish a ten-
fold cross-validation division strategy. The ’n jobs’
was set ti ’-1’ so we could use the full computational
power of the CPU.’Scoring’ was configured with ’ac-
curacy’ to evaluate the model performance. Addition-
ally, ’refit’ was enabled (’True’) to readjust the es-
timator, and ’return train score’ was set to ’True’ to
allow retrieval of training values.
For each of the developed models, a grid search
was applied to obtain the best hyperparameters that
are shown in the table 2.
Table 2: Optimal hyperparameters for each model.
Model Optimal hyperparameters
Logistic Regression
C = 5;
penalty = ’l1’.
Decision Tree
criterion = ’entropy’;
max depth = 9;
min samples leaf = 1.
Random Forest
bootstrap = True;
max depth = 80;
max features = 3;
min samples leaf = 3;
min samples split = 8;
n estimators = 300.
XGBoost
max depth = 9;
learning rate = 0.1;
objective = ’binary:logistic’;
n estimators = 100.
5 RESULTS AND DISCUSSION
Logistic regression is one of the simplest models, typ-
ically used for less complex problems. Even though
this is the case, this algorithm was able to achieve an
impressive accuracy value of 0.845. Looking at ta-
ble 3 we are able to compare its results more in depth
for each activity. In doing so, we can see that this
model performed excellently in predicting the run-
ning activity with a precision of 0.93. However, it
did not perform as well in predicting the walking
activity, achieving a much lower precision value of
0.77. The model’s feature importance was also taken
into account. It identified the top three features as
the ’linear accelerometer magnitude rolling mean’,
’linear gravity magnitude rolling mean’, and ’gyro-
scopez diff rolling min’, with importance values of
0.400, 0.202, and 0.095, respectively.
Table 3: Logistic regression model results.
Class Precision Recall F1-score Sample
resting 0.84 0.93 0.88 1849
walking 0.77 0.67 0.72 1987
running 0.93 0.90 0.92 1988
cycling 0.82 0.80 0.81 2024
driving 0.86 0.92 0.89 2017
A decision tree is an algorithm that supports a
hierarchical decision using a tree structure. This
model was able to achieve an accuracy value of 0.893,
thereby obtaining a better result than the logistic
regression model. Table 4 shows the results from this
model, regarding each activity. Analyzing it, we can
see that the class with lower precision is also walking,
with the same value of 0.77. However, its recall and
F1-score are better compared to the previous model.
The activity with most accurate predictions this time
is resting, with a precision of 0.97. Looking at the
feature importance in this model we get the features
’linear accelerometer magnitude rolling mean’,
’gyroscopex diff rolling min’ and ’gravi-
tyy diff rolling max’ with importance values of
0.278, 0.230 and 0.116.
Table 4: Decision tree model results.
Class Precision Recall F1-score Sample
resting 0.97 0.93 0.95 1849
walking 0.77 0.84 0.80 1987
running 0.96 0.93 0.94 1988
cycling 0.85 0.85 0.85 2024
driving 0.95 0.92 0.93 2017
A random forest is an algorithm similar to a deci-
sion tree, with the main difference being the fact that
the former uses a set of the latter in its functioning. In
this case, it was expected to yield a better result, and
Activity Recognition in Smartphones Using Non-Intrusive Sensors
91

that proved to be true, with an accuracy of 0.955. Like
the previous model, the best-predicted activity was
resting, with a precision of 0.99. Similarly, the worst-
predicted activity was walking, but this time with a
precision of 0.90, as we can see in the table 5. The
top three most important features for this model were
’linear accelerometer magnitude rolling mean’,
’gravityy diff rolling max’ and ’accelerome-
terz diff rolling max’ with importance values of
0.122, 0.022 and 0.022 respectively.
Table 5: Random forest model results.
Class Precision Recall F1-score Sample
resting 0.99 0.97 0.98 1849
walking 0.90 0.94 0.92 1987
running 0.98 0.96 0.97 1988
cycling 0.95 0.95 0.95 2024
driving 0.97 0.96 0.96 2017
The last, but definitely not least important model
created was the XGboost. The inherent algorithm
represents an evolution from random forest because,
while the latter uses a fixed set of parameters,
the former adjusts them iteratively while running.
Doing so, it’s not surprising that it achieved a
higher accuracy, with a result of 0.979. Looking
at table 6, we can see that this model achieved a
precision of 0.99 in the activities resting, running
and driving while its worst result, 0.95, was for
walking. In terms of feature importance the features
’linear accelerometer magnitude rolling mean’,
’gravityy diff rolling min’ and ’gyro-
scopez diff rolling min’ take the podium with
the values of 0.226, 0.031 and 0.027.
Table 6: XGboost model results.
Class Precision Recall F1-score Sample
resting 0.99 0.99 0.99 1849
walking 0.95 0.97 0.96 1987
running 0.99 0.98 0.99 1988
cycling 0.97 0.98 0.98 2024
driving 0.99 0.98 0.98 2017
Now, looking at the big picture and evaluating the
models based on their final accuracy, we conclude that
the XGboost model deserves to be crowned as our
king.
6 CONCLUSIONS
In this study, our focus was centered around creat-
ing a holistic framework incorporating data collec-
tion, cloud based data storage, data preprocessing and
machine learning models.
To collect smartphone sensor data, an Android app
was created. This app not only was capable of collect-
ing data but also made sure its continuous collection.
At the same time a cloud based app was deployed in
Google Cloud Platform, providing an always on and
safe place to store the data. The transformation of
this data took a fundamental role in this study. The
rigorous data prepossessing and feature engineering
techniques applied to the data, enabled us to bridge
the gap between the raw sensor data and the clean
input data needed to develop predictive-capable ma-
chine learning models. After this step, the final data
obtained was used to train various models capable of
predicting human activities like resting, walking, run-
ning, riding a bike and driving.
Regarding the obtained results, they show the ef-
fectiveness of our approach and also show the poten-
tial for practical applications across various domains,
including healthcare, transportation, and more. For
future work, we will focus on enhancing the exist-
ing models, explore new activities and extend this ap-
proach to a larger range of sensor-equipped-devices.
Additionally, it is important during the initial phase of
data collection, to try to gather more diverse data for
each activity, enabling a better generalization in the
final model.
With the continuous evolution of the smartphone
technology and the increasing importance of the
human-machine interaction, the path ahead promises
several challenges and opportunities as we try to make
our digital companions smarter and more in sync with
our daily lives.
ACKNOWLEDGEMENTS
I would like to express my deep gratitude to all the
people who made the realization of this work possi-
ble. First and foremost, to my advisors, Bruno Fer-
nandes and Cesar Analide, for their unwavering sup-
port throughout this project.
To my family, for their unconditional love, con-
stant support, and understanding. To my friends, for
genuine friendship, invaluable encouragement, and
for always being by my side.
To the Shubox team, starting with my boss and
brother, Tiago, who first showed me that a keyboard
was not just a keyboard but rather a key to unlock a
whole new world. To Jose, our Chief Product Officer,
who challenged and trusted me to dig deeper into data
and find the music in the noise. To Anthony, our CEO,
who showed me I did not just have to find my place
in the world that exists, I could create the one I wish
existed.
ICAART 2024 - 16th International Conference on Agents and Artificial Intelligence
92

To all those who contributed to the data collection,
my sincere and profound thanks. Last but not least, I
would like to thank the staff at the CP1 University of
Minho bar for their attention and kindness throughout
my academic journey.
This work would not have been possible without
the support of all of you. Thank you from the bottom
of my heart
REFERENCES
Fernandes, B. and Analide, C. (2022). Concepts and plat-
forms.
Martin, D., K
¨
uhl, N., and Satzger, G. (2021). Virtual sen-
sors. Business & Information Systems Engineering,
63(3):315–323.
Nield, D. (2020). All the sensors in your smartphone, and
how they work. Gizmodo.
Reinberg, S. (2022). More evidence fitness trackers can
boost your health. WebMD.
Su, X., Tong, H., and Ji, P. (2014). Activity recognition
with smartphone sensors. Tsinghua Science and Tech-
nology, 19(3):235–249.
Tucker, E. and Miller, Z. (2022). How many people have
smartphones in 2022? Oberlo.
Vaughn, A., Biocco, P., Liu, Y., and Anwar, M. (2018).
Activity detection and analysis using smartphone sen-
sors. In 2018 IEEE International Conference on Infor-
mation Reuse and Integration (IRI), pages 102–107.
Wang, X. and Kim, H. (2015). Detecting user activities with
the accelerometer on android smartphones. Journal of
Multimedia Information System, 2(2):233–240.
Activity Recognition in Smartphones Using Non-Intrusive Sensors
93
