Machine Learning in Industrial Quality Control of Glass Bottle Prints
Maximilian Bundscherer, Thomas H. Schmitt and Tobias Bocklet
Department of Computer Science, Technische Hochschule N
¨
urnberg Georg Simon Ohm, Nuremberg, Germany
Keywords:
Machine Learning, Quality Control, Industrial Manufacturing, Glass Bottle Prints.
Abstract:
In industrial manufacturing of glass bottles, quality control of bottle prints is necessary as numerous factors
can negatively affect the printing process. Even minor defects in the bottle prints must be detected despite
reflections in the glass or manufacturing-related deviations. In cooperation with our medium-sized industrial
partner, two ML-based approaches for quality control of these bottle prints were developed and evaluated,
which can also be used in this challenging scenario. Our first approach utilized different filters to supress
reflections (e.g. Sobel or Canny) and image quality metrics for image comparison (e.g. MSE or SSIM) as fea-
tures for different supervised classification models (e.g. SVM or k-Neighbors), which resulted in an accuracy
of 84%. The images were aligned based on the ORB algorithm, which allowed us to estimate the rotations
of the prints, which may serve as an indicator for anomalies in the manufacturing process. In our second
approach, we fine-tuned different pre-trained CNN models (e.g. ResNet or VGG) for binary classification,
which resulted in an accuracy of 87%. Utilizing Grad-Cam on our fine-tuned ResNet-34, we were able to lo-
calize and visualize frequently defective bottle print regions. This method allowed us to provide insights that
could be used to optimize the actual manufacturing process. This paper also describes our general approach
and the challenges we encountered in practice with data collection during ongoing production, unsupervised
preselection, and labeling.
1 INTRODUCTION
In industrial manufacturing, glass can be printed uti-
lizing a technique called Silk-Screen Printing. In the
Silk-Screen Printing process, the ink is transferred
onto the glass surface through a stencil. The stencils
must be constantly adjusted during ongoing produc-
tion, as the stencils wear out in various areas and the
quality of the prints is negatively affected as a result.
For instance, the prints could be smeared, incomplete,
or rotated, as shown in Figure 1. In cooperation with
our medium-sized industrial partner, who also relies
on Silk-Screen Printing, we investigated the quality
control of glass bottle prints utilizing machine learn-
ing and computer vision methods.
1.1 Our Contributions
The main contributions of this work are:
• Data collection during ongoing production.
• Unsupervised preselection of images and image
labeling by quality assurance (QA) experts.
• Development and evaluation of an approach
(AP1) based on a reference image of an accept-
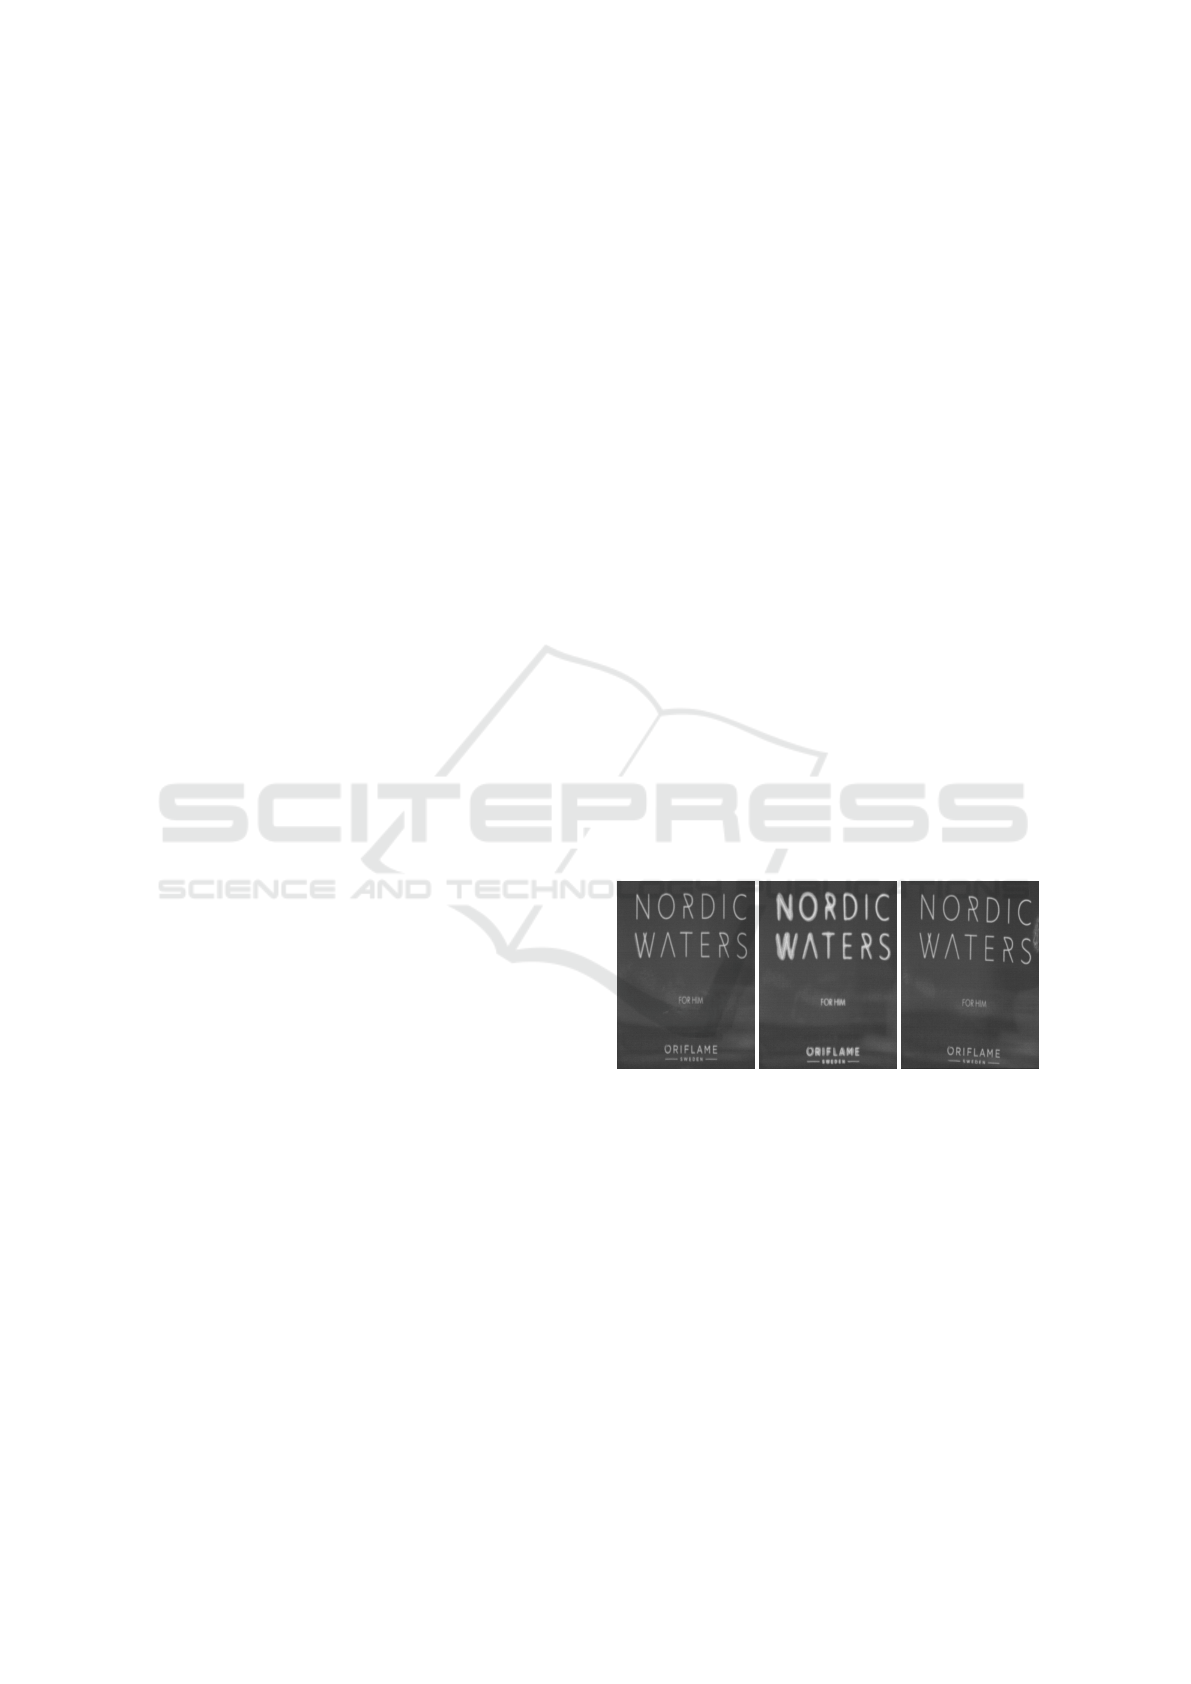
Figure 1: Cropped images of glass bottle prints: (left) ac-
ceptable print, (middle) unacceptable smeared print, and
(right) unacceptable rotated print.
able print, ORB alignment, filters, image quality
metrics, and supervised classification models.
• Development and evaluation of a second approach
(AP2) based on pre-trained CNN models.
• Proposal of a method in which ORB image align-
ment parameters, such as rotation, can be used as
an anomaly indicator.
• Proposal of a method in which Grad-Cam visu-
alizations of our fine-tuned CNN models can be
employed to identify frequently defective areas of
bottle prints.
264
Bundscherer, M., Schmitt, T. and Bocklet, T.
Machine Learning in Industr ial Quality Control of Glass Bottle Prints.
DOI: 10.5220/0012302600003660
Paper published under CC license (CC BY-NC-ND 4.0)
In Proceedings of the 19th International Joint Conference on Computer Vision, Imaging and Computer Graphics Theory and Applications (VISIGRAPP 2024) - Volume 3: VISAPP, pages
264-271
ISBN: 978-989-758-679-8; ISSN: 2184-4321
Proceedings Copyright © 2024 by SCITEPRESS – Science and Technology Publications, Lda.

1.2 Related Work
In (Zhou et al., 2019a), defects in glass bottle bot-
toms were classified using Saliency Detection and
Template Matching. The comprehensive study (Zhou
et al., 2019b) investigated Visual Attention Models
and Wavelet Transformations for the same purpose.
While these studies did not address the classification
of glass bottle prints, they are related to the quality
control of glass bottles in industrial processes. We
employed pre-trained CNN models, which have also
been utilized in other industrial applications studies.
In (Villalba-Diez et al., 2019), CNN models for qual-
ity control in the printing industry were investigated.
CNN models were also evaluated for quality control
of textures in the automotive industry (Malaca et al.,
2019). At supermarket checkouts, VGG models from
(Hossain et al., 2018) were able to classify fruits au-
tomatically, and ResNet models from (Quach et al.,
2020) were suitable for detecting chicken diseases.
CNN models were also investigated in pathologi-
cal brain image classification in (Kaur and Gandhi,
2019).
1.3 Outline
This paper is structured as follows: Section 2 de-
scribes, the actual application & our data and how we
collected data during ongoing production and made
an unsupervised pre-selection for data labelling. Sec-
tion 3 describes how the images were prepared for
classification, comprising filters, image quality met-
rics (IQMs), and image alignment based on the ORB
algorithm. In Section 4, our two approaches are inde-
pendently introduced. In Section 5, we evaluate our
approaches and show how our methods can be used
beyond binary classification for industrial manufac-
turing process optimization. In Section 6, we inter-
pret our results and describe the limitations. The final
Section 7 presents the findings of this study
2 APPLICATION & DATA
Reflections in glass bottles are unavoidable when tak-
ing pictures with an (external) light source. Glass re-
flections that occur during photography are described
in (Sudo et al., 2021). In industrial manufacturing, at-
tempts are made to avoid this challenge by adjusting
the image-capturing process so that the reflections are
shifted to regions that are irrelevant for quality con-
trol.
Our partner already uses an automatic system for
quality control, which does not reliably detect defec-
Figure 2: Photography setup: (left) system overview and
(right) a captured image. The camera and lighting remain
stationary during the capture, and the bottle is rotated.
tive bottle prints and is not robust against environmen-
tal influences, like reflections and misalignment. The
currently used system compares bottle images with a
reference image of an acceptable bottle and counts the
number of differing pixels. How far the bottle devi-
ates from the reference bottle to still be classified as
acceptable has to be specified via a threshold value.
Since reflections lead to more variation than the actual
defects, the system is inadequate for bottles where it
is impossible to cause the reflections to occur outside
the bottle prints in the image-capturing process.
Dispatched defective bottles cost the company sig-
nificantly more in take-back costs and reputational
damage than rejecting acceptable bottles. So, our
partner specified that the focus should be on a high
true positive rate since manual follow-up inspections
of rejected bottles can mitigate false positives. Since
one classification system is used per production line,
a defective bottle must be classified and sorted out
within 1s. The mechanism to remove defective bot-
tles takes about 0.2s, which entails that our system
must be able to process images within 0.8s.
During the initial data analysis, two additional
challenges were identified: A major challenge is that
bottles do not have exactly the same shape due to mi-
cro variations in the manufacturing process. There-
fore, the reflections in the glass bottles always oc-
cur in different regions. Minimal differences in glass
shapes are otherwise negligible for the quality control
of bottle prints. Another challenge is that the bottles
are always slightly displaced or rotated in the images
due to the physical conditions of photography (rotat-
ing axis). It is difficult to determine whether the bottle
or the print is rotated or shifted, which would indicate
a defective bottle print. The current system does not
use automatic image alignment, which, together with
the various occurring reflections, explains the unreli-
able classification results.
2.1 Data Collection
Our industry partner already automatically captures
images with a fully integrated system. Each bottle is
photographed at the end of the production line. In ad-
Machine Learning in Industrial Quality Control of Glass Bottle Prints
265

dition to the time stamp, it is also stored whether the
bottle is classified as acceptable according to the clas-
sification system currently in use. The bottles are held
and rotated with a rotating axis for photography, keep-
ing the camera and the lighting stationary, as shown in
Figure 2.
We copied the images during ongoing production,
which was not allowed to be disturbed. To be inde-
pendent of an internet connection, we continuously
copied the images and metadata to an external 4TB
USB 3.0 hard drive from a Samba share via Raspberry
Pi 4, rsync and cron. Transferring all images in real
time was impossible due to network connectivity and
hardware limitations on read and write speeds. After
some practical tests, we decided to copy a maximum
of 500 images (approx. 5GB) every 15m. The less
frequently bottle images, considered unacceptable by
the current system, have been prioritized.
2.2 Unsupervised Preselection
Reducing the number of images was necessary for the
labeling process. Due to time and cost constraints,
a manual review of all images was not possible, so
we decided on an unsupervised preselection. In our
preselection, the bottle images were compared with
a reference image of an acceptable bottle. Our QA
experts specified this reference bottle. Image quality
metrics (IQMs) were utilized for these comparisons,
described in Section 3.1. The comparison window
was chosen as small as possible to reduce the influ-
ence of reflections. We managed to compare only the
actual prints without reflections. The images were
aligned based on the ORB algorithm to mitigate the
influence of physical conditions during photography,
see Section 3.3.
Images that differed more than 80% from the av-
erage (potentially unacceptable prints) were approved
for labeling together with images that differed less
than 20% from the average (potentially acceptable
prints). These values were adjusted to represent an
expected manufacturing distribution based on the ex-
pertise of our industry partner.
2.3 Labeling
Our QA experts labeled 800 bottle print images using
LabelStudio (Tkachenko et al., 2022). A customized
labeling template was built to rate rotated, smeared,
cropped, shifted, or incomplete prints using a scale
from 1 to 6. These ratings were mapped to binary la-
bels (acceptable and unacceptable prints) due to the
future application and widely varying defects. It was
also challenging for our QA experts to label the de-
Figure 3: Cropped images: (left) image without filter, (mid-
dle) image with Sobel, and (right) image with Canny. Re-
flections and the luminous background are reduced by ap-
plying these filters.
fects meaningfully according to the abovementioned
criteria, so they often used the other defect option.
Our QA experts specified a print as unacceptable if
any defect was rated higher than 3.
In total, 83 bottles were specified as unacceptable.
Therefore 166 (+83 images of acceptable prints) were
used for the evaluation.
3 DATA PREPARATION
We utilized colored images (3 channels) or grayscale
images (1 channel) for our experiments. We also in-
vestigated different data preparation techniques, com-
prising image quality metrics (IQMs), filters, and im-
age alignment based on the ORB algorithm.
3.1 Image Quality Metrics
Image quality metrics (IQMs) are measures for as-
sessing the similarity of two images and are usually
used to evaluate image compression algorithms (Sara
et al., 2019) (Bakurov et al., 2022) (Tan et al., 2013)
(Jain and Bhateja, 2011). We utilized IQMs to com-
pare an image of a test bottle with an image of a ref-
erence bottle. A large difference should indicate that
the bottle print is unacceptable.
This study utilized Mean-Squared Error (MSE),
Normalized Root MSE (NRMSE), and Structural Sim-
ilarity Index (SSIM) (Sara et al., 2019) as IQMs for
image comparison.
3.2 Image Filters
Various reflections lead to more variation than the ac-
tual defects. Edge detectors (or filters) such as So-
bel (Gonzales and Wintz, 1987) and Canny (Canny,
1986) are able to reduce the effects of reflections in
images by emphasizing strong edges and suppress-
ing weak edges (
¨
Ozt
¨
urk and Akdemir, 2015) (Forcado
and Estrada, 2018). We tested different filters and pa-
rameters to emphasize bottle print letters and suppress
reflections, as shown in Figure 3.
VISAPP 2024 - 19th International Conference on Computer Vision Theory and Applications
266

Figure 4: Visualization of our two approaches: (AP1) ORB,
Filters, IQMs, & Classifiers and (AP2) Transfer Learning
with CNN Models. Some methods from our approaches
can be used beyond binary classification (Insights).
This study utilized Sobel, Sobel-v, Sobel-h,
Canny-2, Canny-2.5, and Canny-3 filters. For Sobel
filters, the suffixes refer to their directions (vertical
and horizontal). For Canny, the suffixes refer to the
sigma values used (2, 2.5, and 3). We also utilized
the original images No-Filter and histogram equalized
images Equal-Hist.
3.3 ORB Alignment
The bottles are always slightly displaced or rotated in
the images due to the physical conditions of photogra-
phy. For image comparison utilizing IQMs, we relied
on aligned images based on the ORB algorithm. The
ORB (Oriented FAST and Rotated BRIEF) algorithm
is based on the Oriented FAST (Features from Accel-
erated Segment Test) Corner Detection algorithm and
the Rotated BRIEF (Binary Robust Independent El-
ementary Features) Descriptor (Rublee et al., 2011).
The reference image of an acceptable bottle specified
by our QA experts was used as alignment reference
for all other images.
The rotation of an image related to a reference
image can be estimated by the detected keypoints
(BRIEF Descriptors) and computations on the ho-
mography matrix (Luo et al., 2019). We use this tech-
nique to get a better understanding of rotated bottle
prints in industrial manufacturing over time.
4 APPROACHES
Figure 4 shows an abstract visualization of our two
approaches AP1 and AP2. We relied on Leave-One-
Out Cross-Validation (LOOCV) to train and evaluate
our models. In total, 83 bottles were specified as un-
acceptable. Therefore 166 (+83 images of acceptable
prints) were used utilized.
4.1 AP1: ORB, Filters, IQMs, and
Classifiers
In our first approach (AP1), the test bottle images
were aligned based on the ORB algorithm via the ref-
erence image of an acceptable bottle, see Section 3.3.
In the next step, 8 filters were applied to the test bot-
tle images and to the reference image (for subsequent
image comparisons), see Section 3.2. Finally, 3 IQMs
were utilized for comparing the processed test bottle
images with the processed reference images, see Sec-
tion 3.1.
In total, 24 combinations (8 filters × 3 IQMs)
were utilized as features for our SVM, k-nearest
Neighbors, Random Forest, Decision Tree and Neu-
ronal Network classifiers.
4.2 AP2: Transfer Learning with CNN
Models
In our second approach (AP2), we fine-tuned CNN
models pre-trained on ImageNet (Deng et al., 2009)
for binary classification. We used ResNet and VGG
models, which have also been utilized in other stud-
ies to classify rail (Song et al., 2020) and steel (Abu
et al., 2021) defects and in which they also had to han-
dle light reflections. We additionally tested AlexNet
(Krizhevsky et al., 2017), and DenseNet (Huang et al.,
2017).
This approach employed standard machine learn-
ing techniques, including Binary Cross Entropy
(BCE) as loss function, Sigmoid as activation func-
tion, Early Stopping, StepLR as learning rate sched-
uler, and Adam as optimizer. For comparison, we ad-
ditionally froze the layers’ weights preceding our cus-
tom binary classification head during training.
This study fine-tuned ResNet-18, ResNet-34,
ResNet-50, ResNet-101, ResNet-152, VGG-11, VGG-
13, VGG-16, AlexNet and DenseNet-121.
We additionally utilized Grad-Cam (Selvaraju
et al., 2017), a visual neural network explanation
method, like Score-CAM (Wang et al., 2020) or LFI-
CAM (Lee et al., 2021), to provide heat maps high-
lighting regions of an image that are important for
classification.
5 RESULTS AND EVALUATION
In this study, true positives (T P) represent correctly
classified unacceptable bottle prints, and true nega-
tives (T N) represent correctly classified acceptable
bottle prints. It is also necessary to consider false pos-
itives (FP), where acceptable prints are incorrectly
Machine Learning in Industrial Quality Control of Glass Bottle Prints
267
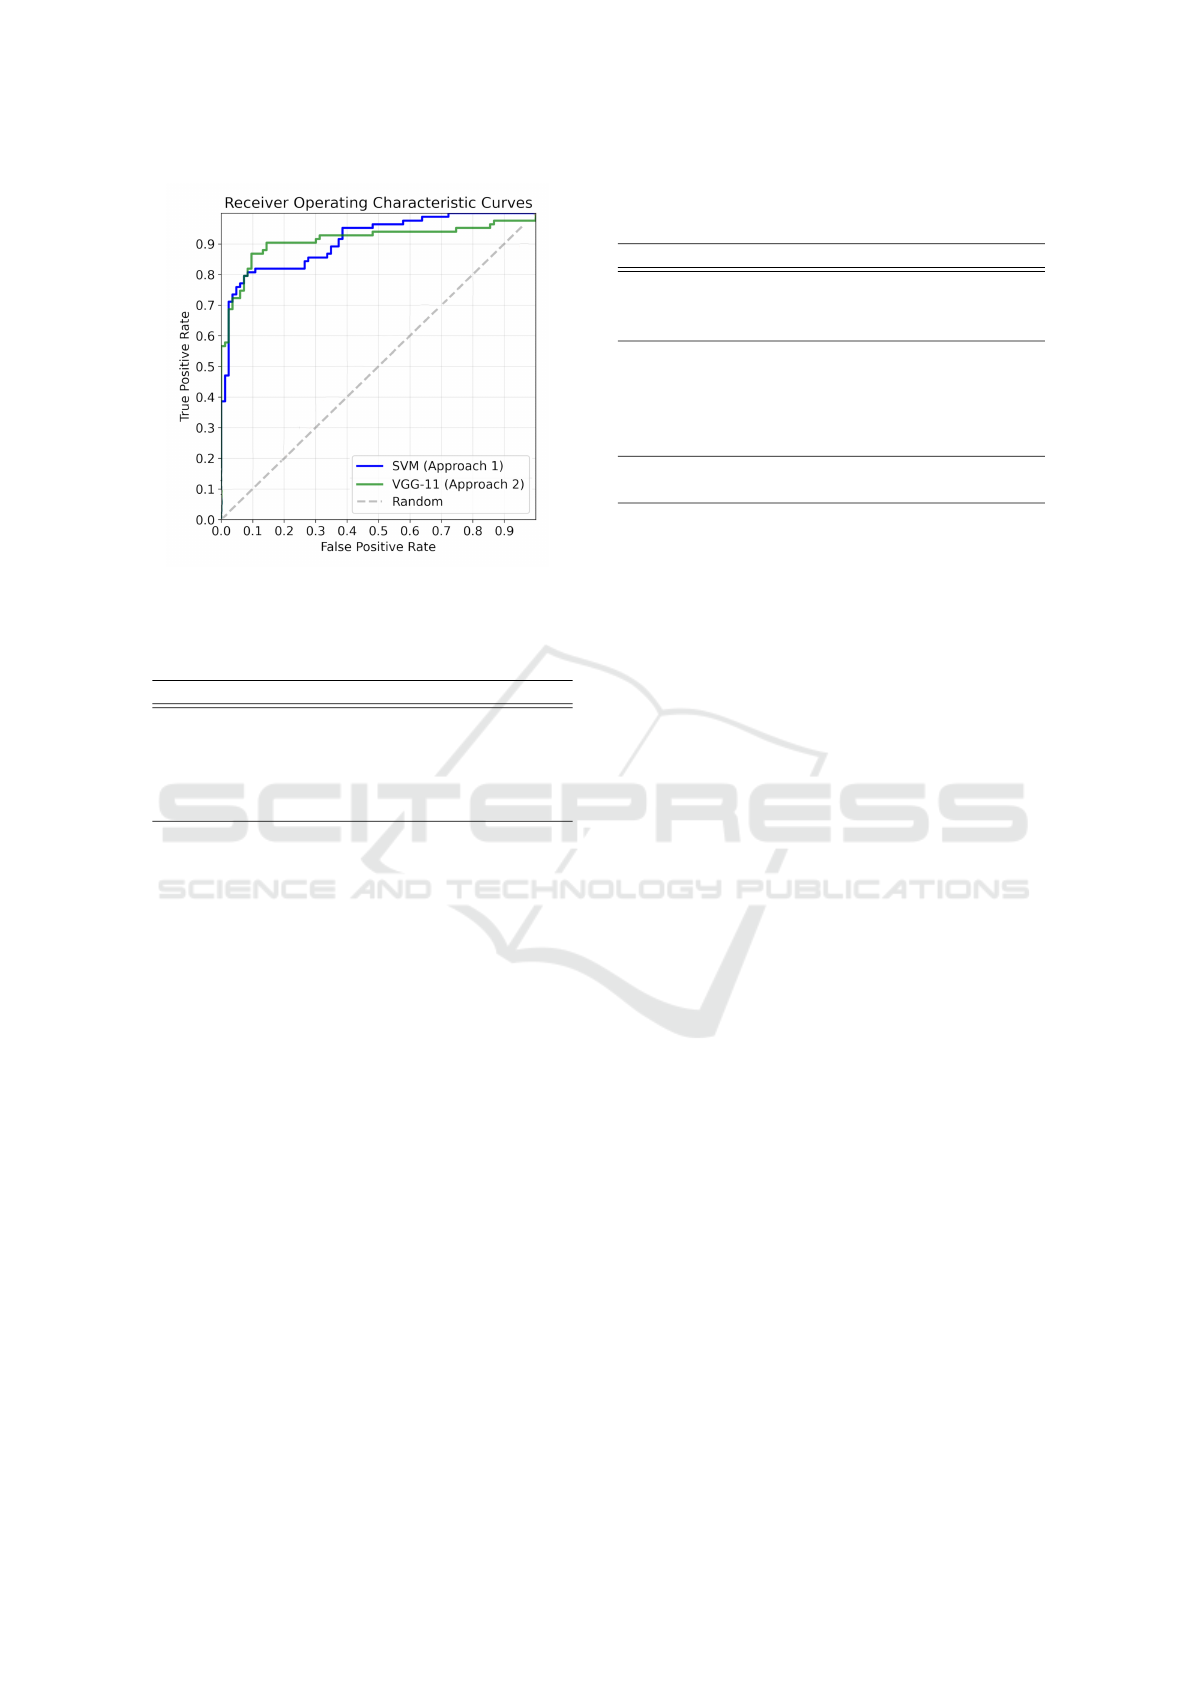
Figure 5: ROC Curves of our most accurate models: SVM
(AP1) and VGG-11 (AP2).
Table 1: Accuracy, T P, FP, TN and FN of our five super-
vised classifiers from AP1 (Section 4.1).
Classifier TP FP TN FN Accuracy
SVM 61 4 79 22 84.34%
k-NN 68 12 71 15 83.73%
Random Forest 67 13 70 16 82.53%
Decision Tree 71 18 65 12 81.93%
Neuronal Network 75 38 45 8 72.29%
classified as unacceptable, and false negatives (FN),
where unacceptable prints are incorrectly classified as
acceptable. It is advisable to utilize the true positive
rate (or sensitivity) for better interpretability and es-
pecially when the underlying class distribution is un-
balanced. The true negative rate is called specificity.
In addition to these metrics, we also includes receiver
operating characteristic (ROC) Curves to visualize the
trade-off between T P and FP rates across our classi-
fication thresholds, shown in Figure 5.
5.1 Baseline Approach
To train and evaluate our models, we relied on labels
provided by our QA experts. The currently used ap-
proach classified our images with an accuracy of 66%
(28 T P, 1 FP, 82 T N, 55 FN). The sensitivity is 34%,
and the false positive rate is 1%.
5.2 AP1: ORB, Filters, IQMs, and
Classifiers
As shown in Table 1, SVM achieved the highest accu-
racy of 84% in AP1, see Section 4.1. The sensitivity
is 73%, and the false positive rate is 5%. Figure 5
shows the ROC Curve of this model. Without align-
Table 2: Accuracy, T P, FP, T N and FN of our ten fine-
tuned CNN models from AP2 (Section 4.2).
Model TP FP TN FN Accuracy
VGG-11 70 8 75 13 87.35%
VGG-13 68 7 76 15 86.75%
VGG-16 70 9 74 13 86.75%
ResNet-18 65 9 74 18 83.73%
ResNet-34 67 8 75 16 85.54%
ResNet-50 57 6 77 26 80.72%
ResNet-101 58 4 79 25 82.53%
ResNet-152 62 4 79 21 84.94%
AlexNet 66 11 72 17 83.13%
DenseNet-121 63 8 75 20 83.13%
ing the images based on the ORB algorithm, the ac-
curacy decreased by 18% on average. The average
accuracy also decreased by 2% when colored images
(3 channels) were utilized for classification instead of
1 channel images. Mapping 3 channels into 1 channel
by a weighted sum of individual channels or utilizing
only the green channel of the images had no notice-
able effect on our models’ accuracy.
5.3 AP2: Transfer Learning with CNN
Models
As shown in Table 2, VGG-11 achieved the highest
accuracy of 87% in AP2, see Section 4.2. The sensi-
tivity is 84%, and the false positive rate is 10%. Fig-
ure 5 shows the ROC Curve of this model. Aligning
the images based on the ORB algorithm decreased
accuracy by 5% on average. We were unable to
train non-pre-trained ResNet and VGG models with
an average accuracy of 52%. We have too few im-
ages of defective prints to train such large models
from scratch. Training with frozen model weights de-
creased the average accuracy by 17%.
5.4 Insights for Manufacturing
Two methods we used to analyze our trained models
also seem suitable for optimizing the actual manufac-
turing process:
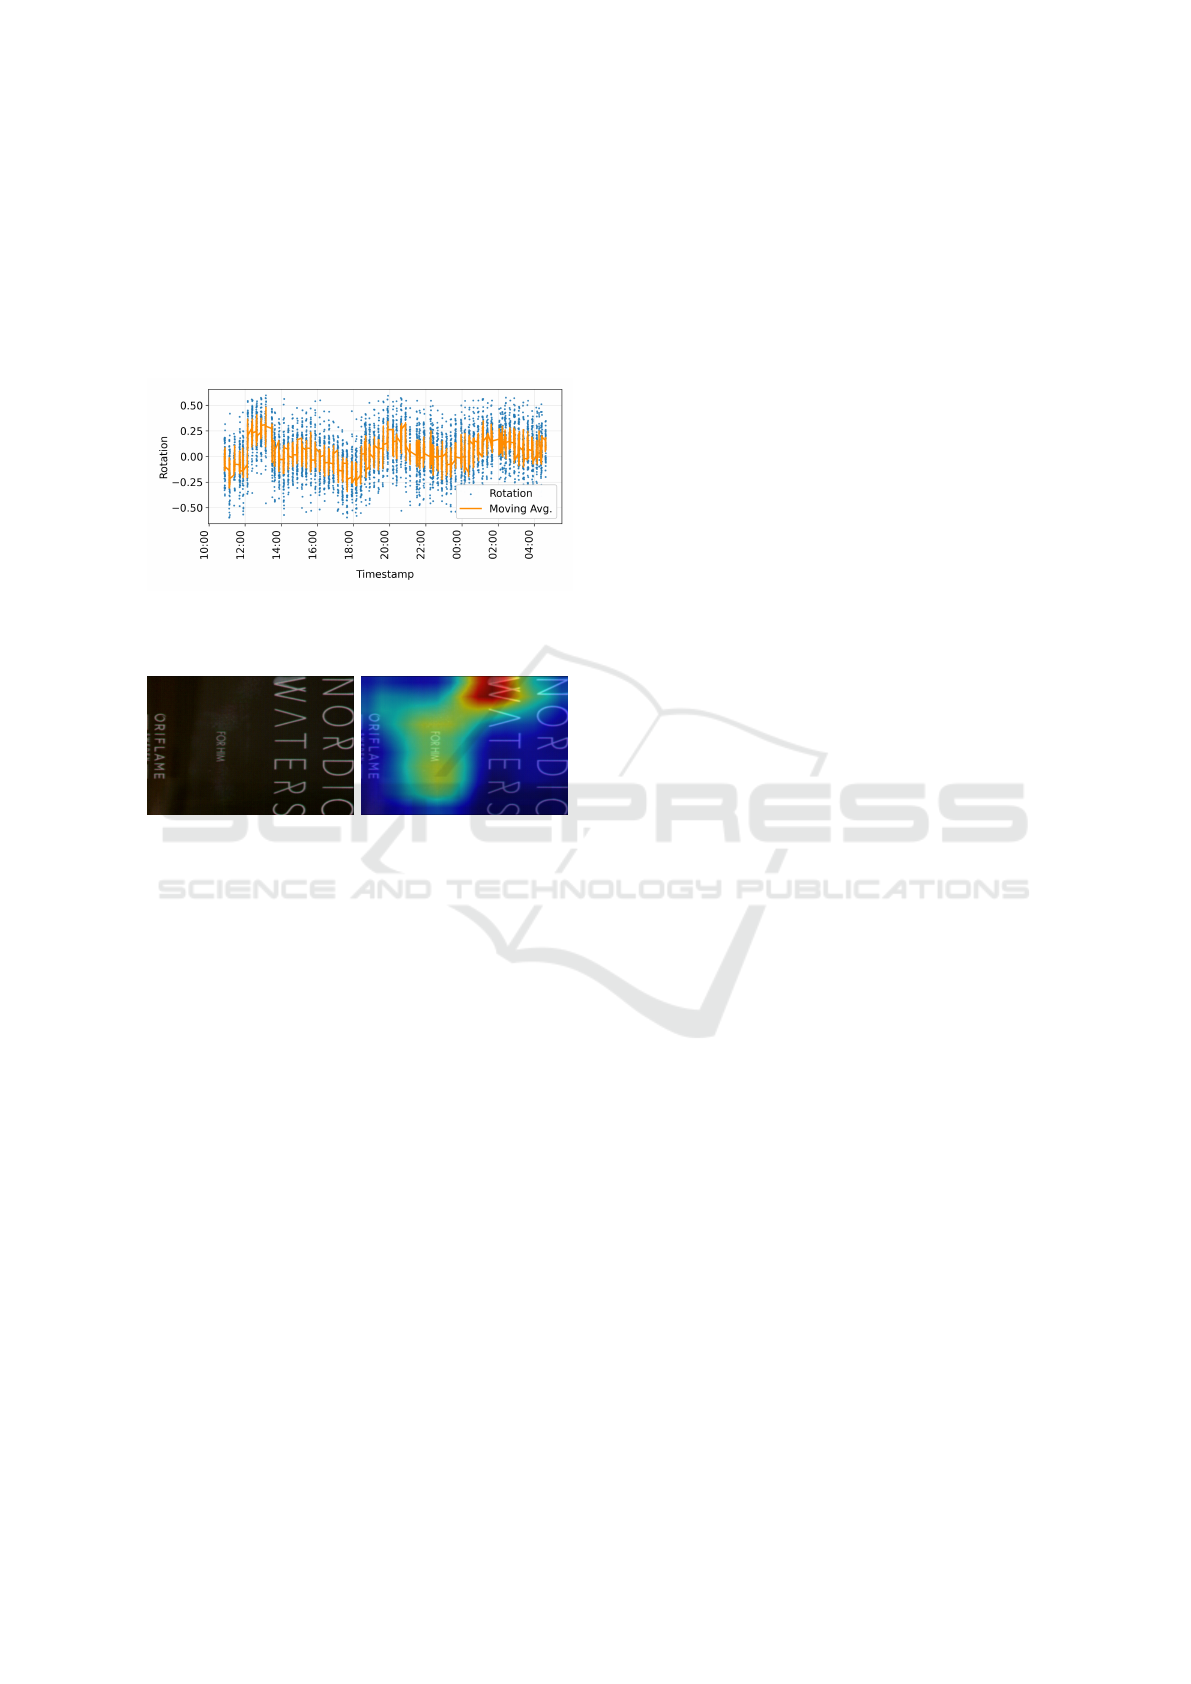
The rotation of an image related to a reference im-
age can be estimated by image alignment based on
the ORB algorithm. Over time, the rotations follow a
sinusoidal pattern, as shown in Figure 6. According
to our QA experts, this pattern can be explained by
manufacturing-related deviations. Ongoing anomaly
detection might be possible by monitoring deviations
from this expected pattern.
We also utilized Grad-Cam to provide heat maps
highlighting regions of an image important for classi-
fication for our fine-tuned CNN models. We observed
VISAPP 2024 - 19th International Conference on Computer Vision Theory and Applications
268
that heat maps from our fine-tuned ResNet-34 model
are correlated with the actual defects in an image. An
example is shown in Figure 7. By averaging the heat
maps across all images of unacceptable prints, we
were able to localize and visualize frequently defec-
tive bottle print regions. Therefore, it was possible to
identify spots where the print stencil in the production
line should be enhanced.
Figure 6: Estimated rotations based on ORB image align-
ment plotted over time. At about 12 o’clock, the print sten-
cil was replaced.
Figure 7: Grad-Cam visualization of our fine-tuned ResNet-
34 model: (left) original image of an unacceptable print and
(right) Grad-Cam heat map. These heat maps highlight re-
gions of an image that are important for classification. The
CNN model focused on this example’s smeared letter W.
6 DISCUSSION
In this Section, the results of our two approaches are
discussed separately. Following this, our approaches
are compared with the currently used classification
system and the requirements of the industrial appli-
cation. In the last Subsection, the limitations of our
methods are addressed.
6.1 AP1: ORB, Filters, IQMs, and
Classifiers
AP1 achieved an accuracy of 84%. This approach re-
lies on aligned images for meaningful classifications.
We observed that our classifiers are more accurate on
1 channel images than on 3 channels images. Uti-
lizing only green channels (1 channel images) of the
bottle print images is proposed to reduce computation
time and increase accuracy.
Although this approach is based on supervised
classifiers, it could also be interpreted as an anomaly
detection method due to our data preparation strategy:
These supervised classifiers are not trained to classify
images of unacceptable and acceptable prints directly.
Instead, they are trained on how much a bottle print
may differ from an acceptable reference bottle print
to be still classified as acceptable.
6.2 AP2: Transfer Learning with CNN
Models
AP2 achieved the highest accuracy of 87%. In con-
trast to AP1, the fine-tuned CNN models are able to
classify our images of the prints directly. This ap-
proach can be interpreted as replacing the fixed filters
with CNN-Convolutions. As a result, AP2 relies on
fewer potentially false assumptions than AP1.
Image alignment based on the ORB algorithm de-
creased the average accuracy of these CNN models.
The tested CNN models were pre-trained on colored
images (3 channels) without any applied filters. We
achieved the best accuracy with unaligned original
images of bottle prints and unfrozen model weights.
6.3 Industrial Application
The currently deployed approach classified our im-
ages with an accuracy of 66%. Compared to these
results, our two approaches correctly classified more
unacceptable prints (+51%), with a higher false pos-
itive rate (+8%) (AP2). This comparison is not par-
ticularly meaningful because the currently used ap-
proach is primarily influenced by various reflections
and misalignment, which is why a smaller compar-
ison window was chosen for the current approach.
This was necessary in order to be able to use the cur-
rently employed approach for classification in prac-
tice.
Our QA experts considered the sensitivities and
false positive rates of our two approaches as accept-
able for quality control. Further steps are required to
reduce the effort in the manual follow-up inspections
of incorrectly rejected acceptable bottles.
Our approaches proved robust against various re-
flections in our experiments. It was possible to mit-
igate the influence of reflections by applying filters
in AP1. Our tested image alignment method is not
strongly influenced by reflections due to the ORB
keypoint detection mechanism. Our fine-tuned CNN
models from AP2 proved robust against reflections
without additional steps.
All our approaches met the industrial application
time constraint of maximum 0.8s. Image preparation
and classification could be performed in about max-
Machine Learning in Industrial Quality Control of Glass Bottle Prints
269

imum 0.4s per image (tested on a NVIDIA GeForce
RTX 2080 Ti consumer graphic card).
6.4 Limitations
We were unable to copy every image during ongo-
ing production. It was also uneconomical to label ev-
ery image, so we opted for an unsupervised preselec-
tion. Therefore, our preselected images may not be
fully representative. We utilized empirical informa-
tion from our industry partner, such as the expected
proportion of unacceptable bottles, to improve our
preselection strategy.
AP1 relies on aligned images for accurate classi-
fication. The models may be unable to classify if the
bottle print was already rotated before alignment, in-
dicating an unacceptable print. This challenge could
be addressed by adding the alignment parameters as
features for classification. However, due to our dis-
continuous data collection and since only a few bot-
tles had rotated prints, we were unable to separate
process-related variations from the actual bottle print
rotations. Therefore, we were also unable to evaluate
our proposed method for anomaly detection based on
computed rotations.
We observed that image alignment decreased the
accuracy of our tested CNN models. Further research
is necessary to determine whether this is due to gen-
eral image alignment or the ORB algorithm’s use.
Our dataset is highly imbalanced and contains
only a few images of widely varying unacceptable
prints. Therefore, we relied on binary labels due to
the future application and these widely varying de-
fects.
7 CONCLUSION
We recommend AP2, utilizing fine-tuned CNN mod-
els, such as ResNet or VGG. We achieved the highest
accuracy of 87% with the help of VGG-11, see Sec-
tion 5.3. This approach has the highest accuracy of
our tested approaches and relies on minimal assump-
tions, which is less likely to lead to errors.
The tested CNN models proved robust against re-
flections without any additional steps. Utilizing our
fine-tuned ResNet-34 model and Grad-Cam, we were
able to localize and visualize spots where the print
stencil in the production line should be enhanced, see
Section 5.4.
Although we achieved a slightly lower accuracy
of 84% with models from AP1, methods of this ap-
proach offer some advantages: Selecting a specific
filter or IQM can help prioritize detecting certain de-
fects or reduce the influence of reflections, see Section
3.2. Although this approach is based on supervised
classifiers, it could also be interpreted as an anomaly
detection method, see Section 6.1.
We will rely on continuous data collection to im-
prove our approaches and evaluate our anomaly de-
tection method based on image rotations. With this
perspective, future work will focus on optimizing our
false positive rates and unsupervised methods.
ACKNOWLEDGEMENTS
We would like to thank our industry partner Ger-
resheimer AG for their cooperation and insight.
REFERENCES
Abu, M., Amir, A., Lean, Y., Zahri, N., and Azemi, S.
(2021). The performance analysis of transfer learning
for steel defect detection by using deep learning. In
Journal of Physics: Conference Series, volume 1755,
page 012041. IOP Publishing.
Bakurov, I., Buzzelli, M., Schettini, R., Castelli, M., and
Vanneschi, L. (2022). Structural similarity index
(ssim) revisited: A data-driven approach. Expert Sys-
tems with Applications, 189:116087.
Canny, J. (1986). A computational approach to edge de-
tection. IEEE Transactions on pattern analysis and
machine intelligence, (6):679–698.
Deng, J., Dong, W., Socher, R., Li, L.-J., Li, K., and Fei-
Fei, L. (2009). Imagenet: A large-scale hierarchical
image database. In 2009 IEEE conference on com-
puter vision and pattern recognition, pages 248–255.
Ieee.
Forcado, M. R. G. and Estrada, J. E. (2018). Model devel-
opment of marble quality identification using thresh-
olding, sobel edge detection and gabor filter in a mo-
bile platform. In 2018 IEEE 10th International Con-
ference on Humanoid, Nanotechnology, Information
Technology, Communication and Control, Environ-
ment and Management (HNICEM), pages 1–6. IEEE.
Gonzales, R. C. and Wintz, P. (1987). Digital image pro-
cessing. Addison-Wesley Longman Publishing Co.,
Inc.
Hossain, M. S., Al-Hammadi, M., and Muhammad, G.
(2018). Automatic fruit classification using deep
learning for industrial applications. IEEE transactions
on industrial informatics, 15(2):1027–1034.
Huang, G., Liu, Z., Van Der Maaten, L., and Weinberger,
K. Q. (2017). Densely connected convolutional net-
works. In Proceedings of the IEEE conference on
computer vision and pattern recognition, pages 4700–
4708.
Jain, A. and Bhateja, V. (2011). A full-reference image
quality metric for objective evaluation in spatial do-
VISAPP 2024 - 19th International Conference on Computer Vision Theory and Applications
270

main. In 2011 International Conference on Commu-
nication and Industrial Application, pages 1–5. IEEE.
Kaur, T. and Gandhi, T. K. (2019). Automated brain im-
age classification based on vgg-16 and transfer learn-
ing. In 2019 International Conference on Information
Technology (ICIT), pages 94–98. IEEE.
Krizhevsky, A., Sutskever, I., and Hinton, G. E. (2017). Im-
agenet classification with deep convolutional neural
networks. Communications of the ACM, 60(6):84–90.
Lee, K. H., Park, C., Oh, J., and Kwak, N. (2021). Lfi-cam:
Learning feature importance for better visual explana-
tion. In Proceedings of the IEEE/CVF International
Conference on Computer Vision, pages 1355–1363.
Luo, C., Yang, W., Huang, P., and Zhou, J. (2019).
Overview of image matching based on orb algorithm.
In Journal of Physics: Conference Series, volume
1237, page 032020. IOP Publishing.
Malaca, P., Rocha, L. F., Gomes, D., Silva, J., and Veiga, G.
(2019). Online inspection system based on machine
learning techniques: real case study of fabric textures
classification for the automotive industry. Journal of
Intelligent Manufacturing, 30:351–361.
¨
Ozt
¨
urk, S¸. and Akdemir, B. (2015). Comparison of edge
detection algorithms for texture analysis on glass pro-
duction. Procedia-Social and Behavioral Sciences,
195:2675–2682.
Quach, L.-D., Pham-Quoc, N., Tran, D. C., and Fadzil Has-
san, M. (2020). Identification of chicken diseases us-
ing vggnet and resnet models. In Industrial Networks
and Intelligent Systems: 6th EAI International Con-
ference, INISCOM 2020, Hanoi, Vietnam, August 27–
28, 2020, Proceedings 6, pages 259–269. Springer.
Rublee, E., Rabaud, V., Konolige, K., and Bradski, G.
(2011). Orb: An efficient alternative to sift or surf.
In 2011 International conference on computer vision,
pages 2564–2571. Ieee.
Sara, U., Akter, M., and Uddin, M. S. (2019). Image qual-
ity assessment through fsim, ssim, mse and psnr—a
comparative study. Journal of Computer and Commu-
nications, 7(3):8–18.
Selvaraju, R. R., Cogswell, M., Das, A., Vedantam, R.,
Parikh, D., and Batra, D. (2017). Grad-cam: Visual
explanations from deep networks via gradient-based
localization. In Proceedings of the IEEE international
conference on computer vision, pages 618–626.
Song, X., Chen, K., and Cao, Z. (2020). Resnet-based im-
age classification of railway shelling defect. In 2020
39th Chinese Control Conference (CCC), pages 6589–
6593. IEEE.
Sudo, H., Yukushige, S., Muramatsu, S., Inagaki, K.,
Chugo, D., and Hashimoto, H. (2021). Detection of
glass surface using reflection characteristic. In IECON
2021–47th Annual Conference of the IEEE Industrial
Electronics Society, pages 1–6. IEEE.
Tan, H. L., Li, Z., Tan, Y. H., Rahardja, S., and Yeo,
C. (2013). A perceptually relevant mse-based image
quality metric. IEEE Transactions on Image Process-
ing, 22(11):4447–4459.
Tkachenko, M., Malyuk, M., Holmanyuk, A., and Liu-
bimov, N. (2020-2022). Label Studio: Data label-
ing software. Open source software available from
https://github.com/heartexlabs/label-studio.
Villalba-Diez, J., Schmidt, D., Gevers, R., Ordieres-Mer
´
e,
J., Buchwitz, M., and Wellbrock, W. (2019). Deep
learning for industrial computer vision quality control
in the printing industry 4.0. Sensors, 19(18):3987.
Wang, H., Wang, Z., Du, M., Yang, F., Zhang, Z., Ding, S.,
Mardziel, P., and Hu, X. (2020). Score-cam: Score-
weighted visual explanations for convolutional neu-
ral networks. In Proceedings of the IEEE/CVF con-
ference on computer vision and pattern recognition
workshops, pages 24–25.
Zhou, X., Wang, Y., Xiao, C., Zhu, Q., Lu, X., Zhang, H.,
Ge, J., and Zhao, H. (2019a). Automated visual in-
spection of glass bottle bottom with saliency detection
and template matching. IEEE Transactions on Instru-
mentation and Measurement, 68(11):4253–4267.
Zhou, X., Wang, Y., Zhu, Q., Mao, J., Xiao, C., Lu, X.,
and Zhang, H. (2019b). A surface defect detection
framework for glass bottle bottom using visual atten-
tion model and wavelet transform. IEEE Transactions
on Industrial Informatics, 16(4):2189–2201.
Machine Learning in Industrial Quality Control of Glass Bottle Prints
271
