A Study on Drug Similarity Measures for Predicting Drug-Drug
Interactions and Severity Using Machine Learning Techniques
Deepa Kumari
a
, Antony Joseph K, Pranay Tarigopula, Rohith Kumar Gattu, Maithili Seemakurthi,
Subhrakanta Panda and Jabez Christopher
CSIS Department, BITS Pilani, Hyderabad Campus, Shameerpet, Hyderabad, India
Keywords:
Drug-Drug Interaction, Side-Effects, Similarity Measures, Machine Learning.
Abstract:
Drug-Drug interaction (DDI) can lead to adverse reactions by decreasing the absorption rate in a patient
body. The existing literature has limited focus on the impact of various similarity measures on DDI effects.
This paper analyzes seven drug features (chemical substructures, targets, transporters, enzymes, side-effects,
offsides, and carriers) obtained from Drugbank, Sider, TWOSIDES, and OFFSIDE databases to analyze DDI.
This research examines five Machine Learning models (Logistic Regression, Random Forest, Decision Tree,
KNN, ANN) on 16 different similarity measures to observe the performance of predicting samples through
accuracy and AUC-curve analysis. The Jaccard similarity is chosen for further DDI prediction as it gives the
best similarity score. The feature selection process (using Chi-Square) further reduces the time and space
complexity. It compares combinations of every selected feature (chemical substructures, side-effects, offsides,
enzymes) on Logistic Regression, Random Forest, and XGB classifiers. The results show that the Random
Forest Classifier predicts DDI with the best accuracy of 72%. It also uniquely categorizes the severity level of
side effects (minor, moderate, and major) due to DDI events through multi-class classification. Thus, it gives
a better clinical significance to fast-track the clinical trials.
1 INTRODUCTION
Drugs are critical in treating diseases and sustaining
healthy lifestyles (Huang et al., 2021). But drugs
can interfere with other drugs (called Drug-Drug In-
teraction (DDIs)) during treatment and cause serious
health complications (Seo et al., 2020). The occur-
rence of DDIs may lead to various Adverse Drug
Reactions (ADRs) that cause unavoidable detrimen-
tal consequences and high costs for health service
providers and hospitals (Liu et al., 2012) (Galeano
et al., 2020). However, the processes involved in
drug-drug interaction detection are costlier and time-
consuming but crucial for drug research and devel-
opment (Han et al., 2022) (Ferdousi et al., 2017).
The complex nature of DDIs makes them extremely
difficult to predict, while ADRs are expensive to di-
agnose and practically hard to treat. In drug devel-
opment and identification of DDIs, several computa-
tional approaches have successfully been used (Wu
et al., 2022).
The proposed approach is framed as a Drug-Drug
a
https://orcid.org/0000-0002-0696-9790
Figure 1: Drug -Drug Interaction with its severity levels
graph.
Interaction (DDI) prediction problem, where DDI
refers to the featured matrix network, M = {D, E, F}.
Here, D = {d
l
}
N
l=1
is the set of drugs, where l is the
number of N nodes. E ∈ {0, 1}
NXN
is the existence of
drug interactions, where a
mn
is an entry of matrix E
at the m
th
row and n
th
column, and shows an interac-
tion between drugs d
m
and d
n
. So, a
mn
= 1 indicates
the existence of interaction, and a
mn
= 0 denotes the
absence of interaction. F ∈ R
NXP
represents the drug
features matrix, where P is the dimension of the fea-
tures. f
i
∈ R
1XP
corresponds to the m
th
row of matrix
72
Kumari, D.
A Study on Drug Similarity Measures for Predicting Drug-Drug Interactions and Severity Using Machine Learning Techniques.
DOI: 10.5220/0012298300003636
Paper published under CC license (CC BY-NC-ND 4.0)
In Proceedings of the 16th International Conference on Agents and Artificial Intelligence (ICAART 2024) - Volume 3, pages 72-79
ISBN: 978-989-758-680-4; ISSN: 2184-433X
Proceedings Copyright © 2024 by SCITEPRESS – Science and Technology Publications, Lda.

E which is the feature vector of drug d
m
. With the
node feature matrix F and adjacency matrix E, this
research aims to study the following DDI prediction
problems.
• Binary DDI Prediction: The binary DDI predic-
tion is crucial to quickly ascertain whether an in-
teraction between a pair of drugs (d
m
, d
n
) exists
or not. It is useful in terms of computational re-
sources and time, especially when dealing with a
large number of drug pairs. Formally, it is to learn
a mapping from f
in
(d
m
, d
n
) to Interact
i j
∈ [0, 1].
Here, Interact
i j
indicates the interaction probabil-
ity of (d
m
, d
n
).
• Multi-class DDI side-effects Prediction: It is to
predict the specific interaction type of drug-pair
(d
m
, d
n
) based on drug interactions. Computation-
ally, it is to learn a mapping F : DXD ⇐⇒ S
D
,
where S
D
represents the degree of severity of side
effects.
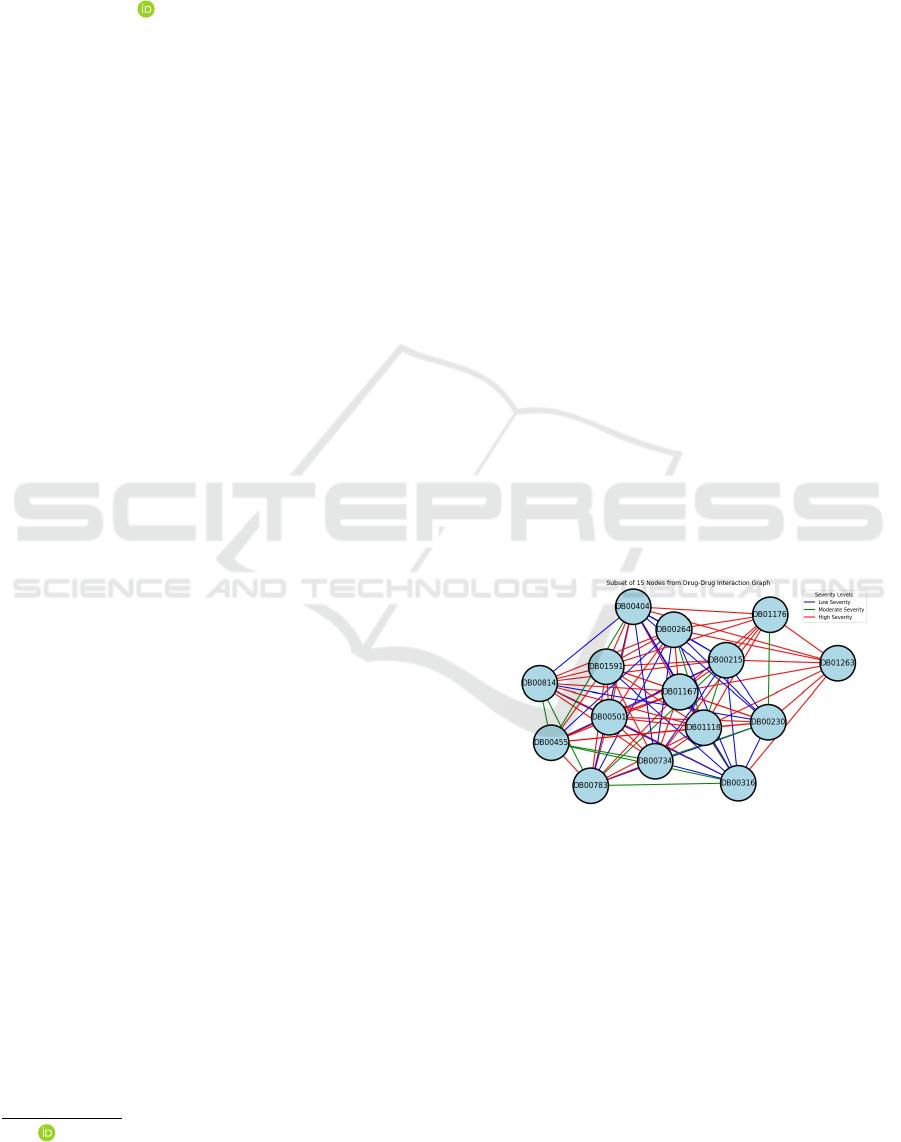
For a more transparent visual representation, Figure 1
presents a subset of 15 drugs depicted as nodes, along
with their corresponding interactions showcased as
edges. Their interaction severity is shown in 3 col-
ors: Blue for low, Green for moderate, and red for
high severity levels. For example, Figure 1 shows
that Drug ID DB00783 and DB00316 interact with
moderate severity, whereas Drug ID DB00361 and
DB01263 interact with high severity risks. Thus, this
paper offers valuable insights into potential risks and
their implications.
The organization of the remaining paper is as fol-
lows: Section 2 presents the Methodology. Section
3 explains the comparative analysis. Section 4 con-
cludes the work along with the future work.
2 METHODOLOGY AND
RESULTS
The proposed framework is implemented on a server
with 64 GB of RAM and Intel(R) Core(TM) i9-
7980XE CPU @ 2.60 GHz (18 Cores, 36 Threads).
The code is deployed on PyCharm version 3.5 and
uses Power BI packages. Figure 2 shows the work-
flow of the proposed framework.
2.1 Dataset
The proposed framework uses drug datasets from
DRUGBANK (version 5.1.9) (Wu et al., 2022),
SIDER (Seo et al., 2020), OFFSIDES, & TWOSIDES
(Tatonetti et al., 2012). It uses only approved drugs
containing biological, chemical, and phenotypic data.
Table 1: Performance of similarity measures.
Similarity Measures LR DT RF KNN NN
Bray 0.62 0.63 0.63 0.64 0.62
Dice 0.64 0.63 0.63 0.64 0.64
Jaccard 0.64 0.64 0.63 0.64 0.64
Hamming 0.56 0.60 0.61 0.58 0.55
Russel Rao 0.63 0.64 0.64 0.64 0.64
Faith 0.55 0.60 0.61 0.59 0.52
Gower 0.56 0.60 0.61 0.59 0.53
Sokal Michener 0.56 0.60 0.61 0.59 0.52
Ample 0.58 0.60 0.60 0.61 0.60
Anderberg 0.60 0.61 0.60 0.61 0.61
Baroni 0.63 0.63 0.63 0.64 0.63
Kulczynski 0.64 0.63 0.64 0.64 0.64
Goodman 0.61 0.61 0.61 0.61 0.61
Rogers Tanimoto 0.64 0.63 0.63 0.64 0.64
Yule 0.58 0.63 0.64 0.64 0.58
Inner Product 0.54 0.60 0.61 0.58 0.52
Biological data includes lists of drug-carrier
pairs, drug-target pairs, drug-enzyme pairs, and
drug-transporter pairs. These lists are the base to
construct a feature space corresponding to the four
types of binary fingerprints of the biological elements:
carrier, target, enzyme and transporter (Liu et al.,
2012). The length of the bit vectors for carrier, target,
enzyme, and transporter features is 78, 2856, 434, and
273, respectively.
Chemical data consists of 2D chemical struc-
tures of the same drug list considered the drug fea-
ture. Chemical substructure information is retrieved
from the PubChem database in SMILES (Simplified
Molecular Input Line Entry System) format using
MOE 2010.10 software. Then, MACCS (Molecu-
lar ACCess System) substructures are calculated with
166 key descriptor bits. This work used MACCS be-
cause of its availability in cheminformatics software
libraries or databases, and promising performance in
capturing relevant substructure information required
for predicting DDI (Ibrahim et al., 2021).
The phenotypic data of drugs are also essential
in predicting DDIs. Drug indications, side effects,
and offside effects construct the phenotypic data of
drugs. It extracts drug indications and side effects
from SIDER and offside effects from OFFSIDES.
The framework creates a comprehensive drug dataset
by merging and intersecting these diverse datasets.
2.2 Similarity Measures
Similarity measures are numerical quantities that
quantify the degree of association between pairs of
drugs and are considered a measure of similarity sim
i j
if, for every d
i
∈ D satisfies the following properties:
0 ≤ sim
i j
≤ 1 if i ̸= j, sim
i j
= 1, then sim
i j
= sim
ji
.
Even though numerous binary similarity measures ex-
ist in the literature, only a few similarity measures are
in use (Ibrahim et al., 2021) (Huang et al., 2021). Dif-
ferent similarity-based ML methods help predict DDI
through binary classification (Wu et al., 2022) (Vilar
A Study on Drug Similarity Measures for Predicting Drug-Drug Interactions and Severity Using Machine Learning Techniques
73
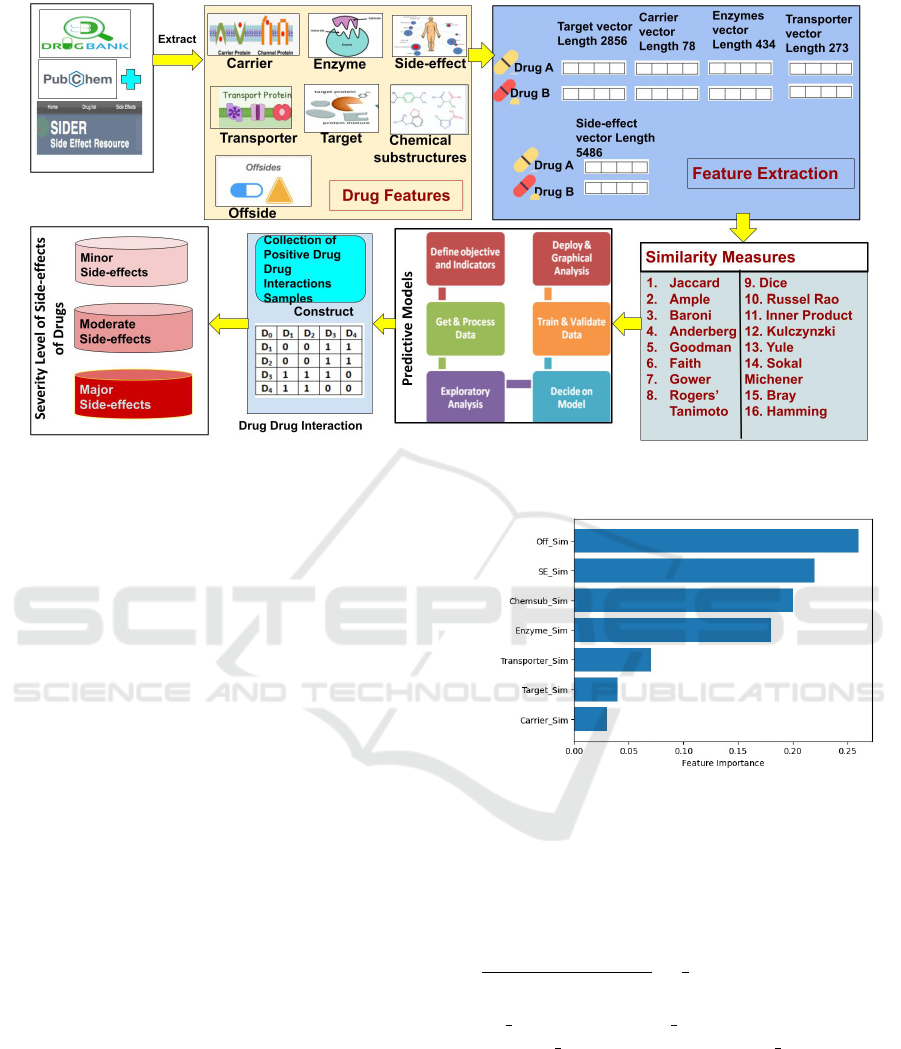
Figure 2: Workflow of Proposed Approach.
et al., 2014).
This paper implements 16 binary similarity mea-
sures for analyzing their performance on different
classifiers, as shown in Table 2. Where v
i
and v
j
←
are two row-vectors, each comprised of i and j
variables with a value of 1 (present) or 0 (absent).
p ← number of features where values for v
i
= 1 and
v
j
= 1
q ← number of features where values for v
i
= 0 and
v
j
= 1
r ← number of features where values for v
i
= 1 and
v
j
= 0
s ← number of features where values for v
i
= 0 and
v
j
= 0
σ ← observed agreement or similarity between two
sets of drug interactions
σ
′
← expected agreement to occur randomly between
two sets of drug interactions.
p+s ← total number of matches between v
i
and v
j
q+r ← total number of mismatches between v
i
and v
j
M ← Similarity values
The binary similarity determines the analysis
properties of the similarity and dissimilarity coeffi-
cients (de Albuquerque et al., 2022). The choice of
the correct coefficients and the variables depends on
the best performance of similarity measures on dif-
ferent classifiers, as shown in Table 1. Out of these,
the classifier that results in the highest performance is
chosen to predict the candidate side effects of drugs
as shown in Table 3.
Figure 3: Chi-square test on Features.
2.3 Drug-Drug Interactions (DDI)
This paper uses the Chi-square test, a simple tool
for univariate feature selection for classification. The
threshold calculation is based on the mean of the
summed chi-squared values for feature selection (i.e.
(
sum o f chi−squared values
Total number o f f eatures
=
1
7
= 0.14)). Figure 3 shows
that only four binary similarities values such as offside
(Off Sim), side effect (SE Sim), chemical substructure
(Chemsub Sim), and enzyme (Enzyme Sim) are above
the threshold.
Each Drug is coded into binary vectors by consid-
ering every bit as the association between two drugs
or not. If a drug is associated with another drug, the
corresponding bit becomes 1; otherwise, it is 0. Drug
similarities are evaluated based on DDI information
from DrugBank and the interaction information with
standard similarity calculation methods. Figure 4 in-
ICAART 2024 - 16th International Conference on Agents and Artificial Intelligence
74
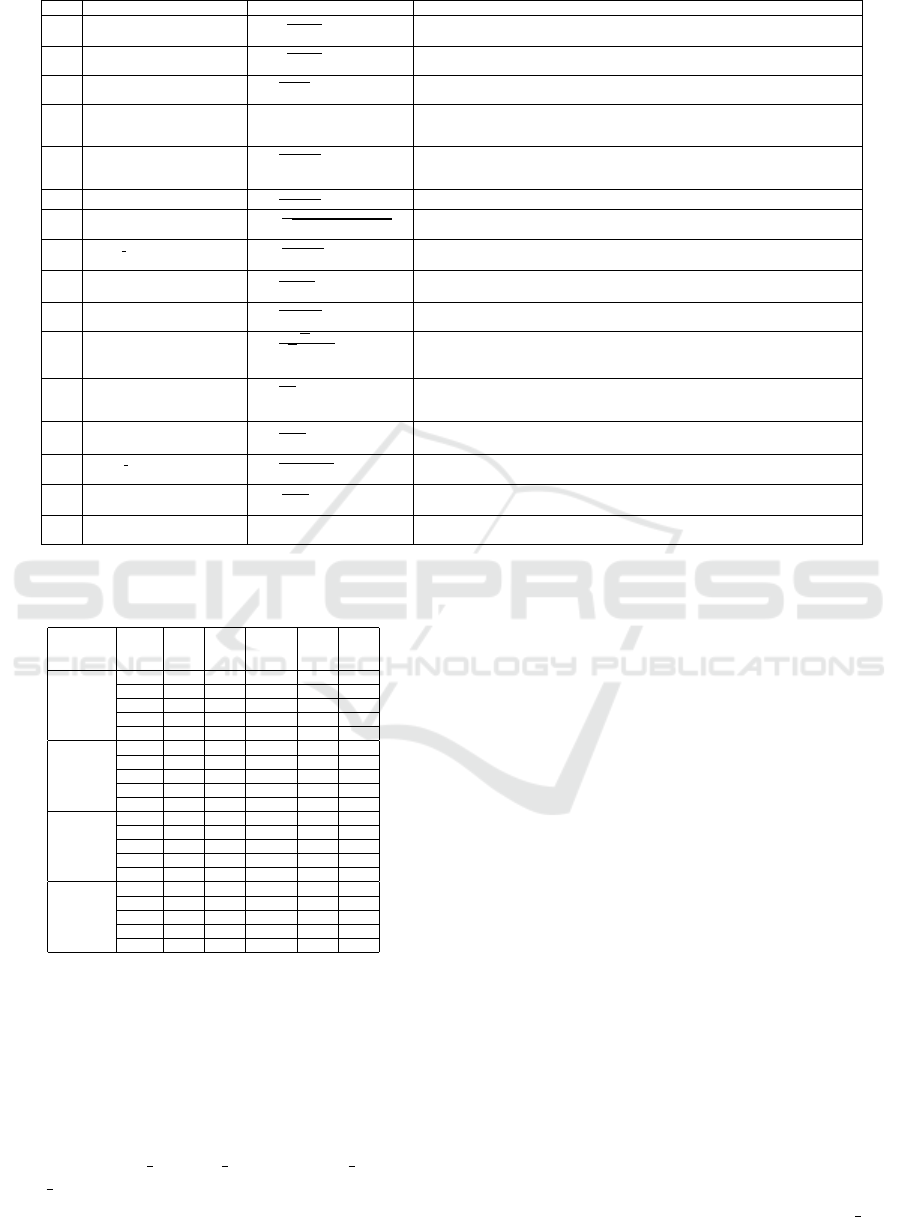
Table 2: Definitions of different Similarity Measures.
S.no. Similarity Measures Formulae Descriptions
1 Bray (Huang et al., 2021) M =
q+r
2p+q+r
Computes the compositional dissimilarity between the two sites based on counts at each
site.
2 Dice (de Albuquerque et al.,
2022)
M =
p
2p+q+r
Measures the similarity between two sets of data
3 Jaccard (de Albuquerque
et al., 2022)
M=
p
p+q+r
Check similarity of members for two sets to see which members are shared and which are
distinct. Computes similarity for the two sets of data, with a range from 0% to 100%.
4 Hamming (Huang et al.,
2021)
Distance = q + r Measures the number of equals components, divided by the length of vectors. Defines
the minimum number of substitutions needed to modify one string into the other, or the
minimum number of errors that could have converted one string into the other.
5 Russel Rao (de Albuquerque
et al., 2022)
M=
p
p+q+r+s
Dot-product-based similarity measure in a range between 0 (minimum similarity) and 1
(maximum similarity). Measures the similarity between drug interactions as it is a specific
and appropriate similarity measure with a 0 to 1 similarity range.
6 Faith (Huang et al., 2021) M=
p+0.5s
p+q+r+s
Feature and Information Theoretic measures parameterized ratio model of similarity.
7 Gower (Huang et al., 2021) M=
p+s
√
(p+q)(p+r)(q+s)(r+s)
Measures how different two records (including logical, categorical, numerical or text data)
are. The distance is always a number between 0 (identical) and 1 (maximally dissimilar).
8 Sokal Michener (de Albu-
querque et al., 2022)
M=
p+q
p+q+r+s
Measures the negative matches that do not mean necessarily any similarity between two
objects.
9 Ample (Huang et al., 2021) M=
|p(r+s)|
|r(p+q)|
Similar to absolute value of the Tarantula that has high correlation with chi-square based
measures
10 Anderberg (Huang et al.,
2021)
M=
p
p+2(q+r)
Measures handle similarity between categorical attributes. Assigns higher similarity to
rare matches, and lower similarity to rare mismatches
11 Baroni (Huang et al., 2021) M=
√
ps+p
√
ps+p+q+r
Selects compounds which exhibit a similar size distribution to the database. suitable for
compound selection to identify a wide structural variety of compounds but with a similar
distribution to the full database.
12 Kulczynski (de Albuquerque
et al., 2022)
M=
p
q+r
Measures the correlation between occurrences of two items, which is a fundamental con-
cept in the analysis of presence-absence data. Solves many pattern recognition problems
such as classification, clustering, and retrieval problems.
13 Goodman (Huang et al.,
2021)
M=
σ−σ
′
2k−σ
′
Measures the similarity of the orderings of the data when ranked by each of the quantities
and strength of association of the cross tabulated data.
14 Roger Tanimoto (de Albu-
querque et al., 2022)
M=
p+s
p+2(q+r)+s
Emphasize on the weight of the count of four states
15 Yule (Huang et al., 2021) M=
ps−qr
ps+qr
Defined as the coefficient of colligation. Measures association between two binary vari-
ables
16 Cosine of Inner product
(Huang et al., 2021)
M=p + s Measures the cosine of the angle between two vectors and determines whether two vectors
are pointing in roughly the same direction.
Table 3: Performance analysis of different similarity mea-
sures on different classifiers.
Similarity
Mea-
sures
Class-
ifiers
Acc-
uracy
Prec-
ision
Recall F1-
score
AUC
Jaccard
LR 0.64 0.64 0.65 0.64 0.68
DT 0.64 0.66 0.64 0.63 0.69
RF 0.63 0.65 0.64 0.64 0.70
KNN 0.64 0.65 0.65 0.64 0.69
NN 0.64 0.65 0.65 0.64 0.65
Russel Rao
LR 0.63 0.62 0.62 0.62 0.68
DT 0.64 0.66 0.65 0.64 0.69
RF 0.64 0.65 0.65 0.64 0.69
KNN 0.64 0.65 0.65 0.64 0.69
NN 0.64 0.65 0.65 0.64 0.64
Kulczynski
LR 0.64 0.66 0.65 0.64 0.69
DT 0.63 0.65 0.64 0.63 0.69
RF 0.64 0.65 0.65 0.64 0.69
KNN 0.64 0.65 0.65 0.64 0.69
NN 0.64 0.66 0.65 0.64 0.65
Tanimoto
LR 0.64 0.65 0.64 0.63 0.68
Rogers DT 0.63 0.65 0.64 0.63 0.69
RF 0.63 0.65 0.64 0.64 0.65
KNN 0.64 0.65 0.65 0.64 0.69
NN 0.64 0.65 0.64 0.64 0.51
fers that Jaccard gives better accuracy with Random
Forest than other similarity measures. Drugbanks
give 13910 extracted drugs with a total of 2682157
interactions. Of these, there are only 4107 approved
drugs, resulting in the total interactions dropping to
1889983. After filtering for duplicate interactions
(such as d
i j
and d
ji
), the total number of interac-
tions becomes 1341086. The common drugs with all
four features (Off Sim, SE Sim, Chemsub Sim, En-
zyme Sim) come down to 816 drugs, and the total
number of interactions becomes 260301.
The positive samples for 816 drugs are calculated
using the Jaccard similarity measure, where positive
interactions are 144282 and unlabeled interactions are
116019. Unlabeled drug interactions are labeled by
mapping drugs from the SIDER database. Thus, unla-
beled interactions are converted into negative and pos-
itive interactions. Here, 89835 interactions are con-
sidered negative samples, and 26184 are considered
positive. Hence, the total number of positive interac-
tions increased to 170466.
2.4 Predictive Models
Predictive models require little computation time and
supervision (Wu et al., 2022) (Kumari et al., 2023).
The performance of the models is compared us-
ing metrics such as accuracy, precision, recall, F1
score, AUC score and Mathews Correlation Coeffi-
cient (MCC). The proposed experiment follows 5-
fold cross-validation for a robust evaluation of the
model’s performance compared to a single train-test
split. Each fold contains an equal number of samples.
In each iteration, one fold is held out as the test set,
while the remaining four folds are combined to form
the training set. It mitigates the impact of the data’s
initial distribution and provides a more representative
estimate of the model’s ability to generalize unseen
data. Then, aggregated similarity matrices (Off Sim,
A Study on Drug Similarity Measures for Predicting Drug-Drug Interactions and Severity Using Machine Learning Techniques
75
SE Sim, Chemsub Sim, Enzyme Sim) are applied to
train the machine learning (ML) models. ML mod-
els such as Logistic Regression, Random Forest, and
XGB are tuned with their hyperparameter values to
achieve maximum learning process as shown in Ta-
ble 4. Here, the optimal parameter makes the learn-
ing process faster, and the learning rate helps achieve
minimum loss function and avoid underfitting scenar-
ios. It continues till the model reaches its conver-
gence. Thus, ML models achieve their best accuracy
by tuning their hyperparameters to the best set of pa-
rameter values (Rajita et al., 2023). Random forest
outperforms other models with an accuracy of 0.72
and an AUC score of 0.78 with a minimal set of four
features: offside, side-effect, chemical substructure,
and enzyme, as shown in Table 5.
2.5 Severity Level of Drugs Side-Effects
The multi-class classification process classifies the
severity of drug-drug interactions (DDIs) into three
classes – minor, moderate, and major. By focus-
ing on severity, healthcare professionals can prioritize
their actions and interventions, leading to improved
patient outcomes and better management of poten-
tial drug interactions. There are two approaches for
multi-class classification: One-vs-Rest and One-vs-
One techniques. This paper chooses the One-vs-Rest
strategy because it classifies data more efficiently and
faster. It splits a multi-class classification into one
binary classification problem per class using heuris-
tic methods where each classification model predicts
a class membership probability or a probability-like
score.
The frequency values and their corresponding
probability-like scores are collected from the TWO-
SIDES database. The argmax (probability) of these
scores (class index with the largest score) is then used
to predict a class. Thus, each frequency class fits a
mean reporting frequency in three percentage classes
[33%, 66%, 100%] to the predicted scores and obtains
a probability density function (pdf) for each class.
The pdfs built for each frequency class are the de-
fined boundaries for the classification decision with
maximum likelihood. The thresholds obtained are
0.00315, 0.0128, and 1. Thus, given a predicted score
x, a frequency class is chosen using the thresholds
given in Equation1:
pd f (x) =
minor if 0 ≤ x ≤0.00315
moderate if 0.00315 ≤x ≤0.0128
major if 0.0128 ≤ x ≤ 1
(1)
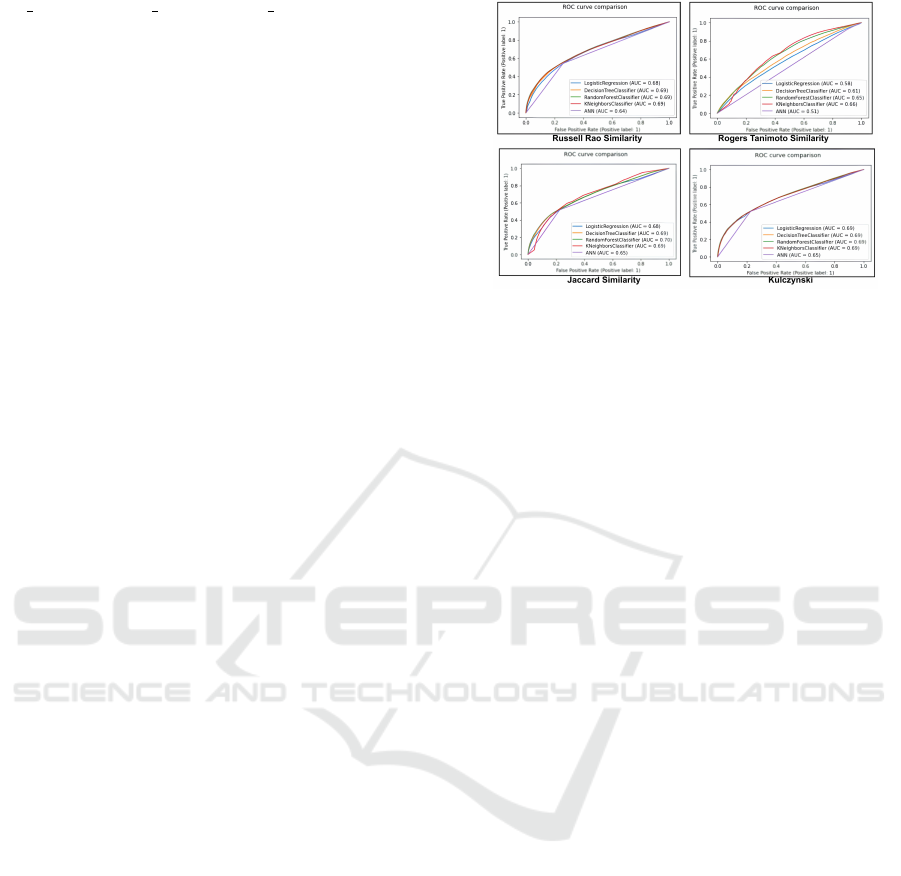
Table 6 infers that Drugid: DB00231 and DB00203
Figure 4: AUC for similarity measures on different classi-
fiers.
have an interaction frequency of 1 (minor) for three
symptoms (Arthralgia, diarrhea, and Headache). Sim-
ilarly, there are 170466 positive drug-drug interac-
tions and a total of 11676 symptoms due to differ-
ent interactions in the TWOSIDES database. The
DDI events obtained from the constructed dataset are
mapped with the TWOSIDES database. So, there
are 18263659 drug-drug interactions for all provided
symptoms in the constructed dataset. Table 7 presents
the total number of drug interactions in three classes:
minor, moderate, and major side-effect (symptom)
frequencies.
2.6 Result Analysis
This section presents a comparison of Logistic Re-
gression, Random Forest, and XGB (Extreme Gradi-
ent Boosting) classifiers to assess the impact of al-
gorithmic diversity on the predictive performance for
DDI. Where, Logistic Regression is a commonly used
baseline model due to its simplicity, but Random For-
est and XGB are more complex models known for
their ability to capture intricate patterns and relation-
ships. The comparison helps benchmark the perfor-
mance of more sophisticated models against a simpler
one to evaluate the trade-off between model complex-
ity and predictive accuracy. In this work, the exper-
iments are conducted up to three times, and the re-
ported values for each classifier are based on the aver-
age of these repetitions. This approach ensures a more
accurate representation of the classifiers’ performance
by minimizing the impact of random fluctuations.
Thus, the paper presents the performance of dif-
ferent Machine Learning Binary Classifiers employ-
ing four similarity measures using the AUC curve.
A higher AUC score indicates better discriminative
power and overall classifier performance. Figure 4
illustrates that the Random Forest model using the
ICAART 2024 - 16th International Conference on Agents and Artificial Intelligence
76
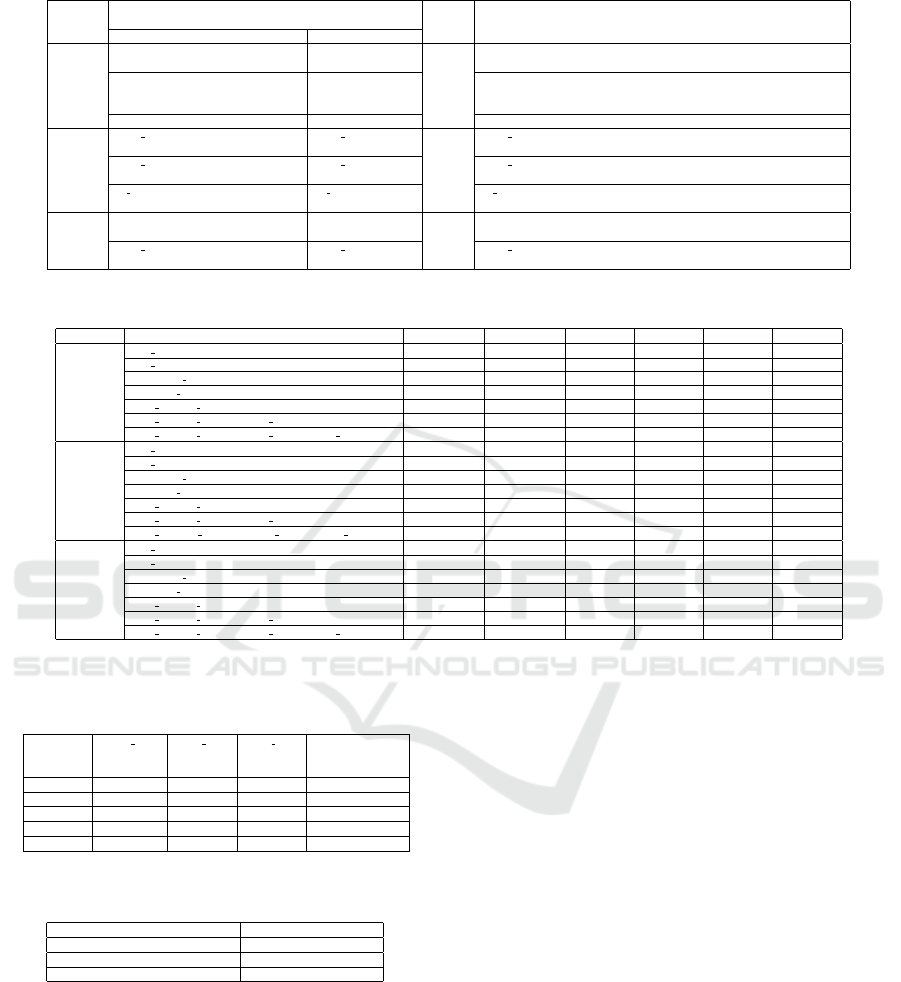
Table 4: Hyperparameters tuned with their initial and final values for different classifiers.
Classifier Hyperparameters Epochs Descriptions
Initial values Final Values
LR
C=[0.1,1,10] C=0.1 100 C is the regularization parameter. For a given value of C, the regularization
strength decreases.
Penalty=[l1, l2] Penalty= l2 Penalty determines the type of regularization applied to the logistic regres-
sion model. Regularization helps prevent overfitting by adding a penalty
term to the loss function.
Solver=[newton-cg, lbfgs, liblinear] Solver= liblinear Solver determines the algorithm to use for optimizing LR model.
RF
max depth=[30,50] max depth = 30 50 max depth controls the maximum depth of each decision tree in the Ran-
dom Fores
max features = [1,2,3,4] max features = [1] max features determines the maximum number of features to consider
when looking for the best split at each node of the decision tree.
n estimators = [100,250,500] n estimators = 500 n estimators represents the number of decision trees to be included in the
RF ensemble.
XGB
booster = [gbtree, dart] booster = gbtree 100 booster as gbtree provides strong predictive power and handles non-linear
relationships well.
max depth=[30,50] max depth=50 max depth determines the maximum depth of each decision tree in the
boosting process
Table 5: Performance analysis of combinational features for different classifiers.
Classifier features Accuracy Precision Recall F1-score AUC MCC
LR
off sim 0.66 0.61 0.56 0.55 0.66 0.37
SE sim 0.67 0.64 0.55 0.52 0.65 0.36
Chemsub sim 0.65 0.65 0.50 0.51 0.56 0.36
Enzyme sim 0.65 0.65 0.51 0.51 0.63 0.35
[off sim, SE sim] 0.67 0.63 0.59 0.58 0.69 0.40
[off sim, SE sim, Chemsub sim] 0.68 0.63 0.59 0.59 0.69 0.41
[off sim, SE sim, Chemsub sim, Enzyme sim] 0.68 0.65 0.63 0.64 0.72 0.44
RF
off sim 0.65 0.58 0.54 0.52 0.63 0.34
SE sim 0.64 0.57 0.54 0.52 0.58 0.34
Chemsub sim 0.62 0.52 0.51 0.48 0.52 0.33
Enzyme sim 0.65 0.50 0.50 0.49 0.63 0.32
[off sim, SE sim] 0.67 0.62 0.58 0.57 0.68 0.40
[off sim, SE sim, Chemsub sim] 0.70 0.67 0.61 0.61 0.73 0.46
[off sim, SE sim, Chemsub sim, Enzyme sim] 0.72 0.69 0.66 0.66 0.78 0.52
XGBoost
off sim 0.64 0.56 0.54 0.53 0.63 0.36
SE sim 0.66 0.60 0.54 0.52 0.60 0.35
Chemsub sim 0.64 0.53 0.51 45.5 0.52 0.33
Enzyme sim 0.65 0.50 0.50 0.46 0.63 0.32
[off sim, SE sim] 0.66 0.60 0.58 0.58 0.67 0.37
[off sim, SE sim, Chemsub sim] 0.68 0.64 0.62 0.63 0.70 0.43
[off sim, SE sim, Chemsub sim, Enzyme sim] 0.70 0.66 0.65 0.66 0.75 0.50
Table 6: Frequency of Side-Effects (symptoms) Induced by
Drug-Drug Interaction (DDI) Events.
Symptoms mean re-
porting
frequency
drug id1 drug id2 Predicted fre-
quency &
severity levels
Arthralgia 0.044872 DB00231 DB00203 1 (minor)
Arthralgia 0.071429 DB00887 DB00107 1 (minor)
Diarrhea 0.012821 DB00231 DB00203 1 (minor)
Diarrhoea 0.214286 DB00887 DB00107 1 (minor)
Headache 0.102564 DB00231 DB00203 1 (minor)
Table 7: Number of drug-drug interaction for different side-
effects based frequencies.
Severity Levels Number of interactions
Major (High Frequent=3) 5965100
Moderate (Moderately Frequent=2) 6053430
Minor (Less Frequent=1) 6245129
Jaccard similarity measure achieves a higher AUC
score than other similarity measures such as Kulczyn-
ski, Rogers Tanimoto, and Russell Rao. This supe-
riority is attributed to Jaccard’s capability to handle
binary data and capture the presence or absence of
shared features between instances. Consequently, it
effectively captures the similarities and differences,
improving classification performance. Moreover, the
ensemble nature of Random Forest and its ability to
mitigate overfitting contribute to its superior perfor-
mance when employing the Jaccard Similarity mea-
sure. Based on the overall performance in the given
machine learning models, the Jaccard coefficient is
taken to calculate the scoring function for drug sim-
ilarity. Consequently, datasets comprising positive
samples labeled as 1 and negative samples labeled as
0 are constructed using the Jaccard similarity matrix
as discussed in Section 2.3.
Random forest gives better accuracy of 72% with
selected 4 features (offside, side-effect, chemical sub-
structure, and enzyme) as shown in Table 5. This
combination of relevant features makes the model
more efficient than individual features alone. These
findings highlight the importance of feature selection
and its impact on model performance and resource
utilization. Figure 5 also shows an increase in the per-
formance of predictive models after feature selection.
The proposed framework also predicts the sever-
ity levels for the given DDI events. The approach
collects probability-like scores for frequency classes
from the TWOSIDES database, fits probability den-
sity functions to the scores, and uses thresholds to pre-
A Study on Drug Similarity Measures for Predicting Drug-Drug Interactions and Severity Using Machine Learning Techniques
77

Figure 5: Performance analysis of different classifiers be-
fore and after feature selection.
dict the severity level for given DDI events based on
the highest scoring class. The severity levels are cate-
gorized into different classes, and the predictions for
these classes are summarized in Table 6. Additionally,
Table 7 presents the total number of drug interactions
for each of the three frequency classes, providing fur-
ther insights into the drug data.
3 COMPARATIVE ANALYSIS
This section presents the comparison between the pro-
posed framework and other existing methods. Table
8 provides the details of the different types of tech-
niques along with the repositories for Biological (pro-
tein) data, Chemical data, and phenotypic (side effect)
data. It is observed that different methods use dif-
ferent datasets for the prediction process. No stan-
dard data set is available to compare the results of
various techniques. Thus, this paper compares the
overall efficiency of different methods, the issues ad-
dressed by them, and their limitations. The docking-
based approach predicts the side effects based on
the analysis of the alignment of the drugs with the
protein structures (Luo et al., 2011) (LaBute et al.,
2014). However, these methods do not depend on
experimental data that help identify novel and un-
expected interactions. But, network-based and ma-
chine learning-based approaches overcome the limi-
tations of docking-based approaches. The network-
based approach visualizes the drug features and their
interactions in a network and helps identify more in-
teractions and their side effects (Huang et al., 2013)
(Zhang et al., 2016). Also, the Machine learning ap-
proach (Liu et al., 2012) employs different classifiers
to address the prediction problem as in this work. It
is an automated intelligent approach that requires lit-
tle supervision and comparatively less comprehensive
data (Chen and Li, 2018). There is significance in
examining different similarity measures on machine
learning (ML) models instead of deep learning mod-
els. ML model lies in exploring and understanding
the effectiveness and applicability of other techniques
in solving the specific problem of drug-drug interac-
tion (DDI) analysis (Liu et al., 2012). ML models,
notably simpler algorithms such as decision trees or
random forests, often exhibit good generalization per-
formance and are easier to implement and deploy in
real-world applications. This practical applicability
makes them suitable for DDI analysis tasks where in-
terpretability and efficiency are crucial. They can han-
dle high-dimensional data efficiently, essential when
dealing with multiple similarity measures and fea-
tures.
4 CONCLUSIONS
This paper proposed an effective and robust frame-
work to predict the potential DDIs by utilizing the
drug properties (i.e., chemical, biological, and phe-
notype properties). This research compared 16 differ-
ent similarity measures on various machine learning
models, and the results show that the Jaccard sim-
ilarity measure performed better. Feature selection
further aided in DDI prediction with minimal fea-
tures. Jaccard similarity measure helped analyze pos-
itive and negative interactions for training the mod-
els. Thus, it detected unexpected side effects and
guided drug combinations. The proposed approach
is at relatively early stage to showcase the need for
Table 8: Comparative analysis of Existing methods with the Proposed approach.
References Type of technique Phenotypic Protein Drug Limitations
(Luo et al.,
2011)
Docking based FDA and AERS
information
UniPort Drugbank Complex Task as it involves the iterative molecular simulation of
3D structures of drugs proteins drugs .
(LaBute et al.,
2014)
Docking based SIDER PDB Drugbank No sufficient validation to infer the binding strength based on the
docking affinity score.
(Huang et al.,
2013)
Network based SIDER PubChem Drugbank Pathway-based models dependent on gene expression information
(Zhang et al.,
2016)
Network based SIDER PubChem KEGG and
Drugbank
Dependence on experimental data prevents the identification of
unexpected drug target bindings
(Liu et al.,
2012)
Machine learning
based
SIDER KEGG and Drug-
bank
PubChem The performance of the methods is limited to the diversity of com-
pounds in dataset, quality of descriptors etc.
(Zheng et al.,
2019)
Miscellaneous SIDER Gene ontology Drugbank The various parameters need to be specified every time.
Proposed ap-
proach
Machine learning
based
SIDER, TWO-
SIDES and
OFFSIDES
MACCS and
Drugbank
Drugbank The frequency of side-effects are constrained to the constructed
dataset.
ICAART 2024 - 16th International Conference on Agents and Artificial Intelligence
78

additional refinement in similarity measures. This
paper also proposed predicting the severity levels of
side effects through a multi-class classification ap-
proach. It classified drug interactions into minor (low-
frequency), moderate (medium-frequency), and ma-
jor (high-frequency) levels.
The authors aspire to develop more effective pre-
dictive models using Deep Learning methods, Re-
current Neural Network (RNNs) and their variations
which could significantly contribute to the evolution
of the reasearch work. Future work could also explore
the other existing research to perform comparison on
the same dataset for a more comprehensive evaluation
of model performance.
REFERENCES
Chen, H. and Li, J. (2018). Drugcom: Synergistic discovery
of drug combinations using tensor decomposition. In
2018 IEEE International Conference on Data Mining
(ICDM), pages 899–904. IEEE.
de Albuquerque, M. A., do Nascimento, E. R.,
de Oliveira Barros, K. N. N., and Barros, P.
S. N. (2022). Comparison between similarity coeffi-
cients with application in forest sciences. Research,
Society and Development, 11(2):e48511226046–
e48511226046.
Ferdousi, R., Safdari, R., and Omidi, Y. (2017). Compu-
tational prediction of drug-drug interactions based on
drugs functional similarities. Journal of biomedical
informatics, 70:54–64.
Galeano, D., Li, S., Gerstein, M., and Paccanaro, A. (2020).
Predicting the frequencies of drug side effects. Nature
communications, 11(1):4575.
Han, K., Cao, P., Wang, Y., Xie, F., Ma, J., Yu, M., Wang,
J., Xu, Y., Zhang, Y., and Wan, J. (2022). A review
of approaches for predicting drug–drug interactions
based on machine learning. Frontiers in Pharmacol-
ogy, 12:3966.
Huang, L., Luo, H., Li, S., Wu, F.-X., and Wang, J. (2021).
Drug–drug similarity measure and its applications.
Briefings in Bioinformatics, 22(4):bbaa265.
Huang, L.-C., Wu, X., and Chen, J. Y. (2013). Predicting
adverse drug reaction profiles by integrating protein
interaction networks with drug structures. Proteomics,
13(2):313–324.
Ibrahim, H., El Kerdawy, A. M., Abdo, A., and Eldin, A. S.
(2021). Similarity-based machine learning frame-
work for predicting safety signals of adverse drug–
drug interactions. Informatics in Medicine Unlocked,
26:100699.
Kumari, D., Yannam, P. K. R., Gohel, I. N., Naidu, M. V.
S. S., Arora, Y., Rajita, B., Panda, S., and Christo-
pher, J. (2023). Computational model for breast can-
cer diagnosis using hfse framework. Biomedical Sig-
nal Processing and Control, 86:105121.
LaBute, M. X., Zhang, X., Lenderman, J., Bennion,
B. J., Wong, S. E., and Lightstone, F. C. (2014).
Adverse drug reaction prediction using scores pro-
duced by large-scale drug-protein target docking on
high-performance computing machines. PloS one,
9(9):e106298.
Liu, M., Wu, Y., Chen, Y., Sun, J., Zhao, Z., Chen, X.-
w., Matheny, M. E., and Xu, H. (2012). Large-scale
prediction of adverse drug reactions using chemical,
biological, and phenotypic properties of drugs. Jour-
nal of the American Medical Informatics Association,
19(e1):e28–e35.
Luo, H., Chen, J., Shi, L., Mikailov, M., Zhu, H., Wang, K.,
He, L., and Yang, L. (2011). Drar-cpi: a server for
identifying drug repositioning potential and adverse
drug reactions via the chemical–protein interactome.
Nucleic acids research, 39(suppl 2):W492–W498.
Rajita, B., Tarigopula, P., Ramineni, P., Sharma, A., and
Panda, S. (2023). Application of evolutionary algo-
rithms in social networks: A comparative machine
learning perspective. New Generation Computing,
41(2):401–444.
Seo, S., Lee, T., Kim, M.-h., and Yoon, Y. (2020). Pre-
diction of side effects using comprehensive similarity
measures. BioMed research international, 2020.
Tatonetti, N. P., Ye, P. P., Daneshjou, R., and Altman,
R. B. (2012). Data-driven prediction of drug ef-
fects and interactions. Science translational medicine,
4(125):125ra31–125ra31.
Vilar, S., Uriarte, E., Santana, L., Lorberbaum, T., Hripc-
sak, G., Friedman, C., and Tatonetti, N. P. (2014).
Similarity-based modeling in large-scale prediction of
drug-drug interactions. Nature protocols, 9(9):2147–
2163.
Wu, L., Wen, Y., Leng, D., Zhang, Q., Dai, C., Wang, Z.,
Liu, Z., Yan, B., Zhang, Y., Wang, J., et al. (2022).
Machine learning methods, databases and tools for
drug combination prediction. Briefings in bioinfor-
matics, 23(1):bbab355.
Zhang, W., Zou, H., Luo, L., Liu, Q., Wu, W., and Xiao, W.
(2016). Predicting potential side effects of drugs by
recommender methods and ensemble learning. Neu-
rocomputing, 173:979–987.
Zheng, Y., Peng, H., Ghosh, S., Lan, C., and Li, J. (2019).
Inverse similarity and reliable negative samples for
drug side-effect prediction. BMC bioinformatics,
19(13):91–104.
A Study on Drug Similarity Measures for Predicting Drug-Drug Interactions and Severity Using Machine Learning Techniques
79
