Synthetic Data-Driven Approach for Missing Nut and Bolt Classification
in Flange Joints
Frankly Toro
a
, Hassane Trigui
b
, Yazeed Alnumay
c
, Siddharth Mishra
d
and Sahejad Patel
e
Aramco, Thuwal, Saudi Arabia
Keywords:
Asset Integrity, Flange Joints, Missing Bolt/Nut, Missing Nut, Multi-View CNN, Synthetic Data, Domain
Adaptation, Image Classification, Grad-CAM.
Abstract:
Inspection of bolted flange joints is a routine procedure typically done manually in process-based industries.
However, this is a time-consuming task since there are many flanges in a typical operational facility. We
present a computer vision-based tool that can be integrated into other systems to enable automated inspection
of these flanges. We propose a multi-view image classification architecture for detecting a missing bolt or
nut in a flange joint image. To guide the training process, a synthetic dataset with 60,000 image pairs was
created to simulate realistic environmental conditions of flange joints. To demonstrate the effectiveness of
our approach, an additional real-world dataset of 1,080 flange joint image pairs was manually collected. The
proposed approach achieved remarkable performance in classifying missing bolt instances with an accuracy
of 95.28% and 95.14% for missing nut instances.
1 INTRODUCTION
Flanges are commonly found in the energy industry to
connect joints of pipelines with piping or plant equip-
ment (Xue et al., 2019). These flanges are typically
bolted together according to relevant standards to en-
sure the safe and reliable operation of the facilities.
Fluctuations in thermodynamic parameters, pressure
shocks, process upset, or other environmental phe-
nomena can potentially disrupt the integrity of the
flange joints, causing leaks and possibly leading to
catastrophic disasters (Saad et al., 2022). To mitigate
this, engineering departments develop inspection and
maintenance protocols that govern the operation and
maintenance of these flanges. These typically include
periodic visual surveillance of flanges and taking cor-
rective actions as needed.
One of the most critical components, particularly
noted by maintenance personnel during an inspec-
tion, are the bolts and nuts, as most common flange
anomalies are attributed to their dysfunction. Ap-
propriate bolt torque is essential, as inaccurate bolt
a
https://orcid.org/0000-0003-2379-7019
b
https://orcid.org/0009-0002-5487-6326
c
https://orcid.org/0000-0002-2475-8719
d
https://orcid.org/0009-0002-8026-0242
e
https://orcid.org/0000-0002-3824-9763
Training Missing bolt Missing nut
View 1View 2
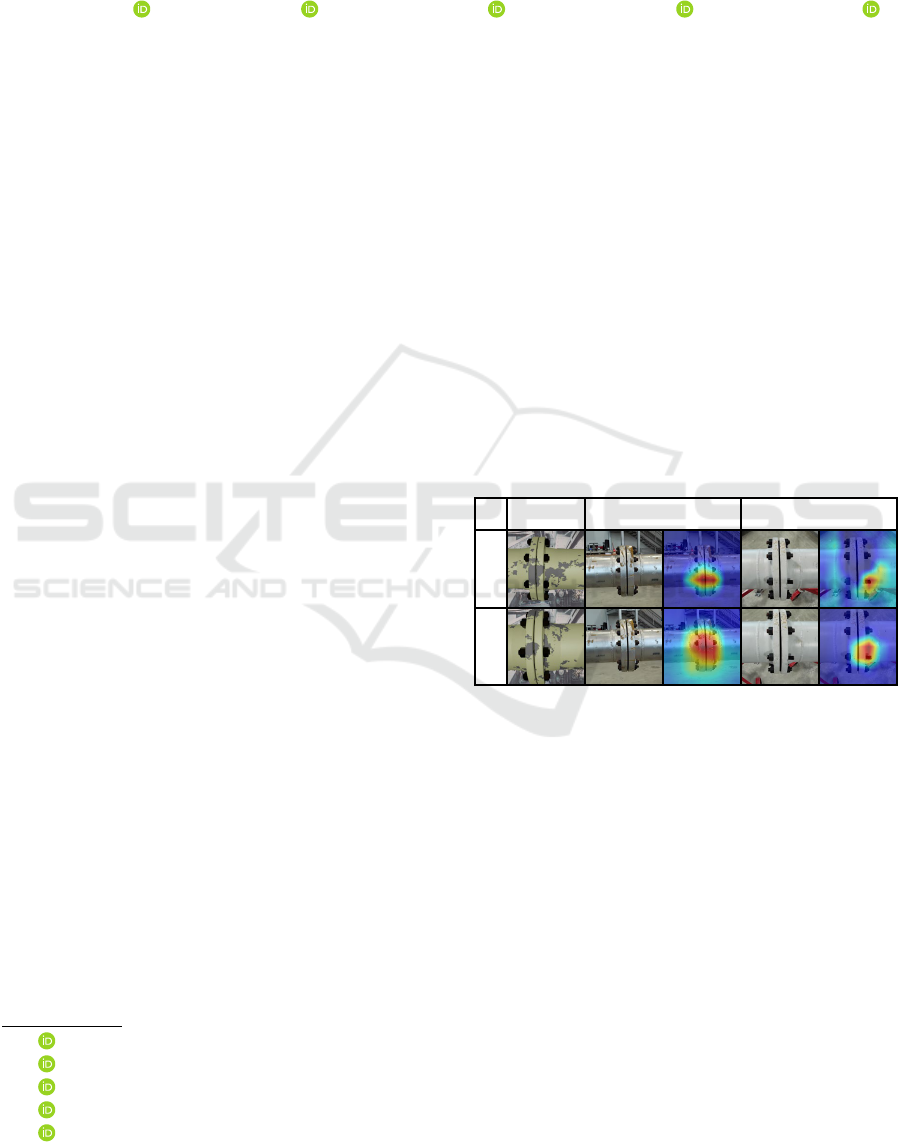
Figure 1: Sample Results. Our model uses two images
of a flange from different perspectives to determine if a
bolt or nut is missing. The model is trained on syntheti-
cally generated data. A real flange sample for each anomaly
type is shown with two views, and GradCAM visualizes the
model’s focus on the anomaly.
forces can lead to failure in the sealing of flange
faces, causing leaks (Zhang et al., 2015). Typi-
cal bolt and nut related anomalies include: missing
bolts/nuts, loose bolts/nuts, short bolting, and long
bolting (ASME, 2019). These anomalies are typi-
cal after a major turnaround and inspection (T&I),
where flanges are completely opened and maintained,
wherein bolts or nuts are either missed or incorrectly
installed. However, manually monitoring and inspect-
ing flanges is time-consuming, considering the large
number of flanges in a typical operational facility. As
such, there is a need for an automated or more ef-
ficient inspection method for ensuring the complete
Toro, F., Trigui, H., Alnumay, Y., Mishra, S. and Patel, S.
Synthetic Data-Driven Approach for Missing Nut and Bolt Classification in Flange Joints.
DOI: 10.5220/0012271500003660
Paper published under CC license (CC BY-NC-ND 4.0)
In Proceedings of the 19th International Joint Conference on Computer Vision, Imaging and Computer Graphics Theory and Applications (VISIGRAPP 2024) - Volume 2: VISAPP, pages
301-308
ISBN: 978-989-758-679-8; ISSN: 2184-4321
Proceedings Copyright © 2024 by SCITEPRESS – Science and Technology Publications, Lda.
301

assembly of flanges with no missing parts to achieve
the required integrity and process safety of flanges.
With the advancement of digitalization and Indus-
trial Revolution (IR) 4.0, the oil and gas (O&G) indus-
try is also going through a digital transformation ef-
fort (Wanasinghe et al., 2021). Accordingly, we pro-
pose a tool for automated visual inspection of flanges
and define a computer vision-based pipeline that al-
lows detecting anomalies on flange images, such as
missing bolts and missing nuts from varied view-
points. The scope of this paper is specifically targeted
toward detecting a missing bolt or nut, as it serves as
the first sanity check for flange integrity and its suc-
cessful assembly. Due to the scarcity of real-world
images, our method focuses on developing a robust
model that can generalize well with real-world data
while being trained on generated synthetic flange im-
age data.
The generation of synthetic data using 3D mod-
eling software was focused on creating a balanced
dataset of representative flange images by randomly
augmenting flange and scene conditions from various
viewpoints. We artificially augmented 60,000 image
pairs of training data using multiple spatial and pixel
augmentations to train our proposed multi-view archi-
tecture. We validate the performance of the proposed
method on real-world flanges with varying diameters:
8, 16, and 20 inches.
Our paper brings forth three major contributions:
i) We introduce a 3D model for simulating flanges
that can render images at various orientations, light-
ing, and spatial conditions. ii) We propose a multi-
view image classification architecture for identifying
a missing bolt or nut in a flange joint image. iii) We
create a real-world dataset with 1,080 pairs of flange
images divided into three balanced classes (healthy,
missing nut, and missing bolt) manually captured and
labeled for the test dataset.
2 RELATED WORK
The flange maintenance and integrity surveying pro-
cess involves various inspection tasks. These inspec-
tions mostly revolve around bolt and nut integrity, as
they are critical elements that hold the flange faces
together with appropriate forces.
Contact-based solutions are typically used for bolt
looseness detection (Nikravesh and Goudarzi, 2017;
Wang et al., 2013) and include direct measurements
using devices, such as strain gauges, or indirect meth-
ods of looseness detection, such as measuring vibra-
tions and ultrasonic-based methods. These traditional
techniques require manual operation and direct con-
tact with the bolts. Therefore, they are costly and im-
practical for elevated and hard-to-reach flanges.
In addition to contact-based methods, academic
research has leveraged computer vision algorithms for
analyzing bolt tightness through bolt rotation detec-
tion. The framework of these methods can be gen-
erally classified into two main categories: classical
computer vision and deep learning (DL). These solu-
tions often aim to detect and quantify changes in the
rotational orientation of bolts over time. The classi-
cal approaches (Park et al., 2015; Cha et al., 2016;
Hongjian et al., 2015) perform perspective transforms
to align the bolts, followed by a Hough transform line
detection algorithm to detect rotations in the hexago-
nal screw heads.
On the other hand, while deep learning ap-
proaches still seek to assess the rotational movements
of bolt heads over time, they employ a range of dis-
tinct techniques to achieve this goal. (Wang et al.,
2019) uses handwritten digits on the bolts to detect
and adjust for rotations by training on the MNIST dig-
its dataset (Deng, 2012). Additionally, DBSCAN is
used on the detected bolts to detect rotations. (Zhao
et al., 2019) uses Single Shot MultiBox Detectors to
infer rotations. Finally, (Sun et al., 2022) uses two
colored markers on the bolt and the YOLOv5 object
detection network to determine the bolt rotation.
These computer vision methods rely on rotation to
measure bolt tightness but require a secure baseline
image, which is often unavailable. In addition, frontal
images of flanges are required, which can be more
difficult to obtain than side images, particularly for
elevated flanges.
Previous models for detecting missing bolts have
been developed (Alnumay et al., 2022). However,
their training set lacked diversity in flange types and
was relatively small. Additionally, these models re-
lied on a basic architecture, which restricted their per-
formance. As a result, these models achieved higher
testing accuracies only when tested on real images
that closely matched the characteristics seen during
training with a single model backbone. Furthermore,
it is important to note that the real testing dataset used
in their experiments was limited, comprising only 36
images. Consequently, when tested on our extensive
real-image test dataset, these models demonstrated
reduced classification accuracies, averaging around
65%.
In this paper, we tackle the fundamental problem
of detecting a missing bolt or nut, as they are the first
step towards a successful flange inspection. Unlike
most previous work, our method requires no prior in-
tervention or markings on the flange. Additionally, it
is robust to various types of bolts and nuts.
VISAPP 2024 - 19th International Conference on Computer Vision Theory and Applications
302
Healthy Missing bolt Missing nut
View 1
View 2
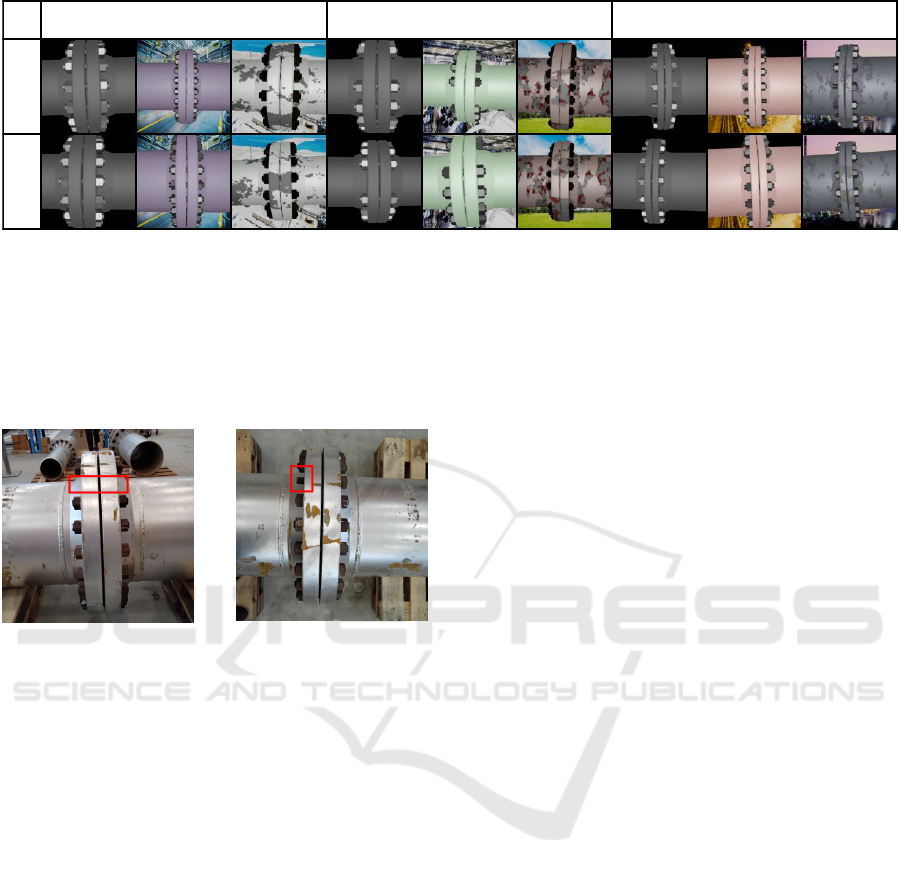
Figure 2: Synthetic Image Samples. Pairs of images representing each of the three classes within our training dataset. The
synthetic images, generated using Blender, exhibit variations in size, paint, rust, and camera perspective, corresponding to
different dataset versions. Here, we present three distinct dataset versions.
3 FLANGE ANOMALY
DETECTION METHOD
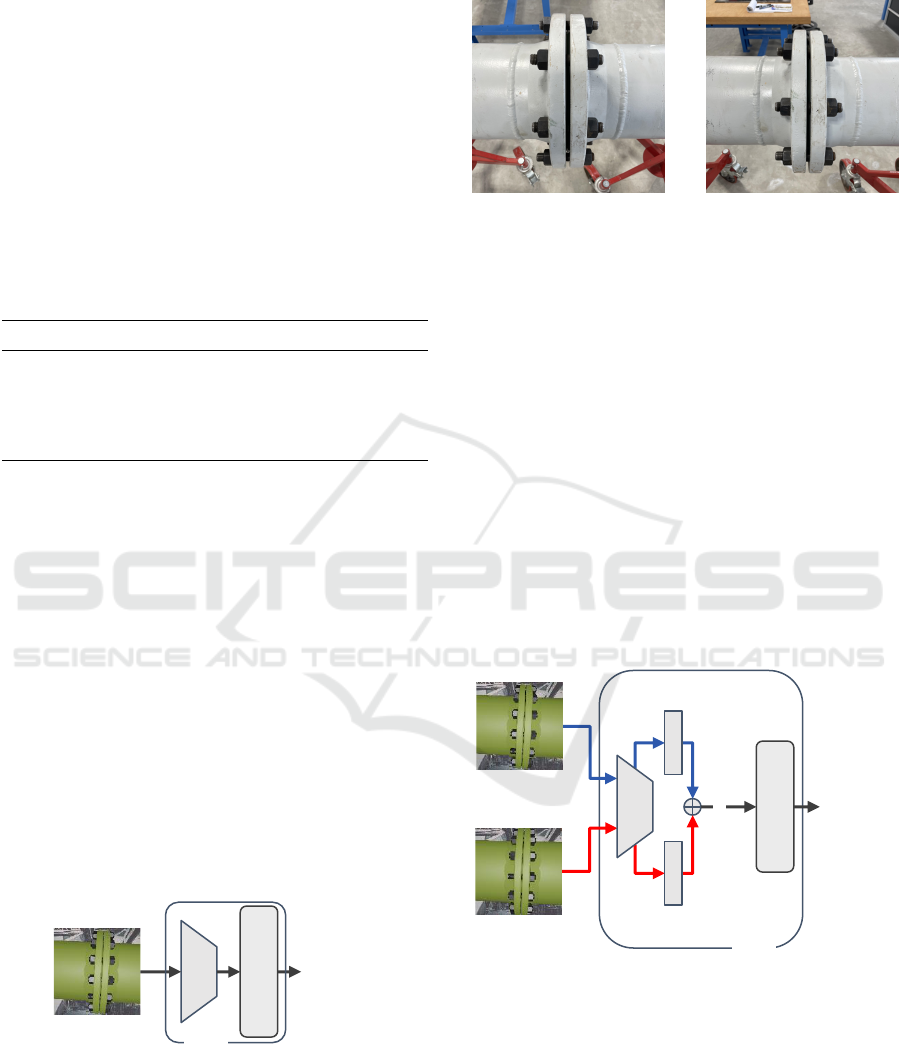
(a) Missing bolt
(b) Missing nut
Figure 3: Anomaly examples.
The model development process is divided into two
stages. First, generate synthetic training data. Sec-
ond, fine-tuning an image classification network pre-
trained on ImageNet (Deng et al., 2009). The initial
stage generates synthetic flanges from 3D models to
produce surrogate training data. The second compo-
nent outlines the Deep Learning (DL) Network archi-
tecture for image classification using single and multi-
ple flange views as inputs. The goal of this network is
to identify whether a given image or a pair of images
of a flange joint has a missing nut or bolt. Examples
of such anomalies are shown in Figure 3
3.1 Synthetic Data Generation
Training an effective deep learning model typically
requires large labeled datasets. However, obtaining
sufficient images of flanges with varying sizes, mate-
rials, environments, and anomaly locations is labor-
intensive. Therefore, our method relies on generating
labeled synthetic images to create our training set.
Our synthetic images were generated using the
open-source 3D modeling and animation software
Blender (Blender, 2018). We designed a 3D model
of a flange joint that enables us to control some ba-
sic visual characteristics, such as standardized di-
mensions following the ASME 16.5 specifications
(ASME, 2020), paint color, background, rust, bolt,
and nut color.
Blender’s flexibility enables the generation of var-
ious flange joints by adjusting physical parameters
and camera settings and simulating ground truth val-
ues to train supervised deep learning models.
We developed a Blender script to randomly sam-
ple parameters for the camera, flange dimensions, and
anomaly locations. The script renders pairs of images
for each flange and records the ground-truth class la-
bel. A sample of this dataset is shown in Figure 2.
The resulting synthetic dataset contains 60,000 image
pairs, with 20,000 pairs for each of the three classes:
healthy, missing bolt, and missing nut. The synthetic
data was split into a proportion of 60/20/20 for train-
ing/validation/testing.
The diversity and realism of synthetic datasets
considerably impact model performance. In our ini-
tial models, we generated basic and untextured flange
renders without background. These models produced
high-accuracy results when applied to synthetic data.
However, the feature distributions between synthetic
and real images differed significantly, limiting the use
of the models on real images. Consequently, our
initial models produced nearly random results when
tested on real images. To address this disparity, we
adopted an iterative approach, refining our synthetic
dataset based on observed characteristics in real im-
ages (see Figure 2). This strategy continued until
we achieved the satisfactory results presented in sec-
tion 4.
The synthetic data was generated using all flange
sizes between 3–24 inches and pressure classes of 150
and 300 pounds, as described in the ASME 16.5 stan-
dard. We uniformly sampled the flange size and class
Synthetic Data-Driven Approach for Missing Nut and Bolt Classification in Flange Joints
303
from the finite set of sizes and classes. We added
camera perturbations to the synthetic image pairs to
closely emulate real images because it is unrealistic
to expect the user to dependably capture the flange at
specified viewpoints and distances in both views. In
addition, we constrained these perturbations so that
the bolts and nuts from both sides of the joint flange
were always visible in the image. Detailed attribute
variations are described in Table 1.
Table 1: Synthetic Data Camera Attributes. N (µ, σ
2
)
denotes a normal distribution with mean µ and standard de-
vitation σ. U(a, b) denotes a uniform distributation on the
range [a, b]. These attributes are sampled independently,
even for different views of the same image pair. The sam-
pled values are clamped if they exceed the specified range.
Attribute Distribution Range
Camera pan N (0, 3
2
) [−5
◦
, +5
◦
]
Camera tilt N (0, 1
2
) [−2
◦
, +2
◦
]
Camera roll N (0, 1
2
) [−2
◦
, +2
◦
]
Zoom percentage U(−15, +15) [−15, +15]
2-view angle difference 45 + N (0, 10
2
) [20
◦
, 70
◦
]
3.2 Model Architecture
We developed two main model architectures, single-
view, and multi-view, which take one or two images,
respectively. We tested multiple state-of-the-art back-
bone architectures for our single- and multi-view ap-
proaches to classify a missing nut or bolt. These in-
clude ViT (Dosovitskiy et al., 2020), ConvNeXt (Liu
et al., 2022), and SqueezeNet (Iandola et al., 2016).
Additionally, for comparison purposes with (Alnu-
may et al., 2022), we tested a VGG-16 (Simonyan
and Zisserman, 2015) backbone for the missing bolt
model. For each architecture, two independent mod-
els were developed, one for missing bolt and the other
for missing nut.
3.2.1 Single-View
Classifier
Healthy
or
Missing
Nut/Bolt
DL
model
Model
Figure 4: Single-view model architecture.
The single-view architecture, shown in Figure 4, is a
standard image classification pipeline where we in-
put a single image and output whether a flange is
healthy or anomalous. We tested various CNN and
transformer-based backbones.
3.2.2 Multi-View
(a) Flange appears to have
a missing bolt in the mid-
dle
(b) Flange appears healthy
after perspective change
Figure 5: Perspective is Critical. When observed from
non-ideal viewpoints, a healthy flange may appear to be
missing a nut or bolt due to center nuts and bolts being
closer to the camera and lens distortions on nuts and bolts
closer to the image’s edge.
Our multi-view model architecture is inspired by (Su
et al., 2015), where they used a multi-view CNN
(MVCNN) to improve the 3D object recognition per-
formance of CNNs by taking images from multiple
angles. We hypothesized that this architecture could
benefit our task, as we noticed that some perspectives
can be deceiving, as illustrated in Figure 5. Addition-
ally, MVCNN methods have improved performance
compared to single-view methods alone in other in-
dustrial use cases (Tilgner et al., 2019; Shamsafar
et al., 2023).
View 1
View 2
View 1
features
View 2
features
Classifier
Healthy
or
Missing
Nut/Bolt
DL
model
Aggregate
Model
Figure 6: Multi-view model architecture.
Figure 6 summarizes the architecture of our multi-
view model. It is similar to the single-view model in
that it takes images of flanges and outputs a classifi-
cation if they are healthy or anomalous. Again, two
separate models were developed to identify a missing
bolt or nut. However, this model takes two images of
the same flange from different perspectives as inputs.
It extracts features of each view from the same DL
model. These features are then combined and passed
VISAPP 2024 - 19th International Conference on Computer Vision Theory and Applications
304

Flange 1 Flange 2 Flange 3
View 1View 2
Figure 7: Real Image Samples. Sample image pairs from three real flanges that form our testing set. • indicates a missing nut,
while • indicates a missing bolt. The perspectives and backgrounds were varied for all anomalies and flange combinations.
to the final classification network. We attempted to
use various combination methods for the two feature
vectors, such as taking the sum, concatenation, max-
imum, or adding an attention layer. The best aggre-
gation method for missing nut was concatenating the
feature vectors, and the best method for missing bolt
was taking the mean of the two feature vectors. Sim-
ilar to the single-view model, we experimented with
multiple CNN and transformer-based backbones.
Our experimental setup used state-of-the-art
deep convolutional neural network architectures pre-
trained on the ImageNet dataset. We fine-tuned
these models for our specific tasks. We utilized the
widely adopted Adam optimizer with a learning rate
of 0.00008 and ReduceLROnPlateau with a factor of
10 to facilitate rapid convergence. The batch size
was set to 16, and data augmentation techniques were
applied to enhance the model’s generalization capa-
bility, including photometric transformation such as
random flips, sun flares, brightness, occlusions, and
color jittering. The training was conducted on a
high-performance computing cluster equipped with
NVIDIA A100 GPUs, expediting convergence and
significantly reducing training time. Our training
pipeline was implemented in PyTorch 2.0, leverag-
ing the CUDA toolkit for GPU acceleration. These
hyperparameters and resources were selected by an
extensive grid search and rigorous cross-validation to
ensure the best performance on our specific tasks.
4 RESULTS AND ANALYSIS
In this section, we first describe our Real Test Dataset.
Then, we provide the evaluation of our models in the
proposed test dataset for missing nut or bolt. In addi-
tion, we use GradCAM (Selvaraju et al., 2017), an in-
terpretability technique that highlights the important
regions of an image used by a CNN to make a par-
ticular classification decision to explain these results
qualitatively. Finally, we compare the performance
of our method against the previous work (Alnumay
et al., 2022) in the case of missing bolt.
4.1 Real Test Dataset
This lab-based dataset was manually collected using
a tablet device equipped with an HD camera. It com-
prises images of three distinct flange joints, each asso-
ciated with different pipe sizes: 8, 16, and 20 inches.
Every image in the dataset was rigorously labeled ac-
cording to our three classes: healthy, missing nut, and
missing bolt. Importantly, we maintained a uniform
number of images within each class, ensuring a bal-
anced dataset.
To replicate real-world conditions, the flanges in
our dataset exhibit environmental wear and tear. Ad-
ditionally, controlled movement of the flanges was in-
cluded during image capture to provide diverse yet
natural backgrounds and lighting effects.
In the multi-view configuration, we captured 360
image pairs for each class, resulting in 1,080 image
pairs, equivalent to 2,160 individual images. Fig-
ure 7 shows a subset of our real dataset as image
pairs. In the single-view configuration, we exclu-
sively used the first image from each pair. This de-
cision was grounded in the assumption that the distri-
bution between the two views remains identical, leav-
ing the second image redundant for single-view anal-
ysis. Each image pair was captured from a different
viewpoint by moving the tablet’s camera around the
flange. These viewpoint variations were randomly se-
lected within a range of ±20
◦
to emulate natural hu-
man movement during the capturing process.
4.2 Missing Nut
We started by evaluating the effectiveness of our two
methods in identifying a missing nut on the Real Test
Dataset. For this evaluation, we leveraged the syn-
thetic dataset to fine-tune state-of-the-art backbones,
such as ConvNeXt, ViT, and SqueezeNet. Table 2
Synthetic Data-Driven Approach for Missing Nut and Bolt Classification in Flange Joints
305
summarizes the results.
The best results are obtained with the ConvNeXt
backbone in both methods, single-view and multi-
view. Our method’s comparison shows that the multi-
view approach consistently outperforms the single-
view. In addition, the performance of our method is
greatly improved with the synthetic data when using
a multi-view approach as opposed to a single-view.
We observed that the multi-view method could re-
duce the gap between synthetic and real domains for
the analyzed backbones to make inferences on real
data while training only on synthetic images. Our best
model reports an accuracy of 82.22% using the multi-
view method, while the best single-view model only
reports 66.81%.
To enhance the generalization capabilities of our
multi-view model while mitigating overfitting on the
Real Test Dataset, we applied the feature alignment
technique AdaBN (Li et al., 2018). This approach fur-
ther improved the accuracy to 95.14%.
Table 2: Missing Nut Results. Testing accuracies for miss-
ing nut detection, based on the Real Test Dataset. Multi-
view increases the accuracy by 15% and by 28% when com-
bined with AdaBN
Method ConvNeXt ViT SqueezeNet
Single-View 66.81 62.81 57.36
Multi-View 82.22 76.39 72.92
Multiview + AdaBN 95.14 – –
4.2.1 Qualitative Analysis
We tested our methods on real-world flanges (Real
Test Dataset). Figure 8 shows classification samples
as a visual confusion matrix. The model’s areas of
interest for correct classifications focus more on the
whole flange for healthy flanges and the nuts for miss-
ing nut cases. The false positive probably occurred
from other background flanges confusing the model,
while the false negative can likely be attributed to a
short bolt.
Overall, we observe a considerable difference in
recall between our two methods for the healthy and
missing nut classes. Our single-view method cor-
rectly predicts more healthy flanges than missing nut
instances. However, while our multi-view approach
successfully predicts almost every case of missing
nut, it fails to identify more healthy flange cases.
4.3 Missing Bolt
We followed the same methodology as in subsec-
tion 4.2 to assess our two methods for identifying a
missing bolt. Additionally, we compare our results to
Ground-Truth
Healthy Missing Nut
Prediction
Healthy
Missing Nut
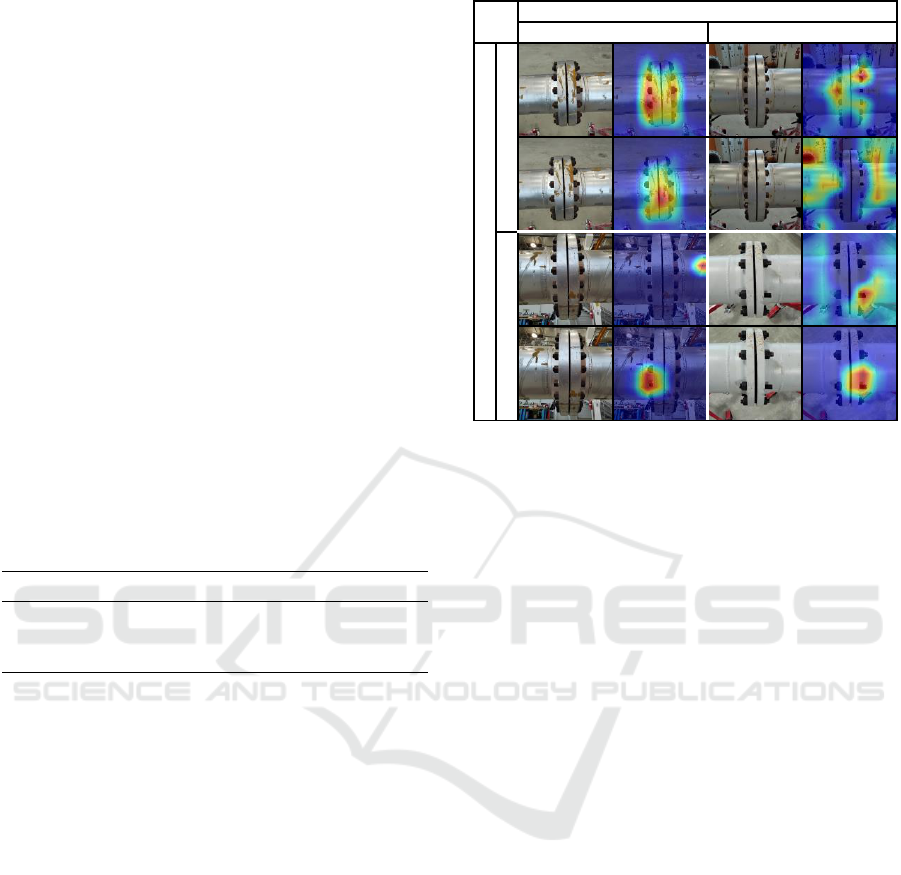
Figure 8: Missing Nut Qualitative Results. We show sam-
ple images of correct and incorrect classifications, using the
multi-view method and ConvNeXt backbone, for missing
nut as a visual confusion matrix. We use GradCAM’s visu-
alization capabilities to highlight the model’s areas of inter-
est used for classification.
prior work (Alnumay et al., 2022). Table 3 summa-
rizes the results.
4.3.1 Comparison Against Prior Work
The work of (Alnumay et al., 2022) collects its own
real-world dataset. Their test set consists of 36 im-
ages, where 20 images belong to missing bolt in-
stances of the same flange (8 inches) and 16 images of
healthy flanges, where 68% of the cases are from the
8-inch flange. Due to the precise data imbalance and
bias towards 8-inch flanges, we run their proposed
model in our test set (see details in subsection 4.1)
and perform a direct comparison.
Our model displays notable robustness when con-
fronted with various pipe sizes, even in cases where
the size is not explicitly provided as input, inferring
the pipe size from flange to pipe ratio. Leveraging
this unique ability, the model proficiently determines
the number of bolts required for a specific flange type
set forth by the relevant standards.
Overall, we observe that our best single-view
model (ConvNeXt) outperforms the comparable
model of (Alnumay et al., 2022) by 9%. Likewise,
our best multi-view model (ViT) outperforms (Alnu-
may et al., 2022) model by 29%. This suggests that
our proposed multi-view model has a better general-
ization capability than prior work.
VISAPP 2024 - 19th International Conference on Computer Vision Theory and Applications
306
4.3.2 Real Dataset Evaluation
In contrast to Table 2, different backbone models pro-
duce the best results for each method. In particu-
lar, ViT succeeds in multi-view, whereas ConvNeXt
stands out in single-view. Additionally, our multi-
view approach consistently exceeded the performance
of single-view models, as previously seen in subsec-
tion 4.2. This outcome emphasizes the advantages of
leveraging a multi-view method.
In general, our findings suggest that identifying a
missing bolt is significantly easier than identifying a
missing nut due to the salient visual cues present in
the images. When identifying missing bolts, we ob-
served three instances of missing items (2 nuts and 1
bolt) compared to only one instance of a missing item
(one nut) when identifying missing nuts. The analysis
of the GradCAM results showed a significant differ-
ence in attention distribution. For missing bolts, at-
tention was mainly on the flange and bolt-related el-
ements, while for missing nuts, attention was more
scattered. The multi-view method alone achieved
the highest accuracy for missing bolts at 95.28% and
for missing nuts at 82.22%. Our best single-view
model for detecting a missing bolt has an accuracy
of 75.28%. Additionally, by using feature alignment
methodologies, we can increase the accuracy of miss-
ing nut identification to 95.14%.
Contrary to the promising results observed in Ta-
ble 2, applying AdaBN to our multiview model for
identifying missing bolts resulted in a 5% decrease
in accuracy, significantly compromising the model’s
generalization capabilities.
Table 3: Missing Bolt Results. Testing accuracies for miss-
ing bolt detection, based on the Real Test Dataset. Multi-
view increases the accuracy by 20%.
* VGG model from (Alnumay et al., 2022) tested on our Real Test Dataset.
Method ConvNeXt ViT SqueezeNet VGG*
Single-View 75.28 73.61 55.14 65.83
Multi-View 90.14 95.28 91.11 –
Multiview + AdaBN – 90.28 – –
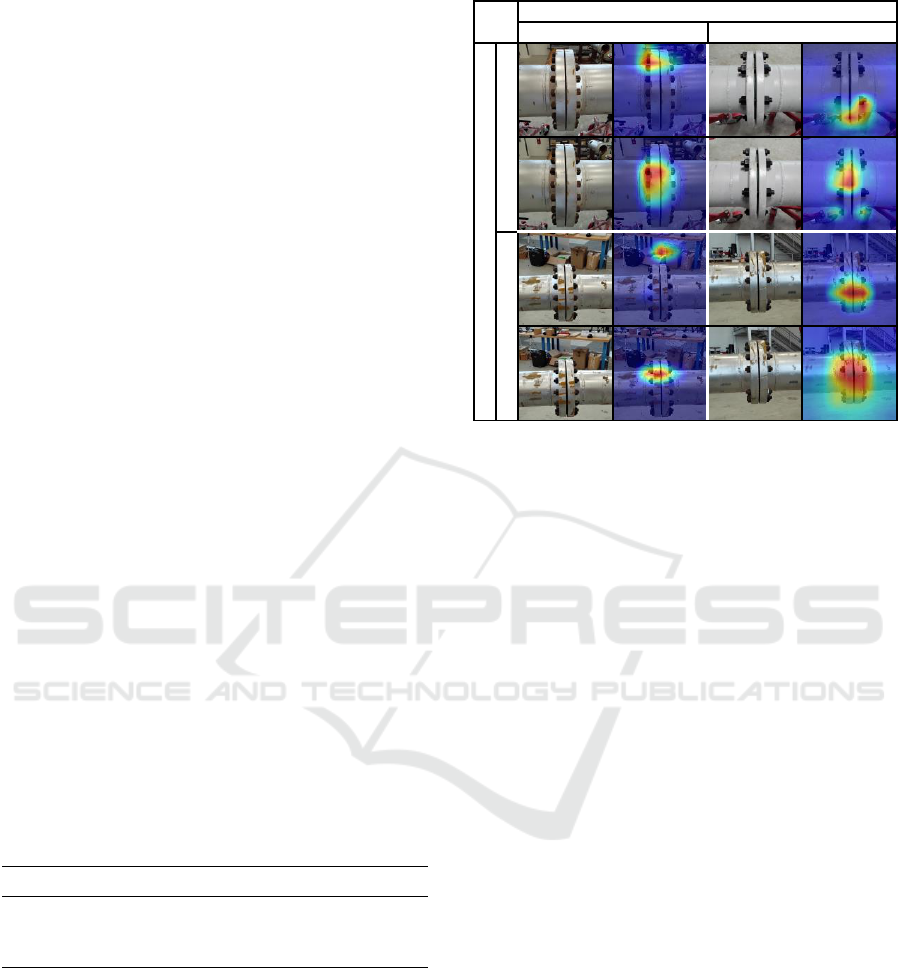
4.3.3 Qualitative Analysis
We tested our methods on real-world flanges (Real
Test Dataset). Figure 9 shows classification sam-
ples as a visual confusion matrix. The model’s ar-
eas of interest for correct classifications focus more
on bolts for healthy flanges and the specific regions
where missing bolt cases happen. The false positive
case likely resulted from background objects in the
top image, while there is no clear indicator for the
cause of the false negative. However, it is noted that
Ground-Truth
Healthy Missing Bolt
Prediction
Healthy
Missing Bolt
Figure 9: Missing Bolt Qualitative Results. We show sam-
ple images of correct and incorrect classifications, using the
multi-view method and ConvNeXt backbone, for missing
bolt as a visual confusion matrix. We use GradCAM’s vi-
sualization capabilities to highlight the model’s areas of in-
terest used for classification.
when images with similar viewpoints are provided to
the network, the model may be confused and focus on
areas that appear to have missing bolts.
Overall, we observe a considerable difference in
recall between our two methods for the healthy and
missing bolt classes. Our single-view method cor-
rectly predicts more healthy flanges than missing
nut instances. However, our multi-view approach
successfully reduces the number of misclassified in-
stances for both healthy and anomalous cases.
5 CONCLUSION AND FUTURE
WORK
In this paper, we present a multi-view image classifi-
cation approach based on computer vision for detect-
ing a missing nut or bolt in a flange joint image. This
was achieved using CNN and transformer-based net-
works that were exclusively trained on synthetic im-
age data and augmented with varying parameters en-
countered in real scenarios. The model demonstrated
its efficacy when tested on a real-world dataset, illus-
trating robust performances in most scenarios.
In future work, we aim to enhance material and
texture modeling and illumination techniques for syn-
thetic images, benchmark the number of views, and
evaluate the model’s performance in detecting multi-
Synthetic Data-Driven Approach for Missing Nut and Bolt Classification in Flange Joints
307

ple missing nuts or bolts, short/long and loose bolts
using our two-step methodology. We will also ex-
plore domain adaptation techniques to reduce the gap
between the source and target domains.
ACKNOWLEDGEMENTS
This publication is based on work supported by the
Research & Development Center of Saudi Aramco.
We also acknowledge the King Abdullah University
of Science and Technology (KAUST) for providing
computational resources.
REFERENCES
Alnumay, Y., Alrasheed, A. J., Trigui, H., et al. (2022).
Synthetic data generation for machine learning ap-
plications in the energy industry. In ADIPEC, page
D021S052R003. SPE.
ASME (2019). ASME PCC-1 pressure boundary bolted
flange joint assembly.
ASME (2020). ASME 16.5B pipe flanges and flanged fit-
tings: Nps 1/2 through nps 24, metric/inch standard.
Blender (2018). Blender - a 3D modelling and render-
ing package. Blender Foundation, Stichting Blender
Foundation, Amsterdam.
Cha, Y.-J., You, K., and Choi, W. (2016). Vision-based de-
tection of loosened bolts using the hough transform
and support vector machines. Automation in Con-
struction, 71:181–188.
Deng, J., Dong, W., Socher, et al. (2009). ImageNet:
A Large-Scale Hierarchical Image Database. In
CVPR09.
Deng, L. (2012). The mnist database of handwritten digit
images for machine learning research. IEEE signal
processing magazine, 29(6):141–142.
Dosovitskiy, A., Beyer, L., Kolesnikov, A., et al. (2020). An
image is worth 16x16 words: Transformers for image
recognition at scale. arXiv:2010.11929.
Hongjian, Z., Ping, H., and Xudong, Y. (2015). Fault de-
tection of train center plate bolts loss using modified
lbp and optimization algorithm. The Open Automation
and Control Systems Journal, 7(1).
Iandola, F. N., Han, S., Moskewicz, et al. (2016).
Squeezenet: Alexnet-level accuracy with 50x fewer
parameters and less than 0.5 mb model size. arXiv
preprint arXiv:1602.07360.
Li, Y., Wang, N., Shi, J., et al. (2018). Adaptive batch nor-
malization for practical domain adaptation. Pattern
Recognition, 80:109–117.
Liu, Z., Mao, H., Wu, C.-Y., et al. (2022). A convnet for the
2020s. In Proceedings of the IEEE/CVF CVPR, pages
11976–11986.
Nikravesh, S. M. Y. and Goudarzi, M. (2017). A review
paper on looseness detection methods in bolted struc-
tures. Latin American Journal of Solids and Struc-
tures, 14:2153–2176.
Park, J.-H., Huynh, T.-C., Choi, S.-H., et al. (2015). Vision-
based technique for bolt-loosening detection in wind
turbine tower. Wind Struct, 21(6):709–726.
Saad, S., Ekhwan, A., and Al-Idrus, S. M. H. (2022). Bolted
Flange Joint Integrity Digitalization Programme for
Sustainable Flange Leak Free Operation. Offshore
Technology Conference Asia, Day 4 Fri, March 25,
2022:D041S041R003.
Selvaraju, R. R., Cogswell, M., Das, A., et al. (2017).
Grad-cam: Visual explanations from deep networks
via gradient-based localization. In Proceedings of the
IEEE ICCV, pages 618–626.
Shamsafar, F., Jaiswal, S., Kelkel, B., et al. (2023). Lever-
aging multi-view data for improved detection perfor-
mance: An industrial use case. In Proceedings of the
IEEE/CVF CVPR Workshops, pages 4463–4470.
Simonyan, K. and Zisserman, A. (2015). Very deep convo-
lutional networks for large-scale image recognition.
Su, H., Maji, S., Kalogerakis, E., and Learned-Miller, E.
(2015). Multi-view convolutional neural networks for
3d shape recognition. In Proceedings of the IEEE
ICCV.
Sun, Y., Li, M., Dong, R., Chen, W., and Jiang, D. (2022).
Vision-based detection of bolt loosening using yolov5.
Sensors, 22(14):5184.
Tilgner, S., Wagner, D., Kalischewski, K., et al. (2019).
Multi-view fusion neural network with application in
the manufacturing industry. In 2019 IEEE ISCAS,
pages 1–5.
Wanasinghe, T., Trinh, T., Nguyen, T., et al. (2021). Human
centric digital transformation and operator 4.0 for the
oil and gas industry. IEEE Access, PP:1–1.
Wang, C., Wang, N., Ho, S.-C., et al. (2019). Design of a
new vision-based method for the bolts looseness de-
tection in flange connections. IEEE Transactions on
Industrial Electronics, 67(2):1366–1375.
Wang, T., Song, G., Liu, S., Li, Y., and Xiao, H.
(2013). Review of bolted connection monitoring. In-
ternational Journal of Distributed Sensor Networks,
9(12):871213.
Xue, J., Chen, X., Fan, Z., et al. (2019). Effect of internal
pressure on gasket stress and leakage rate of bolted
flanged joint during the long term service at high tem-
perature. In Pressure Vessels and Piping Conference,
volume 58936, page V002T02A031. ASME.
Zhang, L., Liu, Y., Sun, J., et al. (2015). Research on the
assembly pattern of mmc bolted flange joint. Procedia
Engineering, 130:193–203.
Zhao, X., Zhang, Y., and Wang, N. (2019). Bolt loosening
angle detection technology using deep learning. Struc-
tural Control and Health Monitoring, 26(1):e2292.
VISAPP 2024 - 19th International Conference on Computer Vision Theory and Applications
308
