
Pareto Front Approximation by Ant Colony Optimization
Jaroslav Janáček and Marek Kvet
University of Žilina, Faculty of Management Science and Informatics, Univerzitná 8215/1, 010 26 Žilina, Slovak Republic
Keywords: Discrete Location Problems, Conflicting Criteria, Pareto Frontier Approximation, Ant Colony.
Abstract: The Pareto frontier of multi-objective problem solutions denotes the unique exact solution to a problem with
two or more equivalent objectives. Even when the number of problem solutions is finite, determining the
precise Pareto frontier is a difficult task. Different metaheuristics can therefore provide a user with a decent
approximation of the Pareto frontier in a reasonable amount of time, whereas the exact computational time-
intensive approaches cannot. The acceptable computational time of metaheuristics counterbalances a
solution's deviation from the Pareto frontier. This contribution describes one of a spectrum of metaheuristics
implemented with the objective of locating non-dominated solutions to the public service system design
problem involving two competing criteria. The metaheuristic minimizes the difference between the present
set of non-dominated solutions and the Pareto front by applying the ant colony optimization principle. A series
of numerical experiments with benchmarks for which the exact Pareto frontiers are known are used to evaluate
the efficacy of the proposed metaheuristic. Even though the proposed method is applicable anywhere, the
used dataset comes from an Emergency Medical Service system in Slovakia, which belongs to the generally
known wide class of public service systems.
1 INTRODUCTION
One of those crucial application spheres where many
advanced methodologies of operations research can
frequently be met is the creation of various service
systems. We are now able to address a wide range of
challenging problems that were previously
unsolvable due to huge advancements made in
numerous technical disciplines, from hardware to
cutting-edge software technology. One of such
examples is the challenging problem of establishing a
service system (Ahmadi-Javid et al, 2017, Avella,
Sassano, Vasil'ev, 2007, Brotcorne, Laporte, Semet,
2003, Current, Daskin and Schilling, 2002). Let us go
more specific about service systems.
Typically, a service system consists of a few
components that have a structure, behavior (which
may be characterized as a business process), and a
purpose (people, facilities, tools, and/or software
applications). The premise that a service system can
be regarded as a work system that generates a certain
type of specified services is an easier, but more
constrained description (Doerner et al, 2005,
Gendreau, Potvin, 2010, Gopal, 2013, Ingolfsson,
Budge, Erkut, 2008, Jánošíková, 2007, Jánošíková,
Žarnay, 2014).
In general, service systems can be split into two
sizable categories. Public service systems are based
on distinct presumptions, whereas private service
systems are typically developed to deliver the
maximum profit to their managers, founders,
shareholders, and operators regardless of the number
of clients served or equal access to given service.
Public service systems are designed to ensure that
all locals will receive services, regardless of financial
gain or loss. They are required by law to exist. These
systems comprise many different things, such as state
administration, emergency medical services (EMS),
and many more (Ahmadi-Javid et al, 2017, Brotcorne,
Laporte, Semet, 2003, Ingolfsson, Budge, Erkut,
2008, Marianov, Serra, 2002). The public service
system design problem is a member of the family of
location problems, which have been researched and
successfully resolved by numerous authors (Avella,
Sassano, Vasil'ev, 2007, Kvet, 2018).
Several factors must be taken into account while
looking for a solving method for this class of huge
location problems: The issues' combinatorial nature
suggests that mathematical programming techniques,
which have some specificities of their own, were used
to solve them. The constraint of available resources is
another significant factor. Additionally, the service
200
Janá
ˇ
cek, J. and Kvet, M.
Pareto Front Approximation by Ant Colony Optimization.
DOI: 10.5220/0012262900003639
Paper published under CC license (CC BY-NC-ND 4.0)
In Proceedings of the 13th International Conference on Operations Research and Enterprise Systems (ICORES 2024), pages 200-206
ISBN: 978-989-758-681-1; ISSN: 2184-4372
Proceedings Copyright © 2024 by SCITEPRESS – Science and Technology Publications, Lda.

must be concentrated in a number of service locations
rather than being offered everywhere. Naturally, the
customers who are served can travel to these centers
or a team can go from a service center to the
emergency location. As a result, the challenge in
designing a public service system typically lies in
determining the best network topology for service
centers to meet a particular criterion. Based on the
preliminary analyses given, the weighted p-median
problem formulation is one of the modeling
approaches that is most frequently employed.
The precise shape of the objective function and
the modeling approach itself determine whether the
problem can be solved. The so-called radial strategy
can be used in place of the commonly used location-
allocation form to tackle substantially bigger issue
instances (Avella, Sassano, Vasil'ev, 2007, Kvet,
2018). The problem is significantly simpler to solve
if the optimization criterion utilized has a min-sum
form as opposed to one where the objective function
has a min-max form with certain link-up constraints.
The second drawback is brought on by the
limitation that only one target can be optimized.
Large public service systems, like an EMS, are
known to be complex systems with a variety of
conflicting demands made by various stakeholder
groups (Arroyo et al, 2010, Grygar, Fabricius, 2019,
Janáček, Fabricius, 2021). Consequently, the primary
focus of this research study is on creating multi-
objective service systems. Only two opposing aims
will be considered for the sake of simplicity.
The primary scientific contribution of this study
is to bring a new heuristic approach to address the
issue of constructing two-objective service systems.
A so-called Pareto frontier of service system designs
must be built since a multi-criteria optimization
presumes providing a condensed set of options from
which the final system design is to be selected. It
takes a lot of time to obtain the entire Pareto frontier
(Arroyo et al, 2010, Grygar, Fabricius, 2019, Janáček,
Fabricius, 2021). Therefore, from a practical
standpoint, the creation of effective heuristics is
required. The quality of the set of solutions that is
produced is examined and empirically confirmed on
a dataset from the actual world in this study.
The structure of this article takes the following
form. Section 2 is devoted to the mathematical
formulation of the problem and the conflicting criteria
explanation. The notion of a Pareto frontier is
discussed together with the method for different
Pareto sets comparison. Section 3 provides the
readers with the principle of Pareto frontier
approximation by gradual refinement. In the fourth
section, we describe the ant colony optimization and
all the ideas behind suggested solving algorithm. The
fifth section contains the results of performed
experiments with real-world data and finally, the last
section is devoted to concluding remarks.
2 NON-DOMINATED PUBLIC
SERVICE SYSTEM DESIGNS
It is vital to clarify the Pareto frontier and give the
readers a mathematical description of the problem
before going into detail about the incremental
refinement strategy itself. Let us focus on the problem
specification, now.
Finding the stations from which ambulances are
sent to demand sites is a difficulty in EMS design. For
the mathematical formulation of the problem,
suppose that a finite set I of candidates is given. The
candidates are often selected from network
components that meet specific criteria for EMS
station location. The resulting selection of service
center locations must include exactly p entries (p is an
integer less than or equal to the cardinality of I) in
order for the given aim to take on its best value due to
several personal, technological, or other constraints.
A zero-one variable, y
i
∈{0, 1}, which equals one if a
center should be placed at i∈I and zero otherwise, will
be used to simulate the choice of where to place a
service center (EMS station). A vector y of location
variables y
i
can therefore be used to define any
solution to the corresponding p-location issue. The
following expression (1) can describe the basic
model.
() { }
min : 0, 1 , ,
ii
iI
f
yiIyp
∈
∈∈=
y
(1)
If one wanted to make the EMS system design
problem more general, there could be added at least
one extra objective. Under the assumption that m
denotes the cardinality of the set I and n denotes the
cardinality of the set J, the former model (1) may be
rewritten into the form of (2).
() () { }
12
1
min , : 0, 1 ,
m
m
i
i
f
fyp
=
∈=
yyy
(2)
As mentioned in the paper's introduction,
combining two criteria might provide a variety of
difficulties for the decision-making process,
especially when the aims are incompatible. We can
only concentrate on two objective functions, f
1
(y) and
f
2
(y), which will be referred to as so-called system and
fair criteria, respectively. To formulate them in a
Pareto Front Approximation by Ant Colony Optimization
201

mathematical way, several notations are necessary to
be introduced.
Let J represent the set of locations of system users
(service recipients). Analogically, let the symbol I
stand for the set of candidates for facility locations.
The sets I and J can be equivalent. The number of
unique users located at j from J will be represented by
the value of b
j
. The quantity of anticipated demands
during a specific period is one possible interpretation
of this nonnegative integer coefficient. It can be
understood as the weight of location j, though.
According to the possible center location i, the
disutility for a patient located at j will be indicated as
d
ij
. Despite the benefits of integer values, the value of
d
ij
need not be an integer. It is important to remember
that service requests come in at random; therefore, the
most nearby station need not be used to cover the
current demand that has emerged anywhere. From a
mathematical standpoint, it is assumed that r nearest
located centers participate in offering the service to
users, and q
k
signifies the possibility that the k-th
nearest center is the one that is closest and easily
accessible at the time the demand occurs. To
complete the formulations of the system and fair
objective functions, let the function min
k
return the k-
th smallest element from the list in the function's
parameter. The system criterion f
1
(y) optimizes the
average distance between system users and the closest
available center. It can be formulated by (3).
Optimization of the average distance may be achieved
by minimization of the sum of distances.
()
{}
1
11
min : {1, ..., }, 1
nr
jkkij i
jk
fbqdimy
==
=∈=
y
(3)
If we wanted to evaluate the average distance
AvgDist, it could be done in the following way
described by (4).
()
1
1
n
j
j
f
AvgDist
b
=
=
y
(4)
The number of users whose distance from the
closest facility exceeds the radius D is expressed by
the fair objective function value f
2
(
y
), which was
developed in accordance with formula (5). To provide
certain level of fairness (Bertsimas, Farias, Trichakis,
2011, Buzna, Koháni, Janáček, 2013).
() { }
{}
()
2
1
max 0,
min : , 1
n
j
j
ij i
fbsm
sm sign d i I y D
=
=
=∈=−
y
(5)
There is no doubt that the criteria (3) and (5) are
in direct conflict. It suggests that improving one
would inevitably make the other worse. The
aforementioned goal conflict can be resolved by
creating a full Pareto frontier of solutions, or at least,
its approximation. In other words, rather than one
final system design, a specific small subset of options
are presented. Naturally, in order to select one of the
available options and arrive at the resulting system
design, politics, negotiation, and experts must be
involved. Let us focus on Pareto frontier, now.
A Pareto frontier is often made up of a few
solutions that satisfy non-dominance for each pair of
its members. No matter what form a feasible solution
P takes, it may be evaluated using the two criteria
f
1
(P) and f
2
(P) in the bi-criteria optimization. The
non-dominance can be explained by the following: A
solution P is referred to as a non-dominated solution
if [f
1
(P), f
2
(P)] ≠ [f
1
(R), f
2
(R)] matches the inequality
f
1
(P) < f
1
(R) or f
2
(P) < f
2
(R). Then, a straightforward
explanation of the Pareto frontier is given in the
following Figure. 1.
Figure 1: Explanation of the Pareto frontier.
The red solutions do not belong to the Pareto
frontier because of being dominated by the green
ones. Since there are no solutions dominating the
green elements, both of them must be included into
the Pareto frontier (Grygar, Fabricius, 2019, Janáček,
Fabricius, 2021).
Sometimes, symbols MLM and MRM are used to
denote the most left and the most right members of
the Pareto frontier. These bordering solutions can be
computed easily making use of a simple mathematical
model solvable usually in a short time. We will
concentrate our efforts on creating a good
approximation of the Pareto frontier because it is a
challenge to obtain the entire Pareto set. The sequence
of noNDSS (non-negative integer value) solutions
y
1
,
…,
y
noNDSS
ordered according to increasing values of
f
2
will be used to represent the approximate set of non-
dominated solutions (NDSS). The bordering solutions
y
1
and
y
noNDSS
must be found to be very close to the
most left and the most right solutions of the Pareto
frontier in terms of the values of f
1
(
y
) and f
2
(
y
), in
ICORES 2024 - 13th International Conference on Operations Research and Enterprise Systems
202

order to achieve a useful approximation. Under these
presumptions, so-called area A(NDSS) computed in
accordance with expression (6), can be used to assess
the accuracy of the NDSS as the Pareto frontier
approximation. The size of the grey polygon in Figure
1 is represented by the A(NDSS) to make it easier to
comprehend.
() ( )
() ()
1
12
1
11 1
1
22 2
()
noNDSS
kk
k
k noNDSS
k
kk
k
ANDSS dif dif
dif f f
dif f f
−
=
+
=
=−
=−
yy
yy
(6)
Whenever the Pareto frontier is needed to be
approximated by a set NDSS, the quality of the
approximation must be evaluated. For this purpose,
so-called gap may be used. The gap can be defined as
follows: Under the assumption that PF denotes the
original complete Pareto frontier and NDSS denotes
its approximation, the gap can be evaluated in
percentage according to the expression (7).
()()
100*
()
ANDSS APF
gap
APF
−
=
(7)
3 GRADUAL REFINEMENT
SCHEME
Many alternative methods, some of which may also
be based on the decrementing neighbourhood search
algorithm, can be used to generate a Pareto frontier or
at least a good approximation of one. The schema of
its gradual refining is one of the approaches that
might be used in the development of the NDSS
(Janáček, Kvet, 2022a, Janáček, Kvet, 2022b,
Janáček, Kvet, 2022c, Kvet, Janáček, 2022).
The two-element initial NDSS of the most left and
the most right bordering solutions of the Pareto
frontier serves as the basis for the process. These
bordering solutions are simple to compute, and
getting them usually doesn't take too much effort. The
previously mentioned refining process is repeated.
This indicates that the results of processing one round
produce a set of NDSS data that may be utilized as an
input set for the subsequent inspection procedure. The
results of a process that is repeated more than once
may have different outcomes since the inbuilt
decrementing algorithm may employ random actions.
As a result, the inner cycle is nested inside a time-
controlled cycle, which keeps repeating the inner
cycle until the time limit is reached. In other words,
NDSS refining continues until a time limit prevents
algorithm performance.
The gradual refinement approach processes the
input NDSS solutions iteratively one by one. The
elements of NDSS are expected to form a sequence y
1
,
…, y
noNDSS
. If any solution y
k
is processed, then a
neighborhood search algorithm may be applied to
find candidates for NDSS updating. As NDSS can
change during one run of the algorithm, the solution
corresponding with the k-th position may also change.
If it happens, the algorithm is applied once again to
this new solution y
k
, otherwise the following solution
y
k+1
is processed. If k = noNDSS-1, the refinement
process terminates (Janáček, Kvet, 2022b, Kvet,
Janáček, 2022).
4 ANT COLONY OPTIMIZATION
The ant colony optimization algorithms imitate in
general cooperation of ant colony members in
searching food which is distributed in nodes of a
network of possible ants’ moves. In most of
implementations, an ant is an agent, who searches for
an improving solution in a finite set of problem
solutions equipped with a topology given by system
of neighbourhoods. The ant chooses its inspected way
in the network which vertices are represented by
individual solutions and which edges correspond to
passible moves from one solution to a neighbouring
one. As the set of feasible solution is too vast to be
able to record real path in the associated network,
only some attributes of the path inspection are taken
into account. Performance of an ant starting at a given
solution will be determined by the neighbourhood
searching strategy and buy swap operations, which
implement moves between the network vertices. The
searching strategy is determined by a combination of
two parameters thr and maxNos, where the first one
gives minimal improvement to consider a move
admissible and the second parameter gives the
number of admissible moves, from which the best one
is realized. The swap operation replaces one location
of a current solution by a location which is not
included in the solution.
Instead of recording the inspected path in detail,
we reduce the path description to the set of location
which have been subsequently included into the
starting solution. These recorded entries will be
considered in the phase of laying pheromone. A
detailed description of the ant’s search and
pheromone laying follows.
The ant starts with a given feasible solution y of
the p locations saved in the list P of the locations
Pareto Front Approximation by Ant Colony Optimization
203

selected from the set I of all possible service center
locations.
Based on thickness of the pheromone layer, the
ant randomly choices the strategy given by a pair of
the parameters thr and maxNos.
Following the chosen strategy, the ant searches
the neighbourhood of the current solution while
constantly updating the NDSS and evaluating each
found admissible swap operation applied to the
exchange of location i∈P for j∈I-P from the point of
move to a new current solution.
The admissible operation is characterized by a
decrement Idec of the A(NDSS) caused by its
performing. The inserted location j has its pheromone
layer F(j) and the resulting fitness value is Dec*F(j).
The ant’s decision on the best swap for the move to
the new solution is performed according to the result
of a sequence of comparisons. The recently appointed
swap operation with fitness value MFit is compared
to fitness CFit of a candidate and it is decided on
update according to a random trial with probability
CFit/(CFit +MFit) in favor of the candidate. The ant’s
search finishes, when either whole neighbourhood is
inspected or ImaxNos candidates are evaluated.
The ant’s search terminates with failing of finding
an admissible candidate for the move to a new current
solution. The difference between the A(NDSS) before
the ant’s search and A(NDSS) after the search denoted
by Dec is used to update the pheromone layer F(s) of
the chosen strategy s and all inserted locations j using
the following formula (8).
() ()
D
ec
Fs Fs
InitArea
=+
(8)
The final pheromone adjustment is performed
with a pheromone layer of each object according to
the expression F(s) = (1 - ρ)*F(s), where ρ is an
evaporating coefficient.
5 NUMERICAL EXPERIMENTS
Suggested ant colony optimization for Pareto fro
frontier nt approximation was explained in previous
sections of this contribution. To verify its efficiency
and accuracy, several computational analyses needed
to be performed. The content of this section is aimed
at the results of performed numerical experiments.
Let us concentrate on available software tools and
technical parameters of used machine, first.
All computational experiments reported in this
study were performed making use of Java
programming language within the NetBeans
development kit. The algorithms were run on a
common notebook equipped with the 11
th
Gen Intel®
Core™ i7 1165G7 2.8 GHz CPU and 40 GB RAM.
After having introduced necessary software and
hardware tools for this computational study, let us
describe solved problems and their most important
characteristics.
As far as the set of used problem instances is
concerned, we took the benchmarks from our
previous research (Grygar, Fabricius, 2019, Janáček,
Fabricius, 2021, Janáček, Kvet, 2020 , Janáček, Kvet,
2021, Janáček, Kvet, 2022a, Janáček, Kvet, 2022b,
Janáček, Kvet, 2022c, Kvet, Janáček, 2022).
Mentioned dataset represents the existing EMS
system operated by private agencies - service
providers in eight autonomous higher territorial units
in Slovakia. The list of problem instances covers the
regions of Bratislava (BA), Banská Bystrica (BB),
Košice (KE), Nitra (NR), Prešov (PO), Trenčín (TN),
Trnava (TT) and Žilina (ZA). It must be noted that all
network nodes represent both the set of candidates for
service center locating and the set of clients being
provided with urgent healthcare service as well. But
generally, the sets of candidate locations and system
users’ locations may differ. The number of users b
j
located in each node j from J were taken from the
official Slovak statistical analysis and the values were
rounded up to hundreds.
As the objective function f
1
(y) follows the concept
of so-called generalized disutility (Grygar, Fabricius,
2019, Janáček, Fabricius, 2021, Kvet, 2014), the
parameter r was set to 3. The associated probability
coefficients q
k
were set so that q
1
= 77.063, q
2
=
16.476 and q
3
= 100 - q
1
- q
2
. These values correspond
also to the data used in our previous research to make
the results of different methods comparable. More
details about the parameter settings suitable for the
objective function (3) can be found in (Jankovič,
2014).
Parameter D used in the fair objective (5) was set
to the value of 10.
The following summary reported in Table 1
brings the overview of used benchmarks. The
structure of the table is designed so that each row
corresponds to one solved problem. The first column
of the table is used to identify the instance by the
abbreviation of the region. The second column
denoted by |I| reports the cardinality of the set I. In
other words, there are reported the numbers of
candidates for service center locating, from which
exactly p elements are to be chosen. The values of p
are reported in the third column of the table. The right
part of Table 1 is used to summarize the most
important characteristics of the complete Pareto
fronierts. The column denoted by NoS gives the
ICORES 2024 - 13th International Conference on Operations Research and Enterprise Systems
204
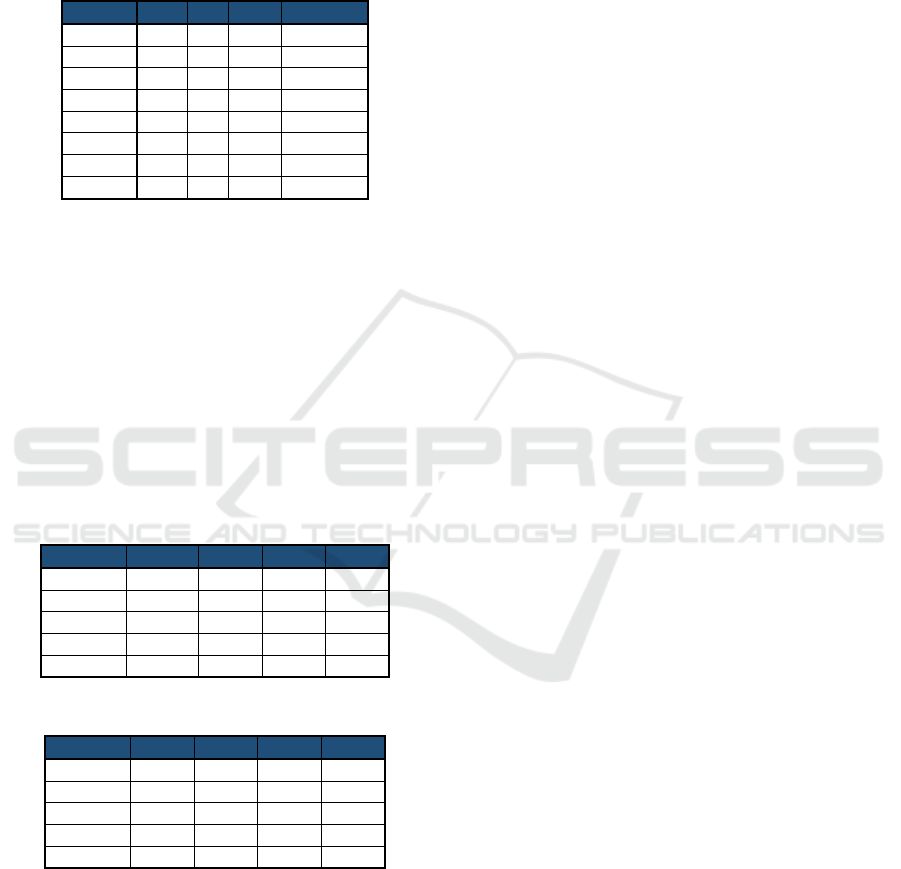
number of solutions creating the entire Pareto set. In
the column denoted by A(PF) we provide the readers
with the size of the polygon defined by the Pareto
frontier elements as suggested by the expression (6).
Table 1: Benchmarks sizes and the exact Pareto frontiers
characteristics.
Region |I| p
N
o
S
A
(P
F
)
BA 87 14 34 569039
BB 515 36 229 1002681
KE 460 32 262 1295594
NR 350 27 106 736846
PO 664 32 271 956103
TN 276 21 98 829155
TT 249 18 64 814351
ZA 315 29 97 407293
The achieved results are summarized in Table 2
and Table 3 which take the same structure. Since
many heuristic methods may perform a random trial
or they need generating random numbers, we have
performed ten runs of the algorithm for each
benchmark, and we report the average values of all
studied parameters. While Table 2 contains the results
of experiments with the first four datasets, Table 3
summarizes the second half of problem instances.
Each column of the tables corresponds to one solved
problem and each row is used to one studied
characteristic.
Table 2: Results of ant colony optimization– part 1.
Region BA BB NR KE
C
T
[s] 300.0 320.0 315.5 302.4
noNDS
S
33.0 206.6 250.6 102.1
Gap [%] 1.47 1.03 2.21 0.72
N
oTR 1227.7 1.9 1.5 9.1
N
oTOR 4205.1 8.9 10.8 52.2
Table 3: Results of ant colony optimization – part 2.
Region PO TN TT ZA
C
T
[s] 357.6 301.3 300.5 303.0
noNDS
S
263.5 94.4 62.2 92.4
Ga
p
[%] 2.30 0.72 0.07 0.30
N
oTR 1.8 32.0 56.0 15.8
N
oTOR 5.0 110.3 220.5 64.5
It must be noted that the computational process
was limited to five minutes of processing. Let the
symbol CT [s] denote the average computational
time. The second studied feature consists in the
average number of found solutions, which
approximate the original Pareto frontier. This result is
denoted by noNDSS. Since we do not consider it
useful to report the exact values of areas computed
according to (6), we evaluate the quality of
approximation by gap computed by (7). The column
denoted by NoTR reports the number of time runs and
NoTOR denotes the number of outer runs.
6 CONCLUSIONS
Bi-criteria optimization is crucial when the specifics
of a problem do not permit the use of a simple model
that minimizes only one objective function. A typical
example is the design of emergency medical services.
Operations researchers and other experts have
concentrated their efforts on the development of
heuristic methods that can approximate the optimal
Pareto frontier in a much shorter amount of time, as
the search for the optimal Pareto frontier has proven
to be an arduous endeavor. We provided numerical
experiment results for evaluating the quality of the
proposed algorithms. Based on the reported results, it
can be concluded that the proposed algorithm
substantially extends the state-of-the-art tools for
solving specific location problems involving the
optimization of two contradictory objectives.
Future research may concentrate on new
advanced algorithms that generate a close
approximation of the Pareto frontier or on modifying
certain existing techniques to obtain more precise
results. Application of self-learning methods to
parameter adjustment represents a fruitful research
direction.
ACKNOWLEDGEMENT
This work was financially supported by the following
research grants: VEGA 1/0216/21 “Designing of
emergency systems with conflicting criteria using
tools of artificial intelligence”, VEGA 1/0077/22
“Innovative prediction methods for optimization of
public service systems”, and VEGA 1/0654/22 “Cost-
effective design of combined charging infrastructure
and efficient operation of electric vehicles in public
transport in sustainable cities and regions”. This
paper was also supported by the Slovak Research and
Development Agency under the Contract no. APVV-
19-0441.
REFERENCES
Ahmadi-Javid, A., Seyedi, P. et al. (2017). A survey of
healthcare facility location, Computers & Operations
Research, 79, pp. 223-263.
Pareto Front Approximation by Ant Colony Optimization
205

Arroyo, J. E. C., dos Santos, P. M., Soares, M. S. and
Santos, A. G. (2010). A Multi-Objective Genetic
Algorithm with Path Relinking for the p-Median
Problem. In: Proceedings of the 12th Ibero-American
Conference on Advances in Artificial Intelligence,
2010, pp. 70–79.
Avella, P., Sassano, A., Vasil'ev, I. (2007). Computational
study of large scale p-median problems. Mathematical
Programming 109, pp. 89-114.
Bertsimas, D., Farias, V. F., Trichakis, N. (2011). The Price
of Fairness. In Operations Research, 59, 2011, pp. 17-
31.
Brotcorne, L, Laporte, G, Semet, F. (2003). Ambulance
location and relocation models. European Journal of
Operational Research, 147, pp. 451-463.
Buzna, Ľ., Koháni, M., Janáček, J. (2013). Proportionally
Fairer Public Service Systems Design. In:
Communications - Scientific Letters of the University
of Žilina 15(1), pp. 14-18.
Current, J., Daskin, M. and Schilling, D. (2002). Discrete
network location models, Drezner Z. et al. (ed) Facility
location: Applications and theory, Springer, pp. 81-118.
Doerner, K. F., Gutjahr, W. J., Hartl, R. F., Karall, M. and
Reimann, M. (2005). Heuristic Solution of an Extended
Double-Coverage Ambulance Location Problem for
Austria. Central European Journal of Operations
Research, 13(4), pp. 325-340.
Gendreau, M. and Potvin, J. (2010). Handbook of
Metaheuristics, Springer Science & Business Media.
Gopal, G. (2013). Hybridization in Genetic Algorithms.
International Journal of Advanced Research in
Computer Science and Software Engineering, vol. 3,
pp. 403–409.
Grygar, D., Fabricius, R. (2019). An efficient adjustment of
genetic algorithm for Pareto front determination. In:
TRANSCOM 2019: conference proceedings,
Amsterdam: Elsevier Science, pp. 1335-1342.
Ingolfsson, A., Budge, S., Erkut, E. (2008). Optimal
ambulance location with random delays and travel
times. Health care management science, 11(3), pp. 262-
274.
Janáček, J., Fabricius, R. (2021). Public service system
design with conflicting criteria. In: IEEE Access:
practical innovations, open solutions, ISSN 2169-3536,
Vol. 9, pp. 130665-130679.
Janáček, J. and Kvet, M. (2020). Adaptive Path-Relinking
Method for Public Service System Design. In: 38th
International Conference on Mathematical Methods in
Economics, Brno: Mendel University in Brno, 2020,
pp. 229-235.
Janáček, J., Kvet, M. (2021). Emergency Medical System
under Conflicting Criteria. In: SOR 2021 Proceedings,
pp. 629-635.
Janáček, J., Kvet, M. (2022a). Adaptive swap algorithm for
Pareto front approximation. In: ICCC 2022: 23rd
International Carpathian Control conference, Sinaia,
Romania, Danvers: IEEE, 2022, pp. 261-265.
Janáček, J., Kvet, M.. (2022b). Repeated Refinement
Approach to Bi-objective p-Location Problems. In:
INES 2022: Proccedings of the IEEE 26th International
Conference on Intelligent Engineering Systems 2022,
pp. 41-45.
Janáček, J., Kvet, M. (2022c). Pareto Front Approximation
using Restricted Neighborhood Search. In: Proceedings
of the 40th International Conference on Mathematical
Methods in Economics, 2022, Jihlava, pp. 141-147.
Jankovič, P. (2016). Calculating Reduction Coefficients for
Optimization of Emergency Service System Using
Microscopic Simulation Model. In: 17th International
Symposium on Computational Intelligence and
Informatics, pp. 163-167.
Jánošíková, Ľ. (2007). Emergency Medical Service
Planning. In: Communications - Scientific Letters of
the University of Žilina 9(2), pp. 64-68.
Jánošíková, Ľ. and Žarnay, M. (2014). Location of
emergency stations as the capacitated p-median
problem. In: Quantitative Methods in Economics
(Multiple Criteria Decision Making XVII). pp. 117-
123.
Kvet, M. (2014). Computational Study of Radial Approach
to Public Service System Design with Generalized
Utility. In: Digital Technologies 2014, Žilina, Slovakia,
pp. 198-208.
Kvet, M. (2018). Advanced radial approach to resource
location problems. In: Developments and advances in
intelligent systems and applications. Cham: Springer
International Publishing, 2018, Studies in
computational intelligence, 718, pp. 29-48.
Kvet, M., Janáček, J. (2022). Directed Search for Pareto
Front Approximation with Path-relinking Method. In:
Proceedings of the 40th International Conference on
Mathematical Methods in Economics, 2022, Jihlava,
pp. 212-217.
Marianov, V. and Serra, D. (2002). Location problems in
the public sector, Facility location - Applications and
theory (Z. Drezner ed.), Berlin, Springer, pp 119-150.
ICORES 2024 - 13th International Conference on Operations Research and Enterprise Systems
206
