
Anywhere on Earth: A Look at Regional Characteristics of DRDoS
Attacks
Tiago Heinrich
1 a
, Newton C. Will
2 b
, Rafael R. Obelheiro
3 c
and Carlos A. Maziero
1 d
1
Computer Science Department, Federal University of Paraná, Curitiba, 81530–015, Brazil
2
Computer Science Department, Federal University of Technology, Paraná, Dois Vizinhos, 85660–000, Brazil
3
Computer Science Department, State University of Santa Catarina, Joinville, 89219–710, Brazil
Keywords:
Amplification Attacks, Network Characterization, Distributed Reflection Denial of Service.
Abstract:
By observing new trends in distributed reflection denial of service (
DRDoS
) attacks, it is possible to highlight
how they have adapted over the years to better match the attackers’ goals. However, the geolocation character-
istics of this type of attack have not been widely explored in the literature and could show new information
about these attacks. Considering this gap, we use data collected by honeypots over the last four years to better
understand what can be gleaned from attacks targeted at different continents and countries. This dataset also
enables us to investigate how attackers interact with reflectors, and how such interactions vary according to the
location of victims.
1 INTRODUCTION
Distributed reflection denial of service (DRDoS) at-
tacks are a well-known variation of distributed denial
of service (DDoS) attacks that rely on bouncing traffic
off third-party systems (reflectors) to amplify the size
of messages sent to victims (Paxson, 2001). Reflec-
tion attacks leverage connectionless protocols, most
prominently UDP (User Datagram Protocol) (Rossow,
2014).
Attackers scan the Internet to find open reflectors,
i.e., systems that answer requests from indiscriminate
source addresses. This process is quite optimized and,
after a system is identified as a reflector, usually no
further checks are performed. In some cases, attackers
send requests to reflectors regardless of whether they
are online or offline.
A honeypot (Spitzner, 2003) allows attackers to
interact with a seemingly compromised or vulnerable
system that will store any interaction for later evalua-
tion of attacker behavior. Our work uses data collected
from honeypots with the goal of better understanding
how attackers interact with reflectors.
The characterization of
DRDoS
attacks has re-
a
https://orcid.org/0000-0002-8017-1293
b
https://orcid.org/0000-0003-2976-4533
c
https://orcid.org/0000-0002-4014-6691
d
https://orcid.org/0000-0003-2592-3664
ceived attention in the research literature, leveraging
both data collected by honeypots (Krämer et al., 2015;
Thomas et al., 2017; Heinrich et al., 2021) and traf-
fic flows observed at Internet exchanges (Kopp et al.,
2021). So far, however, the geolocation of attack vic-
tims has been taken into account only superficially
(Heinrich et al., 2022). This paper aims to bridge this
gap, comparing and contrasting DRDoS attacks across
different continents and countries.
We present an evaluation from data collected by
four honeypots over four years. This evaluation consid-
ers the characteristics of the attacks observed, the par-
ticularities of some attacks, and what type of payload
attackers use. Our objective is to ascertain differences
among attacks when considering the geolocation of
victims.
The main contributions of this work are:
•
A study focused in the relevance of geolocation of
DRDoS attacks;
•
An evaluation considering the impact of DRDoS
attacks in each continent; and
•
An investigation of external factors that are corre-
lated to DRDoS attacks.
The remainder of this paper is organized as fol-
lows. Section 2 presents DRDoS concepts. Section 3
describes our objectives and data sources. Section 4
presents the data analysis. Section 5 reviews related
work, and Section 6 concludes the paper.
Heinrich, T., Will, N., Obelheiro, R. and Maziero, C.
Anywhere on Earth: A Look at Regional Characteristics of DRDoS Attacks.
DOI: 10.5220/0012252700003648
Paper published under CC license (CC BY-NC-ND 4.0)
In Proceedings of the 10th International Conference on Information Systems Security and Privacy (ICISSP 2024), pages 21-29
ISBN: 978-989-758-683-5; ISSN: 2184-4356
Proceedings Copyright © 2024 by SCITEPRESS – Science and Technology Publications, Lda.
21

2 DRDoS
DRDoS attacks extend DDoS attacks by including
IP spoofing while making the attack more complex.
Fig. 1 depicts a DRDoS attack (Paxson, 2001). The
attacker creates several requests with spoofed source
IP addresses, i.e., with the victim’s IP address being
used as the source address. This flood of requests is
sent to network services that amplify traffic by gener-
ating responses that are larger than the corresponding
requests. DRDoS attacks give attackers two advan-
tages over plain DDoS: (i) the use of IP spoofing hides
the origin of attack traffic, making it harder to identify
and eradicate bots; and (ii) the amplification reduces
the amount of traffic that has to be sent to reflectors in
order to inflict damage on the victim.
Attacker
Bots
Reflector
Reflector
Reflector
Reflector
Reflector
Extra Layer
of Indirection
Traffic
Amplification
Victim
Figure 1: Scheme of a DRDoS attack.
Reflectors are a key cog in DRDoS attacks. They
are not controlled by the attacker, but vulnerable or
misconfigured systems that are abused. The attacks
are often directed by booter (DDoS-for-hire) services,
which routinely scan the Internet looking for new re-
flectors to use (and, occasionally, to retire reflectors
that are no longer functional) (Krupp et al., 2017). The
main criteria for choosing reflectors are their availabil-
ity on the Internet and the amplification they provide.
DRDoS attacks may leverage various protocols
(Paxson, 2001; Rossow, 2014). A common choice
are UDP-based protocols; the connectionless nature of
UDP makes it easy to reflect traffic using IP spoofing,
and the fact that requests often elicit (much) larger
responses provide amplification. UDP-based attacks
can amplify traffic by a factor of up to 500
×
, making
them a major threat (Rossow, 2014).
TCP-based DRDoS attacks are less common due
to the three-way handshake used in this protocol and
the limited amplification available. Despite that, it
is possible to perform DRDoS attacks exploiting the
TCP handshake (Ismail et al., 2021).
In a DRDoS attack it is difficult both to mitigate
the attack and to identify the attacker. Mitigation is
a challenge since the reflectors can also originate le-
gitimate traffic. Indiscriminately filtering traffic from
the reflectors will harm these legitimate requests. In
addition, the identification of the attacker is even more
complicated than in conventional DDoS attacks, due
to the need to find out which bots are sending traffic
to the reflectors before trying to track down who is
controlling those bots (which often involves more than
one layer of nodes, typically in different networks and
jurisdictions).
3 OBJECTIVES AND DATA
SOURCES
Our goal is to evaluate the interactions with the honey-
pots considering victims by continent. Over the years
our honeypot instances collected data from attacks that
were carried out all over the world. We intend to eval-
uate traffic patterns and attacker behaviors in order to
compare them to results from the literature and present
which changes have been observed in the last decade.
MP-H is a honeypot that mimics a DRDoS reflec-
tor and supports nine UDP-based protocols: Char-
gen, CLDAP, CoAP, DNS, Memcached, NTP, QOTD,
SSDP, and Steam (used in online gaming) (Heinrich
et al., 2021). Previously, this honeypot was used to
study multiprotocol attacks and attacks that target mul-
tiple addresses in the same Classless Inter-Domain
Routing (
CIDR
) block rather than a single host (known
as carpet bombing attacks).
Our study uses data from four MP-H honeypots in
different locations in South America, making possible
to observe behaviors in distinct networks. Data was
collected from 2018/09/24 to 2023/02/11, a period of
1,602 days (4 years and 4 months). Attack traffic was
recorded in 1,550 of the 1,602 days; the 52 days with-
out traffic include three days at the beginning (when
the first honeypot had not been discovered yet) and
49 days with machine and/or network outages. During
this period, the number of honeypot instances grew
from one to four, with a couple of protocols added in
2020. Since a honeypot observes only part of an attack
(it is one of possibly many reflectors used in the attack),
we need a heuristic definition to associate the observed
traffic with attacks. To account for multiprotocol and
carpet bombing attacks as discussed in (Heinrich et al.,
2021), we follow their definition of (monoprotocol)
attack, which is “a set of five or more requests with
source IP addresses belonging to the same CIDR block
(a victim) and the same destination UDP port, in which
consecutive requests are at most 60 seconds apart.”
ICISSP 2024 - 10th International Conference on Information Systems Security and Privacy
22

4 DATA ANALYSIS
Since DRDoS attacks use IP spoofing, the source IP
addresses of the requests were assumed to be from the
victims. These addresses were geolocated using the
MaxMind database
1
. As this resulted in victims in
more than 230 different countries and analyzing every
country would be unwieldy, we focused on the coun-
tries with the highest number of attacks. We consid-
ered the countries with at least 10% of attacks in each
continent. This criterion allows including the most
relevant countries in each region, even if they have
relatively few attacks compared to countries in regions
with heavier traffic. Dividing victims by continent
allows (i) isolating behaviors that could be obscured
when looking only at overall traffic, and (ii) highlight-
ing differences between regions.
4.1 Geographic Distribution
Table 1 shows an overview of the data collected by
the honeypots, presenting the distribution according to
each geographic location. Six continents are presented,
as the MaxMind database associates IP addresses from
Central American countries with North America (
NA
)
or South America (
SA
), depending on the country.
Addresses that could not be geolocated were labeled
as “unknown”; such addresses account for 0.25% of
the attacks, and were excluded from the analysis.
The overall number of attacks observed in North
America (
NA
) is higher than in any other region, fol-
lowed by Asia (
AS
) and Europe (
EU
) with similar
numbers of attacks. Other regions received a relevant
number of attacks, however not in the same propor-
tion. Brazil (
BR
), China (
CN
), Hong Kong (
HK
), and
the United States (
US
) have a higher concentration
in the number of attacks compared to other countries,
and this behavior influences their respective continents.
This observation was already expected since other stud-
ies already showed a concentration of attacks in these
continents (Heinrich et al., 2021; Krämer et al., 2015).
Regarding the number of requests for each region,
Asia is the region with the higher concentration of re-
quests, despite
NA
having a higher concentration of
attacks. This difference between attacks and requests
shows that, from our vantage point,
AS
receives at-
tacks with a higher number of requests in comparison
with attacks in other continents. The same pattern ap-
pears when we consider the number of requests per
attack in each region. Regions such as
AS
, Africa (
AF
),
SA
, and Oceania (
OC
) appear to have fewer attacks
with a higher number of requests in comparison to
regions such as
NA
and
EU
. Even if we only consider
1
https://dev.maxmind.com/geoip
the median,
AS
and
OC
still present this pattern. In
AF
and
SA
the pattern disappears, and there is a smaller
number of attacks that concentrate a high number of
requests.
AF
has the lowest number of attacks per day
in comparison with the other regions.
Some discussions about the geolocation of DRDoS
victims are found in the literature. In (Krämer et al.,
2015) the authors observed the
US
with 32.2% of their
victims, followed by
CN
(14.2%) and France (
FR
)
(8.5%). A 2017 report from Akamai (Akamai, 2017)
shows that the
US
was the country with the most at-
tacks (over 238 M attacks, 11
×
bigger than the second-
placed country), followed by
BR
and the United King-
dom (
UK
). According to Netscout, in 2021 the
US
,
CN
, and Germany (
DE
) were the countries with more
UDP reflectors available (Netscout, 2021b). Similar
results are presented in (Heinrich et al., 2021), with
the only change being the
UK
coming in third place.
While
US
and
CN
consistently appear atop the rank-
ings, the countries that come next vary according to the
year of observation. The war in Ukraine has also seen
changes in the attacks seen in Ukraine and Russia, with
media and financial companies being targeted (Cloud-
flare, 2022). Cloudflare reported increased frequency
and duration of large attacks in the fourth quarter of
2022, as well as the continued growth of ransom DDoS
attacks (Cloudflare, 2023).
Our observations show that 82.6% of attacks are
shorter than 10 min, 89.9% are shorter than 30 min,
and 93.0% are shorter than 1 hour. Median attack
durations are lower than the respective means, with
medians for all continents below 4.8 min. Therefore,
most observed attacks have a short duration, lasting
only a few minutes; durations have not changed much
over the years. The average duration across the conti-
nents is similar, except for
SA
, where it is noticeably
longer. In the literature, the average duration observed
varies, as summarized in Table 2. The average dura-
tions found in studies using honeypot data (Krämer
et al., 2015; Thomas et al., 2017; Jonker et al., 2017;
Heinrich et al., 2021) are similar to our data (excluding
SA).
To account for carpet bombing (CB) attacks, we
define a victim to be a /24 CIDR block; as such, at-
tacks targeting, e.g., 192.0.2.1 and 192.0.2.4 in the
same time frame are counted as a CB attack targeting
192.0.2.0/24, which is the victim here. In
SA
we ob-
served that, on average, attacks targeted nine unique
IP addresses per victim, and 50.0% of the attacks used
carpet bombing. In the other regions, the vast majority
of attacks are aimed at a single IP address. CB attacks
have grown in SA by an average of 7.1% each year,
with a remarkable increase of 29.5% in 2022 alone. As
our honeypots are located in
SA
, it is possible that CB
Anywhere on Earth: A Look at Regional Characteristics of DRDoS Attacks
23

Table 1: Data broken down by continent. Starred cells show average/median. For requests, B=Billion and M=Million.
Asia Africa Europe
North
America
South
America
Oceania
Overall
Attacks 908,224 26,074 763,010 1,601,299 401,379 72,984
Requests 29.7 B 546.2 M 12.8 B 25.5 B 15.7 B 1.5 B
Duration (sec)
∗
1,335 / 40 1,531 / 74 984 / 150 1,091 / 174 29,604/289 753 / 161
Per Attack
Requests
∗
32,725 / 1,713 20,947 / 336 16,819 / 470 15,930 / 643 39,220 / 124 20,337 / 866
Target IP addresses (avg) 2.3 1.6 1.5 1.2 8.9 1.0
Protocols (avg) 1.3 1.0 1.1 1.1 2.5 1.1
Most used protocol NTP (42.8%)
CLDAP
(33.3%)
DNS (32.3%)
CLDAP
(40.2%)
DNS (58.7%)
CLDAP
(47.1%)
Attacks w/ 10M+ reqs 193 2 100 77 251 7
Countries 12 1 21 3 2 2
Per Request
Most used protocol
CLDAP
(42.6%)
NTP (41.3%)
Chargen
(42.1%)
CLDAP
(46.6%)
CLDAP
(79.4%)
CLDAP
(59.8%)
Other
Carpet bombing attacks 23,467 (2.5%) 319 (1.2%) 10,088 (1.3%) 23,339 (1.4%)
200,875
(50.0%)
195 (0.2%)
Attacks per day
∗
567 / 231 16.3 / 4 476 / 263 1000 / 576 251 / 34 45.6 / 26
Attacks per day (𝑄
3
) 473 13 607 1120 98 53
Attacks w/ 1 protocol 897,906 25,880 752,191 1,579,833 377,923 71,138
Attacks w/ > 1 protocol 10,318 194 10,819 21,466 23,456 1,846
Annual growth
∗
0.7% / −0 .3% 1.2% / 0.5% 1.6% / 0.1% 1.3% / −0.1% 3.5% / 1.0% 0.5% / 0.4%
Table 2: Results from the literature about the duration of DRDoS attacks.
Type of data source Reported duration
(Krämer et al., 2015) 21 honeypots,
1.5 M attacks
62% of the attacks observed are shorter than 15 min
(Thomas et al., 2017) Between 20 and
65 honeypots, 5.1 M attacks
50% of the attacks observed are shorter than 10.97 min, and 90% of attacks last
less than 35.67 min
(Jonker et al., 2017) UCSD Network
Telescope and AmpPot DDoS honey-
pots, 20 M attacks
50% of the attacks are shorter then 4.2 min, with the top 10% of attacks lasting
40 min or more; Overall mean duration of 18 min
(Heinrich et al., 2021) 1 honeypot, 1.4 M
attacks
Median duration of attacks is 10 min for attacks using only one protocol, and
44.5 min for multiprotocol attacks
(Kopp et al., 2021) IPFIX flow data from
an European Internet Exchange Point
(IXP) (1.3T+ flows)
Mean durations for 11 protocols between 4.7 and 30 min (duration data is
reported per protocol)
(Our observation, 2023) 4 honeypots
across different locations, 3.7 M attacks
Mean duration observed for the continents ranges from a minimum of 12.5 min
and a maximum of 8.2 hours
attacks have a preference for reflectors located closer
to the victims. Compared to other results in the liter-
ature, 6.8% of the attacks in our dataset were carpet
bombing, while Heinrich et al. (Heinrich et al., 2021)
reported a smaller fraction of 3.7%. This nearly 84%
increase in the fraction of CB attacks suggests that
these attacks, although still far from being dominant,
are becoming more popular.
We also found that attacks tend to use a single pro-
tocol: only 1.8% of the attacks in our dataset involved
multiple protocols. In contrast, Kopp et al. (Kopp
et al., 2021) found that 24% of their victims were at-
tacked by more than one protocol, while Heinrich et al.
(Heinrich et al., 2021) observed that 0.95% of a total
of 1.4 million attacks involved more than one protocol
(2.9% of 1.1 million victims). We can conclude that
DRDoS attacks with multiple protocols remain in the
minority.
ICISSP 2024 - 10th International Conference on Information Systems Security and Privacy
24

The predominant protocol by region varies. In
AS
, Network Time Protocol (
NTP
) is the predominant
protocol, with 42.8% of the attacks (this evaluation
considers attacks with only one protocol). Domain
Name System (
DNS
) is prevalent in
EU
and
SA
, with
32.3% and 58.7% of the attacks, while Connection-
less Lightweight Directory Access Protocol (
CLDAP
)
is prevalent in
AF
,
NA
, and
OC
, with 33.3%, 40.2%,
and 47.1% of the attacks respectively. In
EU
,
DNS
requests represent only 0.9% of the requests, while
CLDAP accounts for 42.1%. In
SA
,
DNS
requests
represent only 1.6% of the requests for the region, in
contrast to 79.4% of
CLDAP
requests. Overall,
NTP
and
CLDAP
appear to be the most popular protocols
for these regions. Although the numbers of attacks
and requests per protocol are correlated, in four of
the six continents the protocols with the most attacks
are not the same with the most requests; the excep-
tions are
NA
and
OC
, where CLDAP leads in both
attacks and requests. The ratio between requests and
attacks represents attack intensity: a fraction of re-
quests higher/lower than the fraction of attacks means
more/less intense attacks.
A closer look at the biggest attacks showed that 648
attacks (0.01% overall) had more than 10M requests
each. These attacks are limited to a few countries that
are unevenly distributed across the continents.
AS
and
EU
present the highest number of countries with heavy
attacks, 12 and 21 respectively. Other continents had
at most two countries with attacks of this proportion.
However, AS and EU concentrated 45.2% of these at-
tacks. Also, 38.7% of these attacks were concentrated
in
SA
, and 90.8% of the attacks were classified as
carpet bombing.
4.2 Evaluation of Top Countries
To present a finer-grained view of DRDoS attacks,
in this section we characterize attack traffic for the
12 countries with more than 10% of the attacks in their
respective continent (Table 3).
When comparing the number of attacks with tar-
get IP addresses, it is possible to highlight that most
countries have similar numbers. This means that most
attacks target a single IP address within a CIDR block,
and few victims are attacked multiple times. This pat-
tern was observed in previous studies (Heinrich et al.,
2021). Countries that deviate from this behavior are
BR
, Egypt (
EG
),
DE
, and South Africa (
ZA
). These
countries have a higher number of target IP addresses
in comparison to the number of attacks, suggesting a
higher incidence of carpet bombing attacks.
Regarding the observation period, only South
Africa (
ZA
), Egypt (
EG
), and New Zealand (
NZ
) have
less than 1,300 days with attacks. Considering that
traffic was observed in 1,550 days, it can be inferred
that, in most of the analyzed countries, attacks were
recorded almost every day.
With this overview, it is possible to see the concen-
tration of victims in certain continents.
NA
,
SA
, and
OC
had a single country with more than 87% of the
attacks observed for that respective region. Compared
to previous results, Akamai reported that in 2014
US
,
CN
, and
DE
accounted for more than 60% of the at-
tack traffic (Akamai, 2015); in 2016,
BR
replaced
DE
as the third-ranked country (Akamai, 2016). Netscout
showed
US
,
HK
, and
ZA
as the top target countries in
2017 (Netscout, 2021a). The
US
appears consistently
as the top target in all reports. In general, countries that
receive more attacks have richer Internet ecosystems,
with more services and more traffic.
It is also interesting to evaluate how these attacks
are occurring in the top countries. Figure 2 presents the
empirical cumulative distribution of DRDoS attacks
per day. In general, the distributions are right-skewed;
most days have few attacks, with a small fraction of
days being unusually intense. The medians for the
two leading countries are 504 (
US
) and 75 (
CN
). Five
clusters may be identified in the graph:
1. EG
,
NZ
, and
ZA
have fewer than seven attacks
per day on average, and between 60% and 80% of
days with less than ten attacks;
2.
Australia (
AU
) and Brazil (
BR
) have a daily av-
erage of attacks between 39 and 222, with a
3
rd
quartile (𝑄
3
) of 47 and 55, respectively;
3. FR
,
UK
and Singapore (
SG
) have an average num-
ber of attacks per day between 65 and 101.
FR
and
UK
have a
𝑄
3
close to their average daily attacks.
The empirical distribution starts to show a longer
tail in this group;
4. CN
and
DE
have higher
3
rd
quartiles, with 192
and 92 respectively, and daily averages observed
of 139 and 69;
5. HK
and
US
show an elongated tail in the 15–20%
of the highest values of the distribution. When
considering the 25% of the days with the most
attacks, a
𝑄
3
of 55 and 1001, and a 95th percentile
of 710 and 3,223, respectively, are observed.
Other relevant findings are:
• CN
and
SG
have a higher number of requests per
attack than the other countries;
•
The biggest yearly increases in number of attacks
were observed in 2021 for
SG
(15.5%) and
HK
(15.6%); and
•
Carpet bombing attacks in
BR
often target small
Internet service providers.
Anywhere on Earth: A Look at Regional Characteristics of DRDoS Attacks
25
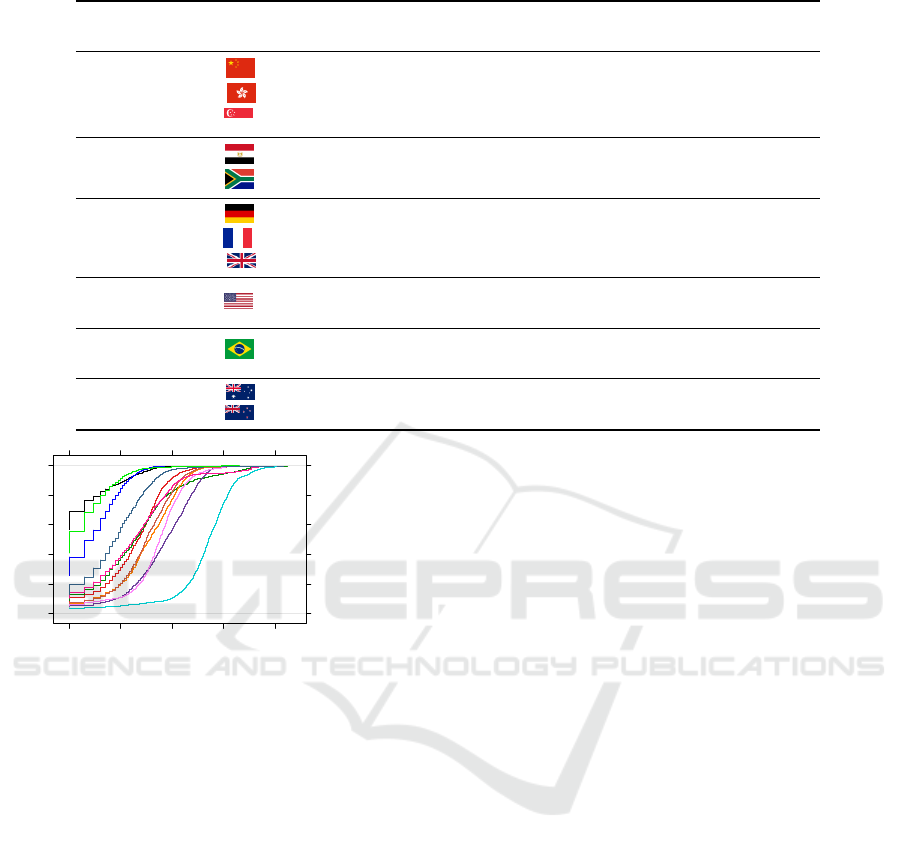
Table 3: Countries with more than 10% of attacks in each continent.
Continent
Country – (%)
Attacks Requests
Target
IP addresses
Days
with attacks
Asia
CN – 24.5 222,801 7,103,386,287 141,412 1,532
HK – 36.4 330,611 11,788,746,454 247,225 1,437
SG – 16.4 149,187 5,740,627,944 40,828 1,398
Africa
EG – 25.5 6,670 17,928,106 7,397 693
ZA – 46.4 12,115 446,364,008 22,382 946
Europe
DE – 14.5 110,666 2,130,177,675 133,766 1,516
FR – 13.7 104,679 1,106,771,615 71,278 1,513
UK – 21.2 162,485 2,847,475,529 120,499 1,522
North
America
US – 90.0 1,441,685 23,337,827,695 999,628 1,547
South
America
BR – 88.7 356,367 15,025,743,173 1,227,745 1,463
Oceania
AU – 87.2 63,647 1,265,038,060 43,749 1,477
NZ – 11.9 8,708 214,884,195 6,760 1,192
Attacks per day
Fn(x)
0.0
0.2
0.4
0.6
0.8
1.0
10^0 10^1 10^2 10^3 10^4
Australia (AU)
Brazil (BR)
China (CN)
Germany (DE)
Egypt (EG)
France (FR)
Great Britain (GB)
Hong Kong (HK)
New Zealand (NZ)
Singapore (SG)
United States (US)
South Africa (ZA)
Figure 2: Empirical cdf of DRDoS attacks per day (
𝑥
axis in
log scale).
We also evaluated the annual growth of attacks for
each country and found it to be low overall. Of the
12 countries, only
SG
,
EG
, and
BR
grew more than
3% per year.
4.3 The Impact of External Factors
Although the intensity of DRDoS attacks in each coun-
try has periods of more and less intense traffic, often
in bursty fashion, some of the countries in Table 3 ex-
hibited periods where the number of attacks observed
was noticeably higher than in the preceding and suc-
ceeding periods. Given that our data collection period
coincided with major events that had a direct influ-
ence on the growth of DRDoS attacks (Heinrich et al.,
2021; Netscout, 2021b), such as the COVID-19 pan-
demic and the Russian invasion of Ukraine in 2022,
we attempted to identify, for each country, anomalous
periods that were noticeably different from its usual
attack pattern, and to correlate such periods with exter-
nal factors that may have contributed to the increased
DRDoS activity. This section reports our findings.
The Russian invasion of Ukraine in February 2022
was a major development in the Russo-Ukrainian war
that began in 2014 (The Economist, 2022). Between
2020 and 2021, we saw a 29.5% growth in the number
of attacks in Ukraine. Between 2022 and 2023, we
observed a growth of 42.7% in the number of attacks
against Ukraine in comparison with the previous year.
Attacks against Russia also grew 110% over the same
time frame.
On January 6
th
, 2021, the US Capitol was invaded
by supporters of Donald Trump in the aftermath of his
defeat in the 2020 presidential election (Griffin, 2021).
DRDoS attacks against victims in the US grew 44.4%
on this day, compared to the preceding days. This high-
intensity period continued until the 11
th
, when a drop
of 45.1% was observed in the number of attacks (i.e.,
the observations returned to normal). If we compare
the number of attacks observed in this period with
what was observed in the same days of 2020, we see
an increase of 2,301.2%. Comparing the attacks for the
whole months of January 2020 and 2021, we observe a
similar increase in the number of attacks of 1,864.6%.
In Australia, the largest increase in the number
of attacks was observed in July 2019, 210% over
the preceding period. This coincides with Talisman
Saber, a joint military training exercise with the US
(AustraliaNaviation, 2019). Significant increases in
the number of attacks were also observed in Au-
gust and December 2020, right after the adoption of
more stringent COVID-19 measures in some provinces
(Saunokonoko, 2020; Brown and McMah, 2020), and
in September 2021, when there were protests against
ICISSP 2024 - 10th International Conference on Information Systems Security and Privacy
26

mandatory COVID-19 vaccination (7News, 2021; Sey-
fort and Zagon, 2021). 62.4% of the attacks in 2022
were concentrated between April 7
th
and 24
th
, a period
of electoral campaigning (Murphy and Butler, 2022).
In Great Britain, we observed a noticeable surge
in attacks for a period of 19 days between July and
August 2019, an increase of 2,411% over the preced-
ing two months. This period was marked by political
instability, including the resignation of Prime Minis-
ter Theresa May (announced on May 24
th
) and the
election of Boris Johnson as the new leader of the Con-
servative Party (between July 6
th
and 22
nd
) and his
subsequent appointment as Prime Minister (he took
office on July 24
th
) (Mills, 2019). After this period,
the number of attacks returned to the previous levels.
It is reasonable to question whether the links be-
tween attacks and external factors presented in this
section are sufficient to establish causality or merely
that they are correlated. This question is moot, how-
ever. Firstly, we do not aim to establish a causal link
between the external factors and the observed attacks,
as the available data are insufficient for such inference.
Secondly, the correlation between the events may be
enough for organizations to take additional precaution-
ary measures (such as acquiring or improving anti-
DDoS services) in periods of political volatility and
social commotion, for instance.
4.4 Discussion
Using the location of victims as a factor in the analy-
sis of DRDoS attacks reveals differences in behavior.
The number, duration and intensity of attacks vary
according to the geolocation, both across continents
and across countries within the same continent. We
also noticed differences in protocol preferences across
regions. Carpet bombing attacks appear concentrated
in SA.
Evaluating the countries with more attacks in each
continent, we note that the number of attacks for most
days is low, but short periods with noticeable increases
in the number of attacks appear often. External factors
such as political instabilities and the COVID-19 pan-
demic appear to have influenced the growth of DRDoS
attacks in some periods.
The ShadowServer Foundation routinely scans
the IPv4 address space looking for open reflec-
tors that may be exploited in DRDoS attacks
(
ShadowServer Foundation
, 2014). Table 4 shows the
daily average of open reflectors that were found be-
tween March 13
rd
2022 and March 13
rd
2023, consider-
ing only the protocols that appear in Table 1. Protocols
for which we have seen high volumes of traffic, such as
Chargen and CLDAP, had relatively few reflectors; for
instance, Table 1 shows that, in our dataset, CLDAP
had the most attacks in
AS
,
OC
,
NA
, and
SA
, but,
according to Table 4, the ratio of CLDAP to NTP re-
flectors was between 0.31% and 1.4%, according to the
continent. The protocols with many reflectors, such
as DNS and NTP, had smaller volumes in our dataset
(except for NTP in Africa). Therefore, regional reflec-
tor availability does not seem to strongly influence the
protocol used in DRDoS attacks. However, the high
incidence of
CLDAP
and Chargen attacks suggests
that the amplification factor provided by a protocol
matters more than resource availability.
A limitation of this study is the possible inaccuracy
of geolocation data. It is unfeasible to manually verify
the accuracy of the locations given by the MaxMind
database due to the sheer number of victims. Con-
tent distribution networks and cloud/hosting providers,
whose IP addresses may be geolocated to the corpo-
rate headquarters even when they are located or host
contents originated in other regions, constitute a par-
ticularly sensitive case. It is hard to circumvent this
limitation, given that the attack traffic observed by re-
flectors carries no identification of the intended target,
so we have no choice other than relying on the geolo-
cation of IP addresses associated with victims. On the
other hand, if attacks are counted in the wrong country,
this would mostly affect the identification of external
factors in Section 4.3, but should not drastically skew
the statistics, and consequently have little impact on
the other findings in the paper.
5 RELATED WORK
To the best of our knowledge, this is the first study
that focuses on the victims of DRDoS attacks and
their locations. Heinrich et al. (Heinrich et al., 2021)
previously discussed the most attacked countries su-
perficially, but have not gone into detail on how these
attacks can be distributed and what are the impacts of
the victims’ geolocation.
While we have analyzed DRDoS traffic as ob-
served by reflectors, Kopp et al. (Kopp et al., 2021) and
Subramani et al. (Subramani et al., 2021) analyzed
traffic from the vantage point of Internet Exchange
Points (IXPs). Compared to a honeypot mimicking
a reflector, an IXP can provide a fuller view of DR-
DoS attacks against victims accessed via the IXP, such
as more accurate estimates of attack intensity and du-
ration. On the other hand, the victims that can be
observed in an IXP may be a much narrower set than
those observed by a reflector. As such, the geolocation
of victims was not an important factor in (Kopp et al.,
2021; Subramani et al., 2021).
Anywhere on Earth: A Look at Regional Characteristics of DRDoS Attacks
27

Table 4: Daily average of open reflectors between 2022/03/13 and 2023/03/13.
Protocol Asia Africa Europe
North
America
South
America
Oceania
Chargen 18.9 k 192 4.6 k 2.2 k 551 61
CLDAP 3.1 k 649 3.1 k 3.3 k 2 k 149
CoAP 289.8 k 28 3.5 k 13 k 2.8 k 51
DNS 1.2 M 100.6 k 225.9 k 183.9 k 122.9 k 11.9 k
Memcached 17.6 k 146 4.8 k 5.8 k 539 90
NTP 676.5 k 48.8 k 556.9 k 507.9 k 142.3 k 48.6 k
QOTD 23.3 k 234 1.4 k 1.7 k 430 128
SSDP 745.9 k 34.9 k 121.4 k 68.4 k 239 k 3.8 k
Source: https://dashboard.shadowserver.org/statistics/combined/visualisation/
A geolocation analysis of DDoS attacks is carried
out in (Wang et al., 2018), showing that the sources
of attacks follow a geospatial distribution pattern, en-
abling the prediction of future attacks from known
botnet families. The authors in (Wang et al., 2020)
show that each botnet family has its geolocation pref-
erences, with fewer botnets covering a large number
of countries.
6 CONCLUSION
DRDoS attacks can be studied using data collected by
honeypots that mimic vulnerable servers that can be
abused for traffic reflection. The literature focuses on
strategies and types of attacks, with little concern for
the influence exerted by the victims’ geolocation. This
paper uses data from four honeypots to characterize
DRDoS attack traffic taking into account the location
of DRDoS victims. We analyze several features across
continents and also across countries that receive 10%
or more of the attacks in each continent. We highlight
regional differences in attack volume and intensity, as
well as in protocol popularity, and discuss external
factors that may have led to unusually intense peri-
ods in some target locations. Our findings show that
DRDoS attacks across the globe exhibit meaningful
differences, which may be considered when develop-
ing and deploying defensive measures. In future work,
we intend to analyze the evolution of attack payloads
over the years, and compare them across geographical
regions.
ACKNOWLEDGEMENTS
This study was financed in part by the Coordenação de
Aperfeiçoamento de Pessoal de Nível Superior – Brasil
(CAPES) – Finance Code 001 and Fundação de Am-
paro à Pesquisa e Inovação do Estado de Santa Cata-
rina (FAPESC). The authors also thank the UDESC,
UFPR and UTFPR Computer Science departments.
REFERENCES
7News (2021). Snap two-week shutdown of construction
industry confirmed after violent Melbourne protest.
https://bit.ly/3xAhKYx.
Akamai (2015). Akamai’s state of the Internet security / Q4
2014. Technical report, Akamai Technologies, Inc.
Akamai (2016). Akamai’s state of the Internet security / Q1
2016. Technical report, Akamai Technologies, Inc.
Akamai (2017). Akamai’s state of the Internet security / Q1
2017. Technical report, Akamai Technologies, Inc.
AustraliaNaviation (2019). Exercise Talisman Sabre for-
mally launched on USS Reagan. https://bit.ly/3n0bH
Yo.
Brown, N. and McMah, L. (2020). NSW What northern
beaches outbreak means for Christmas borders. https:
//bit.ly/3Ol9hjn.
Cloudflare (2022). DDoS attack trends for 2022 Q2. https:
//blog.cloudflare.com/ddos-attack-trends-for-2022-q
2/.
Cloudflare (2023). Cloudflare DDoS threat report for 2022
Q4. https://blog.cloudflare.com/ddos-threat-report-2
022-q4/.
Griffin, D. (2021). Assault on democracy paths to insurrec-
tion. https://cnn.it/3NfcNug.
Heinrich, T., Maziero, C. A., Will, N. C., and Obelheiro,
R. R. (2022). How drdos attacks vary across the globe?
In Proceedings of the 22nd ACM Internet Measurement
Conference, pages 760–761.
Heinrich, T., Obelheiro, R. R., and Maziero, C. A. (2021).
New kids on the DRDoS block: Characterizing mul-
tiprotocol and carpet bombing attacks. In Intl Conf
on Passive and Active Network Measurement, Cottbus,
Germany. Springer.
Ismail, S., Hassen, H. R., Just, M., and Zantout, H. (2021).
A review of amplification-based distributed denial of
service attacks and their mitigation. Computers &
Security, 109.
Jonker, M., King, A., Krupp, J., Rossow, C., Sperotto, A.,
and Dainotti, A. (2017). Millions of targets under
attack: A macroscopic characterization of the DoS
ICISSP 2024 - 10th International Conference on Information Systems Security and Privacy
28

ecosystem. In Internet Measurement Conf, London,
UK. ACM.
Kopp, D., Dietzel, C., and Hohlfeld, O. (2021). DDoS
never dies? an IXP perspective on DDoS amplification
attacks. In Intl Conf on Passive and Active Network
Measurement, Cottbus, Germany. Springer.
Krämer, L., Krupp, J., Makita, D., Nishizoe, T., Koide, T.,
Yoshioka, K., and Rossow, C. (2015). AmpPot: Mon-
itoring and defending against amplification DDoS at-
tacks. In Intl Sym on Recent Advances in Intrusion
Detection, Kyoto, Japan. Springer.
Krupp, J., Karami, M., Rossow, C., McCoy, D., and Backes,
M. (2017). Linking amplification DDoS attacks to
booter services. In Proc. 20th Intl. Res. Symp. on
Attacks, Intrusions, and Defenses (RAID), pages 427–
449, Atlanta, GA.
ShadowServer Foundation
(2014). The scannings will con-
tinue until the Internet improves. https://www.shadow
server.org/news/the-scannings-will-continue-until-t
he-internet-improves/.
Mills, J. (2019). New prime minister will be announced on
July 23. https://bit.ly/3HLz8hJ.
Murphy, K. and Butler, J. (2022). Anthony Albanese com-
mits to anti-corruption watchdog by end of 2022, if
Labor wins election. https://bit.ly/3O3HrrB.
Netscout (2021a). NETSCOUT Arbor’s 13th annual world-
wide infrastructure security report.
Netscout (2021b). Netscout Threat Intelligence Report 1H
2021.
Paxson, V. (2001). An analysis of using reflectors for dis-
tributed denial-of-service attacks. ACM SIGCOMM
Computer Communication Review, 31(3):38–47.
Rossow, C. (2014). Amplification hell: Revisiting network
protocols for DDoS abuse. In Proceedings of the
Network and Distributed System Security Symposium,
pages 1–15, San Diego, CA, USA. Internet Society.
Saunokonoko, M. (2020). Shock and awe: Victoria declares
state of disaster, six-week Melbourne curfew and stage
four restrictions. https://bit.ly/3zIvhA5.
Seyfort, S. and Zagon, C. (2021). More than 200 arrests
made on third day of Melbourne protests. https://bit.ly
/3tLUbLc.
Spitzner, L. (2003). Honeypots: Catching the insider threat.
In 19th Annual Computer Security Applications Con-
ference, pages 170–179, Las Vegas, NV, USA. IEEE.
Subramani, K., Perdisci, R., and Konte, M. (2021). Detecting
and measuring in-the-wild DRDoS attacks at IXPs. In
Intl Conf on Detection of Intrusions and Malware, and
Vulnerability Assessment, Virtual Event. Springer.
The Economist (2022). Russia’s invasion of Ukraine. https:
//ghostarchive.org/archive/Z5bzH.
Thomas, D. R., Clayton, R., and Beresford, A. R. (2017).
1000 days of UDP amplification DDoS attacks. In
APWG Sym on Electronic Crime Research, Scottsdale,
AZ, USA. IEEE.
Wang, A., Chang, W., Chen, S., and Mohaisen, A. (2018).
Delving into Internet DDoS attacks by botnets: Char-
acterization and analysis. IEEE/ACM Transactions on
Networking, 26(6).
Wang, A., Chang, W., Chen, S., and Mohaisen, A. (2020).
A data-driven study of DDoS attacks and their dynam-
ics. IEEE Transactions on Dependable and Secure
Computing, 17(3).
Anywhere on Earth: A Look at Regional Characteristics of DRDoS Attacks
29
