
Fusion of Machine Learning and Threshold-Based Approaches
for Fall Detection in Healthcare Using Inertial Sensors
Ya Wang
1 a
, Peiman Alipour Sarvari
2 b
and Djamel Khadraoui
2 c
1
Faculty of Science, Technology and Medicine, University of Luxembourg, Esch sur Alzette, Luxembourg
2
IT for Innovative Services, Luxembourg University of Science and Technology, Esch sur Alzette, Luxembourg
Keywords:
Wearable Fall Detection, Feature Extraction, Threshold, Machine Learning, Inertial Sensors.
Abstract:
In the healthcare sector, specifically for elderly care, accurate and efficient fall detection is crucial. We present
an advanced fall detection methodology tailored for wearable systems. Our approach blends threshold-based
screening with machine learning models like Support Vector Machine, K-Nearest Neighbors, Decision Tree,
Random Forest, and XGBoost. Utilizing 65 features extracted from the gyroscope and accelerometer data from
Inertial Measurement Units, our method addresses the class imbalance often found between Activities of Daily
Living and actual fall events. Threshold-based pre-screening serves to mitigate the class imbalance of the fall
dataset, making the subsequent machine-learning classification more effective. Validation on two open-source
IMU datasets, Sisfall and FallAllD, achieving high accuracy rates of 99.55%, 99.68% (wrist), 99.76% (waist),
and 99.52% (neck), shows our model surpassing existing solutions in detection accuracy. Furthermore, our
strategic feature extraction not only enhances the model’s performance but also allows for a fourfold reduction
by using the 15 most important features in data transmission without sacrificing accuracy. These findings
underscore the efficiency and potential of our methodology, indicating that wearables can indeed be powerful
tools for high-precision fall detection with minimal data overhead.
1 INTRODUCTION
According to the World Health Organization, falls ac-
count for approximately 600,000 global deaths each
year, ranking second among unintentional injury-
related deaths (WHO, 2023). Alarmingly, 75% of
these fatalities occur in adults over the age of 65
(Vaishya and Vaish, 2020). With the global popula-
tion aging at an unprecedented rate (WHO, 2022), im-
mediate assistance following falls is vital to minimize
medical complications. In fact, prolonged periods of
immobility after a fall, often lasting over an hour, have
been shown to increase the risk of mortality and lead
to severe health issues such as dehydration and pneu-
monia (Fleming and Brayne, 2008).
Given these concerns, there’s been a surge in inter-
est in cost-effective Fall Detection Systems (FDSs).
Telecare and remote biosignal monitoring offer in-
novative pathways for these systems. Since 2010,
both research articles and patents in automatic FDSs
a
https://orcid.org/0000-0002-4542-1074
b
https://orcid.org/0000-0003-1235-2102
c
https://orcid.org/0000-0003-1054-1612
have seen a significant uptick, underscoring the field’s
growing importance (Tanwar et al., 2022).
Fall detection systems (FDSs) primarily fall into
two categories: Context-Aware Systems (CAS) and
wearable FDSs. CAS systems utilize sensors like mi-
crophones, cameras, and radars placed in a prede-
fined area surrounding the individual. However, the
need for customization, high installation and mainte-
nance costs, and limited coverage areas restrict their
applicability outside controlled environments such as
nursing homes. Contrarily, wearable FDSs use in-
ertial measurement units (IMUs) directly attached to
the individual, allowing for location-independent fall
detection. These systems offer numerous advantages
including cost-efficiency, easier installation, privacy
preservation, and simpler design and configuration
(Hashim et al., 2020). This feature, combined with
the widespread use of smartwatches and sports bands,
enhances the feasibility and accessibility of wearable
FDSs, making them particularly suitable for urban ar-
eas with reliable mobile connectivity.”
Wang, Y., Sarvari, P. and Khadraoui, D.
Fusion of Machine Learning and Threshold-Based Approaches for Fall Detection in Healthcare Using Inertial Sensors.
DOI: 10.5220/0012250500003657
Paper published under CC license (CC BY-NC-ND 4.0)
In Proceedings of the 17th International Joint Conference on Biomedical Engineering Systems and Technologies (BIOSTEC 2024) - Volume 1, pages 573-582
ISBN: 978-989-758-688-0; ISSN: 2184-4305
Proceedings Copyright © 2024 by SCITEPRESS – Science and Technology Publications, Lda.
573

2 RELATED WORK
Algorithms of Wearable FDS can be broadly clas-
sified into three types: (i) threshold-based approach
(ii) machine learning-based approach and (iii) deep
learning-based approach. Table 1 summarizes rep-
resentative studies of the above three categories of
wearable sensor-based fall detection.
Threshold-Based Approach. Threshold-based
methods hinge on predefined threshold values to de-
tect falls by comparing specific sensor data—namely,
acceleration (Saadeh et al., 2019), angular velocity
(Bourke and Lyons, 2008), and body angle (Sorvala
et al., 2012). It operates on the premise that falls
exhibit distinct differences in body position and ve-
locity compared to activities of daily living (ADLs).
The system’s effectiveness largely depends on the
accuracy of these preset values. For example, de
Sousa et al. (de Sousa et al., 2021) introduced a low-
power wearable system for fall detection that utilized
a threshold-based approach and achieved a sensitivity
of 92.6% and specificity of 97.7%. Jung et al. (Jung
et al., 2020) employed thresholds based on the sum
vector magnitude of acceleration, the sum vector
magnitude of angular velocity, and the vertical angle.
They reported a sensitivity of 100% and specificity
of 97.54%. However, the approach has limitations
in terms of generalizing across different settings
and populations, causing decreased performance,
particularly in specificity, when tested on complex
datasets like SisFall (Wang et al., 2020)(Sucerquia
et al., 2017).
Machine Learning-Based Approach. Machine
learning techniques offer a flexible and adaptive
alternative to threshold-based fall detection methods,
often yielding improved performance in diverse
scenarios. For example, Giuffrida et al. used a
Support Vector Machine (SVM) model trained on a
curated set of features, which significantly optimized
the system’s parameters (Giuffrida et al., 2019). In
a similar vein, Yu et al. adopted a Hidden Markov
Model (HMM) for fall detection that circumvented
the need for manual feature selection altogether.
Their approach processed raw acceleration data and
achieved an impressive sensitivity of 99.2% and
specificity of 99.0% (Yu et al., 2017). To assess
the general efficacy of machine learning in this
domain, Martinez-Villaseor et al. compared four
key machine learning classifiers: Random Forest
(RF), SVM, Multilayer Perceptron (MLP), and
k-Nearest Neighbors (KNN). These algorithms were
evaluated for their ability to differentiate falls from
fall-like activities, adding a layer of complexity to the
detection problem (Martinez-Villase
˜
nor and Ponce,
2020). Despite their promising results, machine
learning-based approaches do face a bottleneck in
feature selection. The process of identifying the most
relevant features for fall detection is non-trivial and
can affect the algorithm’s overall performance.
Deep Learning-Based Approach. The advent of
powerful computational hardware has propelled the
utilization of deep learning algorithms in fall detec-
tion (Yu et al., 2020). These algorithms automati-
cally identify important features from raw sensor data,
eliminating the need for manual feature engineering.
Remarkable performance metrics, such as a sensitiv-
ity of 99.3% and specificity of 91.86% using ResNet
architecture, have been reported (Zhang et al., 2021).
Moreover, the ConvLSTM model was shown to excel
in both sensitivity and specificity, achieving 99.32%
and 99.01% (Yu et al., 2022).
To address this challenge of fall detection and
enhance computational efficiency, we introduce a
two-tiered hybrid algorithm that integrates threshold-
based and machine-learning methods for wearable
Fall detection systems.
3 METHODOLOGY
Fall datasets often exhibit a class imbalance between
Activities of Daily Living (ADL) and genuine fall
events. This imbalance skews the performance of
models trained on such datasets, particularly affect-
ing their ability to accurately identify falls, which
are the minority class. To address this challenge and
to enhance computational efficiency, we introduce a
two-tiered hybrid algorithm that integrates threshold-
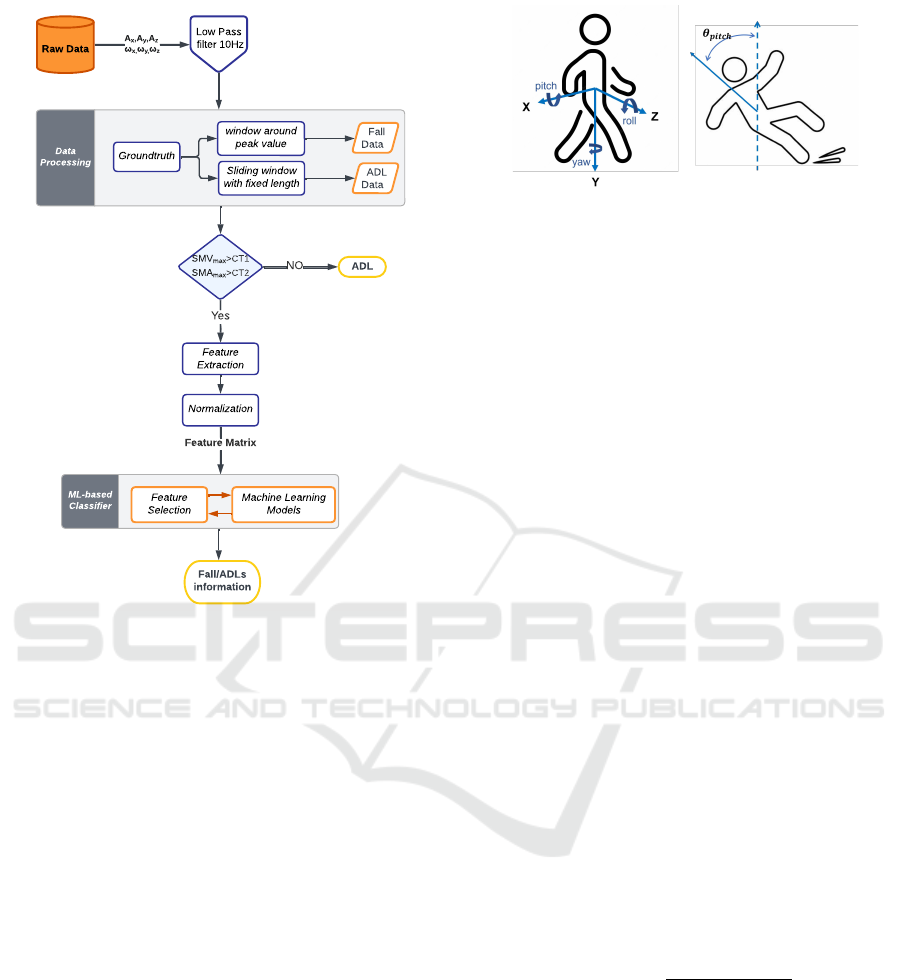
based and machine-learning methods. The flow chart
in Figure 1 illustrates the overall process of the fusion
approach.
3.1 Data Processing
3.1.1 Dataset
In this study, the open source datasets, SisFall and
FallAllD were utilized to validate the effectiveness of
three different fall detection approaches, after analyz-
ing the various fall detection datasets.
SisFall Dataset. SisFall (Sucerquia et al., 2017)
collected data from the IMU attached to the waist.
The IMU includes sensors such as accelerometers,
BIOSIGNALS 2024 - 17th International Conference on Bio-inspired Systems and Signal Processing
574
ML-based
Classifier
Data
Processing
Raw Data
Low Pass
filter 10Hz
A
x
,A
y
,A
z
?
x,
?
y,
?
z
Groundtruth
Sliding window
with fixed length
ADL
Data
Fall
Data
window around
peak value
SMV
max
>CT1
SMA
max
>CT2
NO
ADL
Feature
Extraction
Yes
Fall/ADLs
information
Feature
Selection
Machine Learning
Models
Normalization
Feature Matrix
Figure 1: Flow chart of the designed fall detection ap-
proach.
gyroscopes, and magnetometers. It consists of 19
ADLs and 15 fall types performed by 23 young adults,
15 ADL types performed by 14 healthy and indepen-
dent participants over 62 years old, and data from one
participant of 60 years old that performed all ADLs
and falls. The dataset includes motion data captured
by an inertial measurement unit (IMU) placed on the
waist at a sampling rate of 200Hz. The SisFall dataset
provides a substantial number of fall and ADL trials,
making it suitable for evaluating fall detection algo-
rithms.
FallAllD Dataset. The FallAllD dataset, proposed
by (Saleh et al., 2020), utilizes an IMU placed on the
neck, chest, and waist to measure movement during
experiments. The dataset was obtained from 15 sub-
jects (eight males and seven females), defined as con-
taining 35 falls and 44 ADL types. The waist and
neck acquired ADL and fall data for 14 and 12 sub-
jects, respectively, whereas the wrist sensor acquired
ADL and fall data for 13 and 9 subjects.
Figure 2 illustrates the coordinates of the ac-
celerometer and the angular velocity measurements in
our research.
Figure 2: Body accelerator and angular velocity measure-
ment system.
3.1.2 Low-Pass Filtering
The raw data collected from the Inertial Measurement
Unit (IMU) may contain electronic noise or other
types of artifacts that can affect the accuracy and reli-
ability of the measurements. To mitigate these distur-
bances, a filtering process is often applied to the data
(Yu et al., 2022)(Jung et al., 2020) (Shi et al., 2020).
In this research, we utilized a fourth-order low-pass
Butterworth filter with a 2-pass digital implementa-
tion to remove noise and artifacts from the accelera-
tor data and angular velocity data. The chosen cut-off
frequency for the filter was set at 10Hz. This value
was selected because the relevant frequency spectra
of human motion typically fall within the range of 0
to 10Hz (Winter, 2009).
3.1.3 Data Refinement and Segmentation
The six-axis inertial signals from the IMU sensor
were defined as A
x
,A
y
,A
z
,ω
x
,ω
y
and ω
z
. During a fall
event, as the body makes contact with the ground, it
typically causes sudden and pronounced peaks in ac-
celeration. Figure 3 illustrates a representative dia-
gram displaying the 3-axis acceleration and angular
velocity data of a forward fall event starting from the
initial state position. Such peaks, captured by the Sig-
nal Magnitude Vector (SMV), serve as the primary
indicators for fall events. Mathematically, for each
measurement during a particular fall instance, SMV
is defined as:
SMV
i
=
q
A
x
2
i
+ A
y
2
i
+ A
z
2
i
(1)
Segmentation Strategy Using Signal Magnitude
Vector (SMV):
1. Fall Events: Fall instances are pinpointed by
observing the 2-second window surrounding the
peak SMV values within the recorded data.
Ground truth information is used to validate and
label these samples as falls. The definition of the
time of peak SMV (t
i
SMV
max
) for the i th fall event
is defined as:
Fusion of Machine Learning and Threshold-Based Approaches for Fall Detection in Healthcare Using Inertial Sensors
575
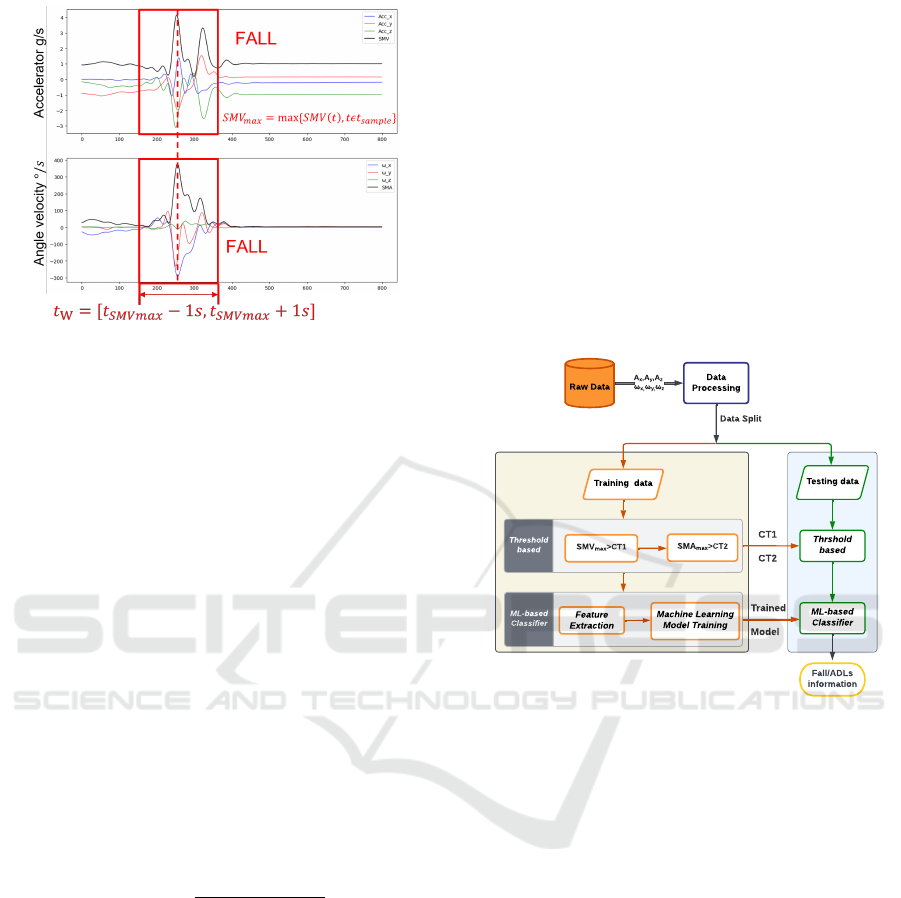
Figure 3: Fall accident from a static posture. (t
W
: length of
the time window for the fall segment).
t
i
SMV
max
= argmax
t
{SMV
i
(t) : SMV
i
(t) ∈ ith fall }
(2)
2. ADL Events: To diversify the ADLs dataset, a
sliding window method is employed. This mecha-
nism uses a consistent window of 2 seconds, pro-
gressing at steps of 0.2 seconds across the data
timestamps. This method captures data fragments
and categorizes them as non-fall events, ensur-
ing a more encompassing representation of typical
movements.
However, there are instances where high-intensity ac-
tivities, such as rapid walking or jumping, can pro-
duce acceleration patterns similar to falls, posing
challenges in accurate detection. To address this co-
nundrum, gyroscope data is incorporated to assess
and determine the subject’s posture. For every data
point during the i-th fall event, the Signal Magni-
tude Vector of Angular Velocity (SMA) is leveraged
to measure alterations in angular velocity. This metric
is articulated as:
SMA
i
=
q
ω
x
2
i
+ ω
y
2
i
+ ω
z
2
i
(3)
3.1.4 Adaptive Time-Window Size
Fall detection algorithms commonly utilize temporal
windows to analyze inertial signals where a fall event
might occur. These windows typically span between
0.2 and 2 seconds. Optimal window durations for fall
and human activity detection have been subject to re-
search. Banos et al. recommended a 1-2 second win-
dow for general human activities, balancing recogni-
tion speed with accuracy (Banos et al., 2014). The
intrinsic dynamics of a fall, characterized by abrupt
and unexpected movements, usually occur within a
1-3 second timeframe (Yu, 2008). The most critical
phases of a fall, including the free-fall and impact pe-
riods, happen within an even narrower range of 0.5-
0.85 seconds (Huynh et al., 2013). Eduardo Casilari
et al. fine-tuned this by proposing a 2-second window,
centered around the peak of the fall signal, capturing
the most relevant features of a fall event (Casilari and
Silva, 2022). In our analysis, we adopt this 2-second
observation window for optimal fall detection.
3.1.5 Data Split
After the data processing, the whole data set is split
into the training dataset and test dataset with a ratio
of 75/25. The flow chart in Figure 4 illustrates the
training process and testing process.
`
ML-based
Classifier
Threshold
based
Raw Data
Data
Processing
Training data
Testing data
Feature
Extraction
SMV
max
>CT1
SMA
max
>CT2
ML-based
Classifier
Machine Learning
Model Training
A
x
,A
y
,A
z
?
x,
?
y,
?
z
Fall/ADLs
information
Trained
Model
Data Split
Thrshold
based
CT1
CT2
Figure 4: Flow chart of the train process and test process.
3.2 Threshold-Based Methods
The first tier acts as an initial filter using threshold-
based criteria to swiftly differentiate potential fall
events from routine activities. This approach allows
for rapid processing, screening out most ADL in-
stances and forwarding only suspected fall events to
the second tier for detailed analysis. Specifically,
the algorithm employs two thresholds calculated from
sensor measurements of the training data: Signal
Magnitude Vector (SMV) and Signal Magnitude Vec-
tor of Angular Velocity (SMA). These thresholds are
defined as follows:
CT 1 = min{SMV
max
: S MV
max
∈ fall training data}
(4)
where SMV
max
= max{SMV (t) : t ∈ t
W
}
CT 2 = min{SMA
max
: S MA
max
∈ fall training data}
(5)
where SMA
max
= max{SMA(t) : t ∈ t
W
}
BIOSIGNALS 2024 - 17th International Conference on Bio-inspired Systems and Signal Processing
576

Within the predefined time window t
W
, if both
SMV
max
and SMA
max
exceed their respective thresh-
olds, the data is forwarded to the second tier; other-
wise, it is disregarded.
3.3 Machine Learning-Based Approach
The second tier capitalizes on machine learning algo-
rithms to meticulously classify the dataset that’s been
pre-screened by the initial tier. This dual-stage ap-
proach amplifies the algorithm’s precision in detect-
ing falls, while also boosting computational speed.
3.3.1 Feature Extraction
Before applying machine learning classifiers, we fo-
cus on feature extraction to accurately represent the
underlying data patterns. We compute a set of eight
statistical features that encapsulate information from
accelerometer and gyroscope readings. These fea-
tures include metrics such as angular velocity, Signal
Magnitude Vector (SMV), and Signal Magnitude Vec-
tor of Angular Velocity (SMA). For a detailed sum-
mary, refer to Table 1. These statistical features are
universally accepted in the domains of Human Ac-
tivity Recognition (HAR) and Fall Detection Systems
(FDS) (Sucerquia et al., 2017; Giuffrida et al., 2019;
Martinez-Villase
˜
nor and Ponce, 2020; Casilari and
Silva, 2022).
We denote the human acclivity feature derived
from the raw data of the IMU sensor by S, which is
defined as
S = [A
x
, A
y
, A
z
, ω
x
, ω
y
, ω
z
, SMV, SMA, N
Ang
], (6)
where A
x
, A
y
, A
z
represent the accelerometer read-
ings along the X, Y, and Z axes, respectively, and
ω
x
, ω
y
, ω
z
represent the angular velocity readings
along the X, Y, and Z axes, respectively, SMV and
SMA denote the Signal Magnitude Vector and Signal
Magnitude Vector of Angular Velocity, respectively,
N
Ang
represent the attitude change during the fall.
The attitude angle change during the fall N
Ang
is
defined as follows:
Pitch Angle. The pitch angle represents the forward
angle of the sensor during a fall.
Pitch = arccos
|A
z
|
q
A
z
2
+ A
y
2
(7)
Roll Angle. The roll angle represents the sideward
angle of the sensor during a fall. By incorporat-
ing these pitch and roll angles, we can capture the
changes in the forward and sideward attitudes of in-
dividuals during a fall.
Roll = arccos
|A
x
|
q
A
x
2
+ A
y
2
(8)
The attitude angle change during the fall is defined
as:
N
Ang
= Pitch + Roll (9)
The selected statistic features are analytically de-
fined as follows:
Maximum (Peak) of Feature S. This feature rep-
resents the peak or maximum value of a specific
data feature (S) during the fall window. It serves as
a meaningful descriptor of the force of the impact
against the ground. Mathematically, it can be defined
as:
S
max
= max{S(t) : t ∈ t
W
} (10)
Minimum of Feature S. This feature indicates the
minimum value achieved by the data feature (S) dur-
ing the fall window. It is a key element in describing
the fall.
S
min
= min{S(t) : t ∈ t
W
} (11)
Mean of Feature S. The mean provides informa-
tion about the average body motion intensity during
the fall. It is computed as the average of the feature
values over the observation window (t
W
) containing
N
W
feature samples.
µ
S
=
1
N
W
∑
t∈t
W
S (12)
where N
W
is defined as:
N
w
= 2[
T
2
f
s
] + 1 (13)
Standard Deviation of Feature S. This feature de-
scribes the variability of the feature (S) during the ob-
servation window. It is calculated as the square root
of the average squared deviation from the mean.
σ
S
=
s
1
N
W
∑
t∈t
W
(S − µ
S
)
2
S (14)
Skewness of Feature S. Skewness characterizes the
symmetry of the distribution of feature values. It in-
dicates whether the distribution is skewed to the left
or right.
γ
S
=
1
σ
S
3
N
W
∑
t∈t
W
(S − µ
S
)
3
(15)
Fusion of Machine Learning and Threshold-Based Approaches for Fall Detection in Healthcare Using Inertial Sensors
577

Table 1: Descriptive statistics of 65 features.
Statistic Equation Acc Ang SMV SMA N
Ang
Maximum S
max
= max{S(t) : t ∈ t
W
}
A
x
max
A
y
max
A
z
max
ω
x
max
ω
y
max
ω
z
max
SMV
max
SMA
max
N
Ang
max
Minimum S
min
= min{S(t) : t ∈ t
W
}
A
x
min
A
y
min
A
z
min
ω
x
min
ω
y
min
ω
z
min
SMV
min
SMA
min
N
Ang
min
Mean µ
S
=
1
N
W
∑
t∈t
W
S
µ
A
x
µ
A
y
µ
A
z
µ
ω
x
µ
ω
y
µ
ω
z
µ
SMV
µ
SMA
µ
N
Ang
Standard
Deviation
σ
S
=
r
1
N
W
∑
t∈t
W
(S − µ
S
)
2
S
σ
A
x
σ
A
y
σ
A
z
σ
ω
x
σ
ω
y
σ
ω
z
σ
SMV
σ
SMA
σ
N
Ang
Skewness γ
S
=
1
σ
S
3
N
W
∑
t∈t
W
(S − µ
S
)
3
γ
A
x
γ
A
y
γ
A
z
γ
ω
x
γ
ω
y
γ
ω
z
γ
SMV
γ
SMA
γ
N
Ang
Kurtosis Kurt
S
= E[(
(S−µ
S
)
σ
S
)
4
]
Kurt
A
x
Kurt
A
y
Kurt
A
z
Kurt
ω
x
Kurt
ω
y
Kurt
ω
z
Kurt
SMV
Kurt
SMA
Kurt
N
Ang
valley-to-peak
range
R
S
= S
max
− S
min
R
A
x
R
A
y
R
A
z
R
ω
x
R
ω
y
R
ω
z
R
SMV
R
SMA
NAN
valley-to-peak
time
T
S
= t
S
max
−t
S
min
NAN NAN T
SMV
T
SMA
NAN
1
A
x
, A
y
, A
z
represent the accelerometer readings along the X, Y, and Z axes, respectively,
2
ω
x
, ω
y
, ω
z
represent the angular velocity readings along the X, Y, and Z axes,
3
SMV and SMA denote the Signal Magnitude Vector and Signal Magnitude Vector of Angular Velocity
Kurtosis of Feature S. Kurtosis measures the
tailedness (frequency of outliers) of the distribution
of feature values.
Kurt
S
= E[(
(S − µ
S
)
σ
S
)
4
] (16)
Valley-to-Peak Range (R
s
). This feature represents
the value of the interval between the minimum (S
m
in)
and maximum (S
m
ax) of the feature S. It is calculated
as:
R
S
= S
max
− S
min
(17)
Valley-to-Peak Time (T
s
). This feature indicates
the duration of the interval between the minimum
(S
min
) and maximum (S
max
) of the feature S.
T
S
= t
S
max
−t
S
min
(18)
3.3.2 Model Implementation
With the features extracted, we proceed to apply
machine learning models for classification. In this
study, we explore multiple classifiers including Sup-
port Vector Machines (SVM), K-Nearest Neighbors
(KNN), Decision Trees, Random Forests, and XG-
Boost. These classifiers are trained and evaluated
based on their ability to accurately distinguish be-
tween fall and non-fall events.
Our dual-layer approach, incorporating these se-
lected features, is rigorously tested on the Sisfall and
FallAllD datasets. By applying the chosen statisti-
cal features to both categories, we aim to critically
assess and validate the performance of our machine
learning-based fall detection model.
4 RESULTS AND DISCUSSION
4.1 Performance Evaluation Metrics
Various methods have been developed to evaluate the
performance of different classifiers. These methods
rely on the outcomes obtained from the classifiers,
which are represented in the form of a confusion ma-
trix (Figure 10). The confusion matrix provides a vi-
sual representation of the classifier’s performance, in-
cluding true positives, true negatives, false positives,
and false negatives.
• True positive (TP): The ADL events have been
correctly classified.
• True negative (TN): The fall events have been cor-
rectly detected.
BIOSIGNALS 2024 - 17th International Conference on Bio-inspired Systems and Signal Processing
578
• False positive (FP): Fall events that have not been
detected.
• False negative (FN): A false alarm situation oc-
curs.
One commonly used method to assess classifier
performance is accuracy, which calculates the pro-
portion of correctly classified samples overall. How-
ever, accuracy has certain limitations, such as being
susceptible to the influence of large abnormal data
and potentially misleading results in class-imbalanced
training data scenarios. To address these limitations,
alternative evaluation methods are selected to evalu-
ate class-imbalanced classifiers effectively. For fall
detection tasks with imbalanced classes, sensitivity,
specificity, F-score, and receiver operating character-
istic (ROC) are commonly utilized to assess the clas-
sifier’s ability to differentiate falls from a large num-
ber of activities of daily living (ADL) events.
Accurancy =
T P + T N
T P + T N + FP +FN
(19)
Sensitivity measures the proportion of correctly
identified positive samples. Specificity, on the other
hand, measures the proportion of correctly identified
negative samples.
Sensitivity =
T P
T P + FN
(20)
Speci f icity =
T N
T N + FP
(21)
The F1 is a robust evaluation metric that balances
sensitivity and specificity. In large-scale datasets, sen-
sitivity and specificity often have a trade-off relation-
ship, and the F-score provides a comprehensive mea-
sure of their discrimination. The parameter β in the
F-score equation allows adjusting the weight between
sensitivity and specificity. Setting β to 0.5 assigns a
higher weight to specificity, which is crucial in fall
detection as it reflects the detection of all fall signals
in the data.
F1 = (1 + β
2
)
Sensitivity × Speci ficity
β
2
× (Sensitivity +Speci ficity)
(22)
In summary, sensitivity, specificity, and F-score
provide comprehensive measures for evaluating the
performance of fall detection classifiers, particu-
larly in scenarios with imbalanced class distributions.
These metrics address the limitations of accuracy and
offer a more nuanced assessment of the classifier’s
ability to distinguish falls from ADL events.
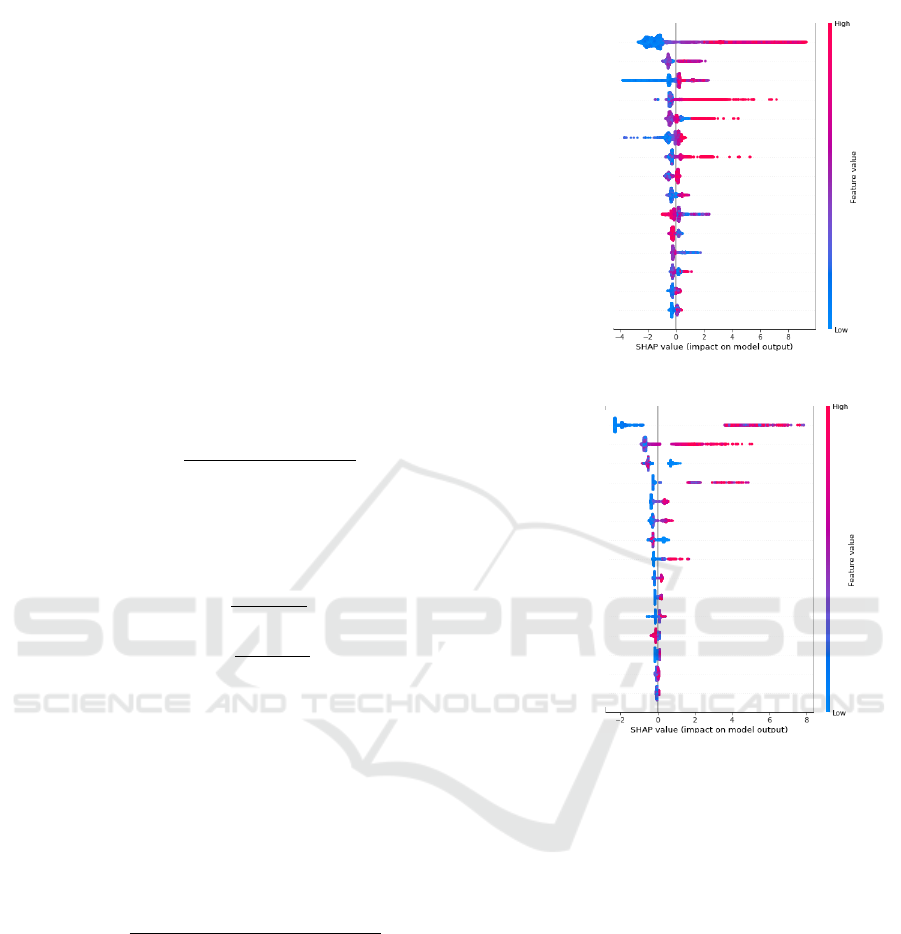
4.2 Results and Discussion
Our analyses underscored the varying importance of
features across the two datasets—Sisfall and Fal-
lAllD. Notably, features like T
SMV
, T
SMA
, and R
SMV
FallAllD
(a) Shap values for FallAllD.
SisFall
(b) Shap values for SisFall.
Figure 5: The Shap values of the top 15 features of the
dataset (a) FallAllD; (b) SisFall.
consistently ranked among the top ten most important
features when both datasets were integrated, empha-
sizing their critical role in accurately detecting falls
and Activities of Daily Living (ADLs). These find-
ings are corroborated by Table 2, which offers an
exhaustive evaluation of different machine learning
classifiers based on the feature sets. In which, fea-
ture (1) utilizes all 65 extracted features and features
(2) focuses on the 15 most important features as deter-
mined by feature integration. The model’s robustness
was evident from its high accuracy rates across vary-
ing types of falls and ADLs. The results show that
the model is robust to the input of different types of
falls/ADLs and achieved superior performance. The
FallAllD dataset is collated from 3 different locations
with limited data size, it has been shown that the po-
sition of the sensors also plays an important role in
the fall detection models. And we can also see that
Fusion of Machine Learning and Threshold-Based Approaches for Fall Detection in Healthcare Using Inertial Sensors
579

Table 2: Fall detection results for Sisfall and FallAllD: the
unit is %, feature (1) utilizes all 65 extracted features, and
feature (2) focuses on the 15 most important features.
Dataset Model Sensitivity Specificity Accuracy F1
SisFall
1
SVM 99.47 99.35 99.45 98.22
KNN 98.06 98.91 98.96 94.27
DT 98.88 99.38 99.28 98.45
RF 99.44 98.75 99.54 99.03
XGB 99.62 98.81 99.55 99.14
SisFall
2
SVM 98.67 99.03 98.62 96.43
KNN 97.61 98.63 98.05 86.44
DT 97.29 99.23 98.70 97.98
RF 99.01 97.87 99.26 98.88
XGB 98.79 98.33 99.16 98.92
FallAllD
1
SVM 99.36 1 99.84 99.68
(wrist) KNN 98.71 99.58 99.37 98.71
DT 98.87 99.61 99.55 98.82
RF 98.89 99.88 98.95 99.24
XGB 99.62 99.47 99.68 99.47
FallAllD
2
SVM 98.27 99.40 99.37 97.55
(Wrist) KNN 97.67 97.44 97.49 94.02
DT 98.88 99.38 99.18 98.9
RF 96.44 98.75 99.66 99.4
XGB 98.62 98.51 99.55 98.7
FallAllD
1
SVM 99.77 99.03 99.34 99.27
(waist) KNN 98.06 98.91 98.96 98.69
DT 97.88 99.02 99.18 99.22
RF 99.34 98.75 99.76 99.07
XGB 99.32 98.31 99.35 99.23
FallAllD
2
SVM 98.63 97.51 96.74 98.58
(waist) KNN 96.85 95.81 97.39 97.41
DT 96.86 99.84 97.68 97.88
RF 98.62 98.80 99.44 98.47
XGB 97.82 98.82 98.84 98.64
FallAllD
1
SVM 96.53 98.94 99.15 91.25
(neck) KNN 89.06 98.91 95.96 87.10
DT 98.28 99.38 99.12 98.32
RF 98.24 99.47 99.52 99.40
XGB 98.88 99.46 99.47 99.51
FallAllD
2
SVM 95.81 99.03 99.35 89.55
(neck) KNN 79.66 91.34 86.90 86.79
DT 97.48 99.38 98.18 97.44
RF 97.44 98.75 98.66 97.96
XGB 98.42 98.51 98.55 98.73
the tree-based models show superior and robust per-
formance in different datasets.
In Table 3, we present a comparative analysis
of fall detection capabilities between our proposed
model and existing models, all evaluated using the
same dataset. Our model’s robustness and enhanced
performance are evident; it consistently identifies a
range of falls and Activities of Daily Living (ADLs)
with remarkable accuracy.
5 CONCLUSIONS
In this study, we proposed a wearable fall detec-
tion model that combines the threshold and ma-
Table 3: Comparison of results between the proposed and
previous research models, the unit is %.
Algorithem Sensitivity Specificity Accuracy
Yu et al.
(2020)
Sisfall
ResNet10
SMOTE
CDL-Fall
97.91
99.17
99.33
72.89
89.98
91.86
96.22
97.54
97.52
Santoyo et al.
(2022)
FallAllD waist
CNN 85.97 96.79 NAN
Jeong et al.
(2023)
FallAllD wrist
LightGBM 91.04 96.38 94.86
Proposed
Sisfall
Fusion
method
99.62 98.81 99.55
Proposed
FallAllD wrist
Fusion
method
99.62 99.47 99.68
Proposed
FallAllD waist
Fusion
method
99.34 98.75 99.76
Proposed
FallAllD neck
Fusion
method
98.24 99.47 99.52
Note: In this comparison, while the same open-source datasets are
used, the training and testing datasets for the fall detection model
differ due to variations in data processing methods, like filter fre-
quency and sample window size. Hence, the results should be
viewed as indicative rather than conclusive.
chine learning approach benchmarked against Sis-
fall and FallAllD datasets. Employing a suite of
65 rigorously selected statistical features (as shown
in table1) extracted from inertial sensors, the study
leveraged tree-based ensemble models to achieve un-
precedented accuracy rates: 99.55%, 99.68% (wrist),
99.76% (waist), and 99.52% (neck) across the exam-
ined datasets. This level of performance substantially
outperforms existing benchmarks documented in the
scholarly literature.
SHAP value analysis was instrumental in distill-
ing the feature set down to the top 15 most influen-
tial features. Comparative analysis indicated that the
reduced feature set incurred a statistically insignifi-
cant diminution in performance metrics—less than a
1% deviation relative to the exhaustive feature set.
The hybrid model architecture, ingeniously combin-
ing threshold-based and machine learning algorithms,
facilitates minimal data transference from the wear-
able device to the computational node while sustain-
ing high fidelity in fall detection outcomes.
While the current study’s accomplishments are
manifold, it is imperative to acknowledge its limita-
tions. The absence of real fall data in the utilized
datasets denotes an opportunity for future work to fur-
ther validate the model’s performance under invalid
conditions. In light of the latter, future research en-
deavors will be directed toward the integration of this
validated model architecture into wearable technol-
ogy platforms, emphasizing the necessity of feature
selection optimization for real-time fall detection.
BIOSIGNALS 2024 - 17th International Conference on Bio-inspired Systems and Signal Processing
580

ACKNOWLEDGEMENTS
This work was adapted and extended from the mas-
ter’s thesis titled ’Analysis and Comparison of Dif-
ferent Types of Algorithms for Fall Detection in Fall
Alerting Systems’ completed at the University of
Luxembourg, supported by the European Active and
Assisted Living 2021(AAL) Programme, the Luxem-
bourg National Research Fund (FNR), and the Lux-
embourg Institute of Science and Technology (LIST).
This research is part of the AGAPE project, with the
code AAL-2021-8-124-CP, and titled ’ADVANCING
INCLUSIVE HEALTH & CARE SOLUTIONS FOR
AGEING WELL IN THE NEW DECADE.
REFERENCES
Banos, O., Galvez, J.-M., Damas, M., Pomares, H., and Ro-
jas, I. (2014). Window size impact in human activity
recognition. Sensors, 14(4):6474–6499.
Bourke, A. K. and Lyons, G. M. (2008). A threshold-
based fall-detection algorithm using a bi-axial gyro-
scope sensor. In Medical engineering & physics, vol-
ume 30, pages 84–90. Elsevier.
Casilari, E. and Silva, C. A. (2022). An analytical com-
parison of datasets of real-world and simulated falls
intended for the evaluation of wearable fall alerting
systems. Measurement, 202:111843.
de Sousa, F. A. S. F., Escriba, C., Bravo, E. G. A., Brossa,
V., Fourniols, J., and Rossi, C. (2021). Wearable pre-
impact fall detection system based on 3d accelerom-
eter and subject’s height. In IEEE Sensors Journal,
volume 22, pages 1738–1745. IEEE.
Fleming, J. and Brayne, C. (2008). Inability to get up af-
ter falling, subsequent time on floor, and summoning
help: prospective cohort study in people over 90. In
Bmj, volume 337. British Medical Journal Publishing
Group.
Giuffrida, D., Benetti, G., Martini, D. D., and Facchinetti, T.
(2019). Fall detection with supervised machine learn-
ing using wearable sensors. In 2019 IEEE 17th In-
ternational Conference on Industrial Informatics (IN-
DIN), volume 1, pages 253–259. IEEE.
Hashim, H. A., Mohammed, S. L., and Gharghan, S. K.
(2020). Accurate fall detection for patients with
parkinson’s disease based on a data event algorithm
and wireless sensor nodes. In Measurement, volume
156, page 107573. Elsevier.
Huynh, Q. T., Nguyen, U. D., Tran, S. V., Nabili, A., and
Tran, B. Q. (2013). Fall detection system using com-
bination accelerometer and gyroscope. In Proc. of the
Second Int. l Conf. on Advances in Electronic Devices
and Circuits (EDC 2013).
Jung, H., Koo, B., Kim, J., Kim, T., Nam, Y., and Kim,
Y. (2020). Enhanced algorithm for the detection of
preimpact fall for wearable airbags. 20(5):1277.
Martinez-Villase
˜
nor, L. and Ponce, H. (2020). Design and
analysis for fall detection system simplification. JoVE
(Journal of Visualized Experiments), (158):e60361.
Saadeh, W., Butt, S. A., and Altaf, M. A. B. (2019). A
patient-specific single sensor iot-based wearable fall
prediction and detection system. In IEEE transactions
on neural systems and rehabilitation engineering, vol-
ume 27, pages 995–1003. IEEE.
Saleh, M., Abbas, M., and Le Jeannes, R. B. (2020). Fal-
lalld: An open dataset of human falls and activities
of daily living for classical and deep learning applica-
tions. IEEE Sensors Journal, 21(2):1849–1858.
Shi, J., Chen, D., and Wang, M. (2020). Pre-impact
fall detection with cnn-based class activation mapping
method. Sensors, 20(17):4750.
Sorvala, A., Alasaarela, E., Sorvoja, H., and Myllyl
¨
a, R.
(2012). A two-threshold fall detection algorithm for
reducing false alarms. In 2012 6th International Sym-
posium on Medical Information and Communication
Technology (ISMICT), pages 1–4. IEEE.
Sucerquia, A., L
´
opez, J. D., and Vargas-Bonilla, J. F.
(2017). Sisfall: A fall and movement dataset.
17(1):198.
Tanwar, R., Nandal, N., Zamani, M., and Manaf, A. A.
(2022). Pathway of trends and technologies in fall
detection: a systematic review. In Healthcare, vol-
ume 10, page 172. Multidisciplinary Digital Publish-
ing Institute.
Vaishya, R. and Vaish, A. (2020). Falls in older adults are
serious. In Indian journal of orthopaedics, volume 54,
pages 69–74. Springer.
Wang, X., Ellul, J., and Azzopardi, G. (2020). Elderly fall
detection systems: A literature survey. 7:71.
WHO (2022). Ageing and health. WHO, N/A, n/a edition.
WHO (2023). World health statistics 2023: monitoring
health for the SDGs, sustainable development goals.
WHO, N/A, n/a edition.
Winter, D. A. (2009). Biomechanics and motor control of
human movement. John Wiley & Sons.
Yu, S., Chen, H., and Brown, R. A. (2017). Hidden markov
model-based fall detection with motion sensor orien-
tation calibration: A case for real-life home monitor-
ing. IEEE Journal of Biomedical and Health Infor-
matics, 22(6):1847–1853.
Yu, X. (2008). Approaches and principles of fall detection
for elderly and patient. In HealthCom 2008-10th In-
ternational Conference on e-health Networking, Ap-
plications and Services, pages 42–47. IEEE.
Yu, X., Koo, B., Jang, J., Kim, Y., and Xiong, S. (2022). A
comprehensive comparison of accuracy and practical-
ity of different types of algorithms for pre-impact fall
detection using both young and old adults. Measure-
ment, 201:111785.
Yu, X., Qiu, H., and Xiong, S. (2020). A novel hybrid deep
neural network to predict pre-impact fall for older
people based on wearable inertial sensors. Frontiers
in Bioengineering and Biotechnology, 8:63.
Zhang, J., Li, J., and Wang, W. (2021). A class-imbalanced
deep learning fall detection algorithm using wearable
sensors. Sensors, 21(19):6511.
Fusion of Machine Learning and Threshold-Based Approaches for Fall Detection in Healthcare Using Inertial Sensors
581
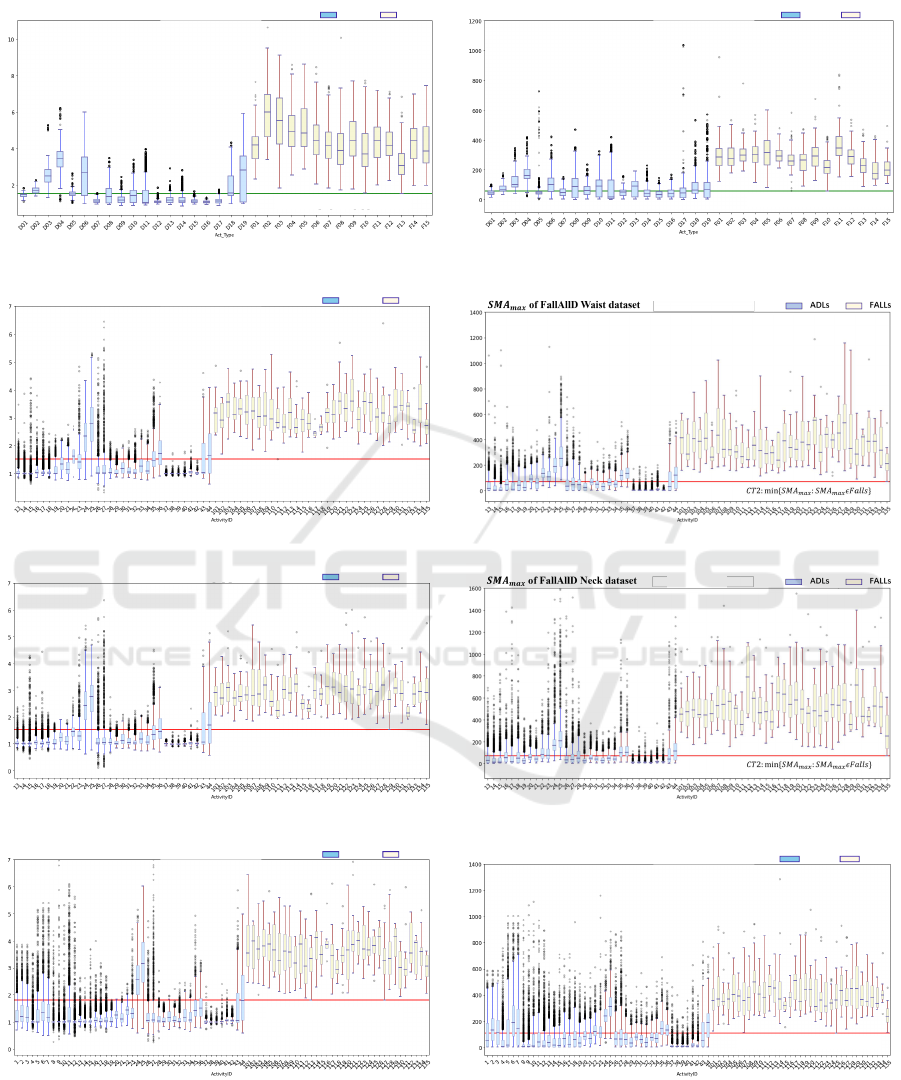
APPENDIX
ADLs FALLs
of SisFall dataset
(a) Boxplot of SMV
max
for SisFall dataset
ADLs FALLs
of SisFall dataset
(b) Boxplot of SMA
max
for SisFall dataset
ADLs FALLs
of FallAllD Waist dataset
(c) Boxplot of SMV
max
for FallAllD Waist dataset (d) Boxplot of SMA
max
for FallAllD Waist dataset
ADLs FALLs
of FallAllD Neck dataset
(e) Boxplot of SMV
max
for FallAllD Neck dataset (f) Boxplot of SMA
max
for FallAllD Neck dataset
ADLs FALLs
of FallAllD Wrist dataset
(g) Boxplot of SMV
max
for FallAllD Wrist dataset
ADLs FALLs
of FallAllD Wrist dataset
(h) Boxplot of SMA
max
for FallAllD Wrist dataset
Figure 6: The boxplots of statistical features of the dataset provide a visual representation of their distribution and the thresh-
olds.
BIOSIGNALS 2024 - 17th International Conference on Bio-inspired Systems and Signal Processing
582
