
Factors Associated with Malnutrition in Pregnancy: A Principal
Component Analysis
Dian Isti Angraini
*a
and Reni Zuraida
b
Department of Community Medicine and Public Health, Medical Faculty, Lampung University,
Jalan Prof. Soemantri Brojonegoro No,1, Bandar Lampung, Indonesia
Keywords: Factors, Malnutrition, Pregnancy, Principal Component Analysis.
Abstract: Malnutrition during pregnancy in Indonesia is quite high, and has the impact of increasing complications
during pregnancy and childbirth as well as in babies who are born. This research aims to analyze factors
associated with malnutrition in pregnancy using principal component analysis. This study is an observational
analytic using a case-control design. The research started from September to December 2021. The samples
for this study were 190 pregnant women in Bandar Lampung City and were taken using a multistage random
sampling technique that met the inclusion and exclusion criteria. The independent variables are nutrition
intake (energy, protein, carbohydrates, fat, iron), anemia, iron status, protein status, weight gain during
pregnancy, age, education, knowledge, occupation, income, parity, food taboo, and BMI before pregnant, and
the dependent variable is malnutrition during pregnancy. Nutrition intake data was assessed based on the
SQFFQ questionnaire. Data on anemia, iron status, and protein status were assessed based on blood tests.
Prepregnancy BMI and weight gain data were measured using anthropometry. Other data with questionnaires.
Data were analyzed using principal component analysis. The results of the study showed that based on
principal component analysis, 3 categories of factors were found that played a role in the incidence of
malnutrition in pregnancy, that were factor 1 (energy intake, protein intake, carbohydrate intake, fat and iron
intake) which was named nutrition intake; factor 2 (BMI before pregnancy and weight gain during pregnancy)
was named prepregnancy nutritional status and weight gain; and factor 3 (iron status, parity, and food taboo)
was named iron reserves and cultural factors.
1 INTRODUCTION
One of the key issues is malnutrition, which impairs
a person's physical function to the point where it is
unable to support necessary bodily functions like
growth, physical labor, and illness resistance or
recovery. Low birth weight, intrauterine growth
retardation (IUGR), and mother and child mortality
and morbidity are frequently caused by poor nutrition
during pregnancy, when combined with infections
(Serbesa et al., 2019).
Malnutrition is known to increase the risk of poor
pregnancy outcomes, including obstructed labor,
premature or low-birth-weight (LBW) babies and
postpartum hemorrhage (Gebre et al., 2018). Severe
anemia during pregnancy is associated with increased
maternal mortality. Besides, malnutrition among
a
https://orcid.org/0000-0003-0233-6635
b
https://orcid.org/0000-0003-1460-6428
mothers has an intergenerational effect, with
repeating cycles of malnutrition and poverty in the
long run (Saha et al., 2022).
Inadequate maternal nutrition has been linked to
an increased risk of complications like intrauterine
growth restriction, low birth weight, premature,
prenatal and child mortality, and morbidity (Marshall
et al., 2022). Inadequate nutrient intake, on the other
hand, has been shown to have pathophysiologic
effects that manifest as growth and development
defects in children and adult chronic disease in adults
over time (Norman et al., 2021).
Malnutrition remains one of the world’s highest
priority health issues, not only because its effects are
so widespread and long lasting but also because it can
be eradicated best at the preventive stage (Serbesa et
al., 2019). Maternal malnutrition is influenced not
Angraini, D. I. and Zuraida, R.
Factors Associated with Malnutrition in Pregnancy: A Principal Component Analysis.
DOI: 10.5220/0013668000003873
Paper published under CC license (CC BY-NC-ND 4.0)
In Proceedings of the 1st International Conference on Medical Science and Health (ICOMESH 2023), pages 195-202
ISBN: 978-989-758-740-5
Proceedings Copyright © 2025 by SCITEPRESS – Science and Technology Publications, Lda.
195

only by lack of adequate nutrition but also influenced
by social and psychological factors, nutritional
knowledge of mothers, and biological changes that
influence perceptions of eating patterns during
pregnancies (Dukhi, 2020).
The factors that determine the CED status of a
woman of childbearing age, whether pregnant or not
pregnant, consist of direct, indirect, basic and main
problems. Direct factors include food intake and
illnesses suffered (infectious diseases, anemia,
protein deficiency). Indirect factors include food
availability, environment (family, environmental
cleanliness, culture), history of illness/health, health
services, obstetric status/parity, mother's education
and knowledge (UNICEF, 2015; Ministry of Health
of the Republic of Indonesia, 2015).
Of the many factors that play a role or are
associated with the incidence of malnutrition in
pregnancy, an analysis will be carried out using
principal component analysis to reduce a large
number of variables into a small number of factors.
The purpose of principal component analysis is to
explain variations in a set of observed variables on the
basis of several dimensions, from variables that
change a lot to variables that are few.
2 SUBJECT AND METHOD
This research is an observational analytic study with
a cross-sectional research design. The study was
conducted at the 12 Public Health Centers in Bandar
Lampung City, Indonesia, from September to
December 2021. The population in this study were
pregnant women in Lampung Province. Based on the
results of the sample calculation, the minimum
number of samples that must be met were 190
pregnant women in Bandar Lampung City. The
sample size calculation uses the sample size formula
for unpaired categorical comparative analytics with a
95% confidence value, the power of the test is 80%.
Sampling was done by the multistage random
sampling method.
The inclusion criteria were pregnant women and
willing to take part in the research. The exclusion
criteria were having a history of malignant disease,
suffering from or having a history of diabetes
mellitus, and suffering from or having a history of
infectious disease.
The independent variables are nutrition intake
(energy, protein, carbohydrates, fat, iron), anemia,
iron status, protein status, weight gain during
pregnancy, age, education, knowledge, occupation,
income, parity, food taboo, and BMI before pregnant,
and the dependent variable is malnutrition during
pregnancy. Nutrition intake data was assessed based
on the Semiquantitatve Food Questionaire (SQFFQ).
Data on anemia, iron status, and protein status were
assessed based on blood tests. Prepregnancy BMI and
weight gain data were measured using
anthropometry. Other data with questionnaires. Data
collection was carried out by researchers with the
help of 4 enumerators who had been given previous
guidance and training. The data was analyzed with a
significant degree of 95% (p<0.05) principal
component analysis. This research was carried out
after obtaining a research ethical clearance letter from
the Ethics Committee of the Faculty of Medicine, the
University of Lampung with number
3380/UN26.18/PP.05.02.00/2021.
3 RESULTS
The role of the variables that were energy intake,
protein intake, carbohydrate intake, fat intake, iron
intake, anemia, iron status, protein status, weight gain
during pregnancy, age, education, knowledge,
occupation, income, parity, food taboo, and BMI
before Pregnancy is tested using principal component
analysis (PCA) so that factor names can be obtained
for all these variables. The results of the first/initial
step to carry out factor analysis using the PCA
method are presented in table 1. Based on the results
of the initial PCA analysis test, it was found that the
Kaiser-Meyer-Olkin (KMO) value was 0.692 (greater
than 0.5) so that the factor analysis technique could
be continued and the Bartlett's test of sphericity value
was 0.000 (p<0.05), so the factor analysis in this
study could be continued because it met the
requirements First.
The Measurement System Analysis (MSA) value
for each variable can be seen based on the anti-image
matrix value. Based on the results of PCA analysis,
not all variables have an MSA value >0.5. Variables
that have an MSA value >0.5 are energy intake,
protein intake, carbohydrate intake, fat intake, iron
intake, anemia, iron status, weight gain during
pregnancy, education, income, parity, food taboo, and
BMI before pregnancy. Variables that have an MSA
value <0.5 are protein status, age, knowledge, and
occupation. Because not all variables have an MSA
value >0.5, the second requirement for PCA analysis
is not fulfilled so the analysis cannot continue.
Therefore, the factor analysis process was carried out
using the PCA method again only for variables that
had an MCA value >0.5.
ICOMESH 2023 - INTERNATIONAL CONFERENCE ON MEDICAL SCIENCE AND HEALTH
196

Table 1: Results of Initial Factor Analysis Using the
Principal Component Analysis (PCA) Method
Variables KMO
Bartlett
didn't tes
t
Antiimage
matrix
0.692 0,000
Energy intake
Protein intake
Carbohydrate intake
Fat intake
Iron intake
Anemia
Serum ferritin status
Serum albumin status
Weight gain
Age
Education
Knowledge
Occupation
Income
Parity
Food taboo
BMI before pregnancy
0.725
0.864
0.723
0.769
0.870
0,510
0,522
0,484*
0,561
0,456*
0,509
0,497*
0,487*
0,519
0,725
0,612
0,568
Analysis using the PCA method was carried out
a second time by including the variables energy
intake, protein intake, carbohydrate intake, fat intake,
iron intake, anemia, iron status, weight gain during
pregnancy, education, income, parity, occupation,
and BMI before pregnancy. Based on the results of
the initial PCA analysis test, it was found that the
KMO value was 0.733 (greater than 0.5) so that the
factor analysis technique could be continued and the
Bartlett's test of sphericity value was <0.001
(p<0.05), so the factor analysis in this study could be
continued because it met the requirements First.
The MSA value for each variable can be seen
based on the anti-image matrix value. Based on the
results of PCA analysis, not all variables have an
MSA value >0.5. Variables that have an MSA value
>0.5 are energy intake, protein intake, carbohydrate
intake, fat intake, iron intake, iron status, weight gain
during pregnancy, parity, food taboo, and BMI before
pregnancy. Variables that have an MSA value <0.5
are anemia, education and income. Because not all
variables have an MSA value >0.5, the second
requirement for PCA analysis is not fulfilled so the
analysis cannot continue. Therefore, the factor
analysis process was carried out using the PCA
method again only for variables that had an MCA
value >0.5.
Analysis using the PCA method was carried out
three times by including the variables energy intake,
protein intake, carbohydrate intake, fat intake, iron
intake, iron status, weight gain during pregnancy,
parity, food taboo, and BMI before pregnancy. The
results of the two factor analyses using the principal
component analysis (PCA) method are presented in
table 2. Based on the results of the initial PCA
analysis test, it was found that the KMO value was
0.756 (greater than 0.5) so that the factor analysis
technique could be continued and the Bartlett's test of
sphericity value was <0.001 (p<0.05), so the factor
analysis in this study could be continued because it
met the requirements First.
The MSA value for each variable can be seen
based on the anti-image matrix value. Based on the
results of the PCA analysis, all variables have an
MSA value >0.5 so that the second requirement for
this PCA analysis is met and the analysis can
continue, and this is the result of the final factor
analysis.
The communalities column shows how much the
factors formed can explain the variance of a variable.
The communalities value for all these variables is the
same, namely 1,000, which means that each variable
can explain 100% of the variance of the factors
formed, thus indicating the close relationship between
the variables in question and the factors formed
(Delsen, Wattimena & Saputri, 2017).
Table 2: Final Factor Analysis Results Using the Principal Component Analysis (PCA) Method
Variables KMO
Bartlett
didn't test
Anti-image
matrix
Commu-
nalities
Initia
ei
g
envalue
Eigenvalues
0.756 0,000
Energy intake
Protein intake
Carbo intake
Fat intake
Iron intake
Ferritin status
Weaight gain
Parity
Food taboo
BMI Prepregnancy
0.746 0.898
0.757 0.815
0.882 0.521
0.553 0.754
0.652 0.561
1,000
1,000
1,000
1,000
1,000
1,000
1,000
1,000
1,000
1,000
3,278
1,635
1,095
0.946
0.847
0.597
0.534
0.480
0.365
0.224
3,278
1,635
1,095
Factors Associated with Malnutrition in Pregnancy: A Principal Component Analysis
197
To determine the number of factors formed, it can
be based on the eigenvalue. If there is a total
eigenvalue whose value is less than 1, the factor is
declared unable to explain the variable well, so it is
not included in the formation of the variable (Umar,
2009). The results of the analysis show that the eigen
value shows that the number of variants obtained in
the output results is all three (3) variants, meaning
that there are three (3) groups of factors that may be
formed. These three variables can explain the
variance of the eight items amounting to 60.08%.
This figure is quite large because it is proven to
explain more than 50% of the variance of the variable.
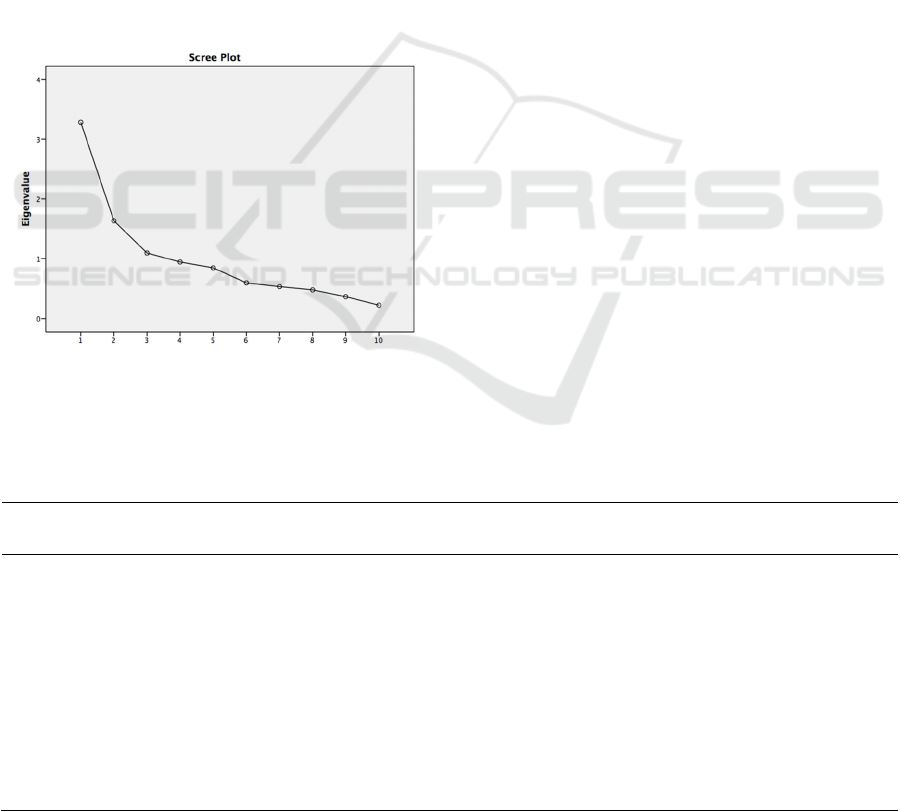
The number of factors can also be determined
from the scree plot. A scree plot is like a broken line.
The point where the scree starts to occur shows the
number of factors, precisely when the scree starts to
flatten, shown by the initial eigen value which is > 1.
The results of the analysis in this study show that the
initial eigen value > 1 is component number 1.
Figure 1. Scree Plot
The results of the analysis then show a
component matrix of factors that associated with
malnutrition in pregnancy. The component matrix
and rotation model are presented in table 3. The
matrix component shows the correlation value
between a variable and the factors formed. The
energy intake variable has the highest variable
correlation on factor 1, that was 0.872 compared to
the correlation on factors 2 and 3, so that the energy
intake variable is on factor 1. The protein intake
variable has the highest variable correlation on factor
1, namely 0.764 compared to the correlation on
factors 2 and 3 so that the protein intake variable is at
factor 1.
The carbohydrate intake variable has the highest
variable correlation on factor 1, that was 0.760
compared to the correlation on factors 2 and 3, so that
the carbohydrate intake variable is on factor 1. The fat
intake variable has the highest variable correlation on
factor 1, that was 0.753 compared to the correlation
on factors 2 and 3 so that the fat intake variable is in
factor 1. The iron intake variable has the highest
variable correlation in factor 1, that was 0.710
compared to the correlation in factors 2 and 3 so that
the iron intake variable is in factor 1.
The iron status variable has the highest
variable correlation in factor 3, that was 0.778
compared to the correlation in factors 1 and 2, so that
the iron status variable is in factor 3. The weight gain
variable during pregnancy has the highest variable
correlation in factor 2, that was 0.821 compared to the
correlation in factors 1 and 3 so that the weight gain
variable during pregnancy is in factor 2. The
abstinence from eating variable has the highest
variable correlation in factor 3, that was 0.650
compared to the correlation in factors 1 and 2 so that
the abstinence from eating variable is in factor 3.
Table 3. Matrix Components and Rotation Model Results of Application Analysis of Factors Associated with Malnutrition in
Pregnancy
Variables Component Rotation Model
1 2 3 1 2 3
Energy intake 0.872* 0.166 0.054 0.732 0.347 0.286
Protein intake 0.764* 0.099 0.081 0.912 0.223 0.215
Carbohydrate- intake 0.760* 0.207 0.156 0.923 0.154 0.205
Fat intake 0.753* 0.125 0.061 0.921 0.165 0.207
Iron intake 0.710* 0.184 0.013 0.928 0.197 0.210
Ferritin status 0.105 0.054 0.77* 0,000 0.014 0.997
Weight gain 0.272 0.82* 0.053 0.011 0.940 0.042
Parity 0.253 0.158 0.56* 0.025 0.064 0.989
Food taboo 0.225 0.161 0.66* 0.084 0.064 0.992
BMI Pre-pregnancy 0.296 0.80* 0.043 0.024 0.938 0.025
ICOMESH 2023 - INTERNATIONAL CONFERENCE ON MEDICAL SCIENCE AND HEALTH
198

The parity variable has the highest variable
correlation on factor 3, that was 0.564 compared to
the correlation on factors 1 and 2, so the parity
variable is on factor 3. The BMI variable before
pregnancy has the highest variable correlation on
factor 2, that was 0.808 compared to the correlation
on factors 1 and 3 so that the BMI variable before
pregnancy is in factor 2. Through the rotation model,
3 rotations of matrix components are produced,
according to the number of factors obtained. From the
results of the analysis it was found that after rotation
there were three variables that were highly correlated
(cut off point = 0.55), that were:
1) Factor 1: energy intake, protein intake,
carbohydrate intake, fat intake and iron intake.
2) Factor 2: weight gain during pregnancy, and BMI
before pregnancy
3) Factor 3: iron status, parity, and food abstinence
4 DISCUSSION
The results of the study show that the factors
associated with the incidence of malnutrition in
pregnancy consist of 3 factors, that were food intake
factors (energy intake, protein intake, carbohydrate
intake, fat intake and iron intake), nutritional status
factors, that were pre-pregnancy BMI and weight
gain during pregnancy, and iron status and cultural
factors (parity and food taboo).
The increase in energy in pregnant women is used
for growth and development of the fetus, placenta and
health maintenance. Pregnant women who consume
food with a number of calories below the
recommended adequacy for a long time will risk
malnutrition which can cause the fetus to grow
imperfectly. Energy should be balanced, otherwise it
will have detrimental effects on the body (Lowensohn
et al., 2016).
When the amount of energy consumed through
food is less than the amount of energy used, there is
an energy deficit. Body weight is therefore lower than
the optimal body weight. It will impede growth in
infants and young children if it happens. In the
meanwhile, it will cause tissue damage and weight
loss if it affects adults (Mahdi et al., 2023).
Insufficient nutritional intake both before and
during pregnancy can cause pregnant women to
become malnourished. The needs of pregnant women
are greater than the needs of non-pregnant women.
Pregnant women's energy needs need to be increased
according to gestational age (Jouanne et al., 2021).
The energy needs of pregnant women in the 1st
trimester are increased by 180 kcal/day, in the 2nd
trimester an additional 300 kcal/day and in the 3rd
trimester an additional 300 kcal/day.
This increased energy is used for growth and
development of the fetus, placenta and health
maintenance. Pregnant women who consume food
with a number of calories below the recommended
intake for many years will risk malnutrition which
can cause the fetus to grow imperfectly (Lowensohn
et al., 2016).
Protein serves as an enzyme and hormone
regulator as well as a building block for the body's
structural proteins, such as collagen and elastin.
Moreover, proteins serve as immune response
mediators and transporters of certain proteins.
Pregnant women's protein requirements must be met
because the fetus's capacity to grow normally
depends on the mother's supply of sufficient protein.
Protein is the basic building material needed for the
formation of enzymes, antibodies, muscles and
collagen. Collagen is used as a framework for skin,
bones, blood vessels and other body tissues (Elango
& Ball, 2016).
During pregnancy the mother consumes enough
protein to meet the increasing needs of herself and the
developing fetus. Protein is a source of energy after
glycogen, being a catalyst for biochemical reactions
in the body, forming the structure of cells and tissues.
Therefore, individuals must get sufficient protein
intake because protein deficiency will have a negative
impact on an individual, especially preconception
women, pregnant women and adolescent girls
(Elango & Ball, 2016).
Carbohydrates are the main source of energy for
humans. Every 1 gram of carbohydrate consumed
produces 4 kcal of energy and the results of the
carbohydrate oxidation process will then be used by
the body to carry out various functions such as
breathing, heart contractions, and to carry out various
physical activities (Morris & Mohiuddin, 2023).
Carbohydrates perform various important
functions for the body, namely as a source of energy,
helping fat metabolism, preventing excessive
breakdown of body protein. Pregnant women who
have a low level of carbohydrate consumption should
consume more bread, rice, cereal, etc., including fruit
and vegetables that contain carbohydrates (Prasetyo,
2017).
Carbohydrate consumption as the largest energy
contributor must be adjusted to the body's needs.
Apart from excessive intake which will cause excess
weight, if the intake is insufficient then malnutrition
will occur. Lack of energy in the body will cause
changes in carbohydrates, proteins or fats to become
energy sources, so that the main function of these
Factors Associated with Malnutrition in Pregnancy: A Principal Component Analysis
199

three nutrients will decrease. If these changes last for
a long time, there will be changes in body weight and
damage to body tissue. Energy in the human body can
arise due to the burning of carbohydrates, proteins
and fats, so humans need sufficient food substances
to meet their energy requirements (Clemente-Suarez
et al., 2022).
Fat functions as a solvent for vitamins A, D, E,
and K. Fat also functions as an energy reserve for the
mother when she gives birth. The need for fat in
pregnant women is very important because it is used
as an energy reserve during and after the birth process
and breastfeeding. Therefore, pregnant women must
consume fat in balanced amounts, neither more nor
less (Duttaroy & Basak, 2021).
Fat functions as a source of calories in preparation
for childbirth and to metabolize vitamins A, D, E and
K. Pregnant women who do not consume enough fat
are feared that they will lack energy during pregnancy
and childbirth which will affect the baby to be born.
Fat also functions in the development of the brain and
nerves, so that if there is a deficiency it can result in
imperfect growth of the fetus's nerves, whereas if the
mother experiences an excess of fat consumption, the
baby and the fetus will accumulate energy. Food
sources that can produce fat are oil, margarine and
butter (Marshall et al., 2022).
Iron requirements increase during pregnancy for
maternal and fetal blood formation. In addition, the
mother's iron stores are needed for 4-6 months after
birth to meet the baby's needs, because the baby's
main food in the form of breast milk contains little
iron. Additionally, mothers lose a lot of blood during
delivery. Sources of iron are animal foods such as
liver, meat, chicken, fish and eggs. Plant foods such
as cereals, nuts and their processed products, as well
as green vegetables but have lower biological
availability (Georgieff, 2020).
The role of iron is very essential in pregnancy, in
fact various health programs are directed at meeting
iron needs during pregnancy, especially through
supplementation and fortification programs. Apart
from that, information exposure through counseling
and various communication media is continuously
carried out to provide a comprehensive understanding
regarding the importance of meeting iron needs in
pregnancy. This causes pregnant women, especially
those with higher education, to be able to accept the
information and health programs provided in an effort
to fulfill their iron needs. Pregnant women with
higher education also show better iron consumption
(Brannon & Taylor, 2017).
The mother's pre-pregnancy BMI is considered to
indicate the quality of the mother's nutrition during
the pre-pregnancy period as well as showing the
availability of nutrients in the mother's body tissues
before pregnancy, which will have an impact on the
mother's health and the growth of the fetus while in
the womb. The risk of giving birth to a small baby for
gestational age decreases along with an increase in
BMI before entering pregnancy. BMI before
pregnancy is the most appropriate research to predict
the quality of the baby born (Bonakdar et al., 2019).
Maternal nutritional adequacy during pregnancy
can also be evaluated through weight gain during
pregnancy. Weight gain during pregnancy is the
difference between initial body weight and final body
weight, where final body weight is the body weight
several weeks before giving birth. Another definition,
weight gain during pregnancy is the difference
between the weight at the end of pregnancy and the
weight at the beginning of pregnancy. Final weight is
the weight at birth. Meanwhile, initial weight is the
weight at the initial pregnancy examination. Under
normal circumstances, the mother's weight gain from
the beginning of pregnancy is calculated from the first
trimester to the third trimester (Mamidi et al., 2017).
Maternal weight gain during pregnancy is directly
correlated with the incidence of malnutrition, because
both reflect the adequacy of pregnant women's food
intake during pregnancy. Insufficient pregnancy
weight gain will cause the risk of stunted fetal growth
(IUGR, LBW, PBLR) and prematurity (Abubakari et
al., 2023).
Iron status in the body can be assessed based on
the ferritin indicator, which shows iron stores in the
first stage of iron depletion. Ferritin is formed when
apoferritin binds to iron. Ferritin, which is the main
storage form of iron in the body, is mainly found in
the liver, pancreas and spinal cord. In healthy
humans, approximately 30% of iron is found in
storage form, mainly as ferritin and partly as
hemosiderin. If iron reserves are depleted, ferritin in
the tissue decreases. Measurement of ferritin
concentration is the most sensitive index for detecting
iron deficiency before morphological changes are
seen in red blood cells, and before anemia occurs
(Martinez et al., 2021).
Parity is one of the factors causing malnutrition in
pregnant women. Parity is the number of children
born to a mother. Parity is divided into nullipara,
primipara, multipara and grandemultipara. Nullipara
is a woman who has never given birth to a fetus,
primipara is a woman who has given birth to a fetus
once, multipara is a woman who has given birth to a
fetus >1x, and grandemultipara is a woman who has
given birth to a fetus >5x (Cunningham et al., 2018).
ICOMESH 2023 - INTERNATIONAL CONFERENCE ON MEDICAL SCIENCE AND HEALTH
200

Parity is a risk factor for malnutrition in
pregnancy. Pregnant women who have a parity of
more than 4 people are at greater risk of malnutrition
compared to mothers who have a parity of less than 4
people. Pregnancies that are too frequent (high
parity), that was a mother who already has three
children and another pregnancy occurs, her health
condition will begin to decline (Karemoi et al., 2020).
Food taboos are foodstuffs or dishes that cannot
be eaten by individuals in society for cultural reasons.
Some dietary taboo patterns are only adhered to by a
certain group of people or by a larger portion of the
population. Other patterns only apply to groups
within a particular population and at a particular time.
If the taboo pattern applies to the entire population
and throughout life, nutritional deficiencies are less
likely to develop as if the taboo only applies to a
certain group of people during one stage of the cycle
(Chakona & Shackleton, 2019).
Some dietary restrictions are only adhered to by a
certain group of people or by a larger part of the
population. Other patterns only apply to certain
groups within a population and at certain times. If the
pattern of abstinence applies to the entire population
and throughout life, nutritional deficiencies are less
likely to develop as if the taboo only applies to a
certain group of people during one stage of the cycle
(Ojo et al., 2023).
REFERENCES
Abubakari A., Asumah MN., Abdulai NZ. 2023. Effect of
maternal dietary habits and gestational weight gain on
birth weight: an analytical cross-sectional study among
pregnant women in the Tamale Metropolis. Pan Afr
Med J; 44: 1-19.
Bonakdar SA., Motlagh ARD., Bagherniya M., Ranjbar G.,
Khotbehsara RD., Mohajeri SAR, et al. 2019. Pre-
pregnancy Body Mass Index and Maternal Nutrition in
Relation to Infant Birth Size. Clinical Nutrition
Research; 8(2): 129–137.
Brannon PM., & Taylor CL. 2017. Iron Supplementation
during Pregnancy and Infancy: Uncertainties and
Implications for Research and Policy. Nutrients; 9: 1-
17.
Chakona G & Shackleton C. 2019. Food Taboos and
Cultural Beliefs Influence Food Choice and Dietary
Preferences among Pregnant Women in the Eastern
Cape, South Africa. Nutrients; 11(11): 1-18.
Clemente-Suarez VJ., Mielgo-Ayuso J., Martin-Rodriguez
A., Ramos-Campo DJ., Redondo-Florez L., Tornero-
Aguilera JF. 2022. The Burden of Carbohydrates in
Health and Disease. Nutrients; 14(18): 1-28.
Cunningham, Leveno, Bloom, Dashe, Hoffman, Casey, et
al. 2018. Williams Obstetrics. 25th edition, New York:
McGrawHill Education.
Dukhi N. 2020. Global Prevalence of Malnutrition:
Evidence from Literature. Ebook. Intechopen, Europe.
Duttaroy AK., & Basak S. 2021. Maternal Fatty Acid
Metabolism in Pregnancy and Its Consequences in the
Feto-Placental Development. Front Physiol; 12: 1-16.
Elango R., & Ball RO. 2016. Protein and Amino Acid
Requirements during Pregnancy. Advances in
Nutrition; 7(4): 839S-844S.
Gebre B., Biadgilign S., Taddese Z., Legesse T., Letebo, M.
2018. Determinants of malnutrition among pregnant
and lactating women under humanitarian setting in
Ethiopia. BMC Nutrition; 4(11): 1-8.
Georgieff M. 2020. Iron Deficiency in Pregnancy. Am J
Obstet Gynecol; 223(4): 516–524.
Jouanne M., Oddoux S., Noel A., Voisin-Chiret AS. 2021.
Nutrient Requirements during Pregnancy and
Lactation. Nutrients; 13(2): 1-17.
Karemoi TM., Mardiah W., Adistie F. 2020. Factors
Affecting Nutritional Status of Pregnant Women: A
Literature Study. Asian Community Health Nursing
Research; 2(2): 39-47.
Lowensohn RI., Stadler DD., Naze C. 2016. Current
Concepts of Maternal Nutrition. Obstet Gynecol Surv;
71(7): 413–426.
Mahdi S., Dickerson A., Solar GI., Caton SJ. 2023. Timing
of energy intake and BMI in children: differential
impacts by age and sex. The British Journal of
Nutrition; 130(1): 71–82.
Mamidi RS., Banjara SK., Manchala S., Babgu CK.,
Geddam JJB., Boiroju NK., et al. 2022. Maternal
Nutrition, Body Composition and Gestational Weight
Gain on Low Birth Weight and Small for Gestational
Age—A Cohort Study in an Indian Urban Slum.
Children; 9(10): 1-17.
Marshall NE., Abrams B., Barbour LA., Catalano P.,
Christian P., Friedman JE., et al. 2022. The importance
of nutrition in pregnancy and lactation: lifelong
consequences. Am J Obstet Gynecol; 226(5): 607–632.
Martinez RX., Perez LL., Rosas JPP. 2021. Serum or
plasma ferritin concentration as an index of iron
deficiency and overload. Cochrane Database Syst Rev;
2021(5): 17.
Ministry of Health of the Republic of Indonesia. 2015.
Guidelines for Managing Chronic Energy Deficiency
(CED) in Pregnant Women. Jakarta: Directorate
General of Nutrition Development and Child-Maternal
Health, Ministry of Health, Republic of Indonesia.
Morris AL., & Mohiuddin SS. 2023. Biochemistry &
Nutrients. StatPearls Publishing, London.
Norman K., Hab U., Pirlich M. 2021. Malnutrition in Older
Adults—Recent Advances and Remaining Challenges.
Nutrients; 13: 1-20.
Ojo AS., Nnyanzi LA., Giles EL., Ells LJ., Awolaran O.,
Okeke SR., et al. 2023. Perceptions of dietary intake
amongst Black, Asian and other minority ethnic groups
in high-income countries: a systematic review of
qualitative literature. BMC Nutrition; 9: 1-17.
Factors Associated with Malnutrition in Pregnancy: A Principal Component Analysis
201

Prasetyo D. 2017. The Relationship Between Macronutrient
Intake and the Risk of Chronic Energy Deficiency in
Pregnant Women in North Pontianak District in 2017.
Thesis, Faculty of Health Sciences, Muhammadiyah
University of Pontianak, Pontianak.
Saha S., Pandya AK., Raval D., Wanjari, MB., Saxena, D.,
2022. A Study of Maternal Anemia and Utilization of
Antenatal and Postnatal Care Services in Devbhumi
Dwarka, Gujarat. Cureus; 14(10): 1-14.
Serbesa ML., Iffa MT., Geleto M. 2019. Factors associated
with malnutrition among pregnant women and lactating
mothers in Miesso Health Center, Ethiopia. Europan
Journal of Midwifery; 3 (13): 1-5.
United Nations Children’s Fund (UNICEF), 2015.
UNICEF’s approach to scaling up nutrition for mother
and their children. Nutrition Section, Programme
Division United Nations Children’s Fund (UNICEF).
New York: UNICEF.
ICOMESH 2023 - INTERNATIONAL CONFERENCE ON MEDICAL SCIENCE AND HEALTH
202
