
Analysis of the Relationship Between LEB and PM 2.5 for Some
Developed and Developing Countries in Asia from 2014 to 2023
Sri Hasnawati
1,* a
, Edwin Russel
2b
and Mustofa Usman
3c
1
Department of Developing Economic, Universitas Lampung, Bandar Lampung, Indonesia
2
Department of Management, Universitas Lampung, Bandar Lampung, Indonesia
3
Department of Mathematics, Universitas Lampung, Bandar Lampung, Indonesia
Keywords: LEB, PM2.5, Multiple Regression, Dummy Variables, Developed Countries, Developing Countrie.
Abstract: Research regarding the relationship between LEB and PM2.5 in several developed and developing
countries in ASIA is interesting to be analyzed, because it is not many discussed by researchers. The data
to be analyzed is taken from several developed countries in ASIA (China and Japan) and several
developing countries in ASIA (Indonesia and Malaysia). The aim of this research is to determine the
effect of PM2.5 on LEB. The data analysis used is multiple regression with dummy variables for the
categories of developed and developing countries. The analysis results show that there is a negative
relationship between PM2.5 and LEB. This shows that the healthier the environment, which is
characterized by low PM2.5, the higher the LEB. Developed countries (Japan and China) has a high LEB,
while developing countries (Indonesia and Malaysia) have a low LEB compared to developed countries.
Because countries in developed countries generally have better access to pollution control technology and
better infrastructure.
1
INTRODUCTION
World Bank statistics for 2022 state that LEB in East
Asia and the Pacific generally has an increasing trend
in LEB from 1960 to 2021 with LEB between 65 and
85 years. In Asia, Japan has the highest LEB and PNG
has the lowest. The increase in LEB is due to many
factors such as access to health services, increasing
living standards, and advances in the medical field.
However, several countries in Asia face air pollution
problems, including high levels of PM2.5. Large
cities and industrial areas tend to have higher levels of
air pollution. PM2.5 are small particles found in the
air and can have a negative impact on human health
when inhaled.
The research results of Kiesewetter et al (2015),
shows that there is a correlation between the level of
exposure to PM2.5 and the life expectancy of
residents of a region. Exposure toPM2.5 can cause
serious health problems such as respiratory problems,
cardiovascular disease, and cancer, which in turn can
a
https://orcid.org/0000-0001-7235-7023
b
https://orcid.org/0000-0003-3074-6615
c
https://orcid.org/0000-0003-2649-0899
affect life expectancy. Furthermore, research
conducted in Southeast Asian countries, including
ASEAN countries, found that exposure to PM2.5
contributed to an increased risk of premature death
and decreased life expectancy, Fann et al (2012),
Chen et al (2019). High PM2.5 is closely related to
economic growth and the level of development of a
country Badulescu et.al (2019). But, countries with
high GDP generally have better access to pollution
control technology and better infrastructure, which
allows them to reduce emissions of air pollutants,
including PM2.5.
Based on this literature review, it is appropriate to
research the relationship between PM2.5 and LEB
between developed and developing countries in Asia.
Is there a difference in the impact of PM2.5 and LEB
between developed and developing countries in Asia
based on descriptive analysis and the best statistical
modelling.
178
Hasnawati, S., Russel, E. and Usman, M.
Analysis of the Relationship Between LEB and PM 2.5 for Some Developed and Developing Countries in Asia from 2014 to 2023.
DOI: 10.5220/0013667800003873
Paper published under CC license (CC BY-NC-ND 4.0)
In Proceedings of the 1st International Conference on Medical Science and Health (ICOMESH 2023), pages 178-181
ISBN: 978-989-758-740-5
Proceedings Copyright © 2025 by SCITEPRESS – Science and Technology Publications, Lda.
2
LITERATURE REVIEW
Human exposure to PM2.5 produces various negative
health impacts with significant social impacts,
Martins & Da Graca (2018). PM2.5 enters the human
body through air that flows into the respiratory tract
and reaches the alveoli of the lungs. Ultimately,
PM2.5 has been identified as the cause of a large
number of deaths in various regions of the world
(Harrison et al., 2017; Gao et al, 2016). In 2019, air
pollution, which mostly consists of PM2.5, was found
to be the cause of nearly 800 thousand deaths per year
in Europe. In 2015, in China, 15.5% of all deaths,
CongBo et al, (2017) and 32% of deaths in
China's
major cities, Fang et al, (2016) were attributed
to
exposure to PM2.5. Many of these health impacts,
most of which affect the respiratory and
cardiovascular systems, are similar to the effects of
smoking tobacco (CongBo et al, 2017; Britton, 2017;
Kurt et.al, 2016). Likewise, the impact of PM2.5 also
causes a decrease in LEB. Furthermore, research on
the relationship between PM2.5 and LEB in
developed and developing countries conducted by
Chen (2021), found that PM 2.5 did not have a
significant effect on LEB in developed countries; but
it has a negative impact on LEB in developing
countries. Apart from that, it was also found that
carbon dioxide emissions have a negative impact on
LEB in both developed and developing countries.
3
METHOD OF ANALYSIS
In this research, the data that will be analyzed are
LEB, PM2.5 and several developed and developing
countries. The dependent variable is LEB and the
independent variable is PM2.5 and the country as a
dummy variable. The model to be used is as follows:
Model linear the relationship of LEB, PM2.5 and
countries:
𝐿𝐸𝐵 = 𝜇 + 𝛽
1
𝑃𝑀2.5 + 𝛽
2
𝐷1 + 𝜀
(
1
)
Where
LEB : Life expectancy at birth
PM2.5 : Particle
D1 : 1 if developed country
0 if developing country
ɛ : residual
4
RESULTS AND DISCUSSION
In this research, we will discuss the relationship
between PM2.5 and LEB from several developed and
developing countries in Asia. For developed
countries, Japan and China are taken, while for
developing countries Indonesia and Malaysia are
taken. The analysis used in this research is multiple
regression with dummy variables for the categories of
developed countries and countries.
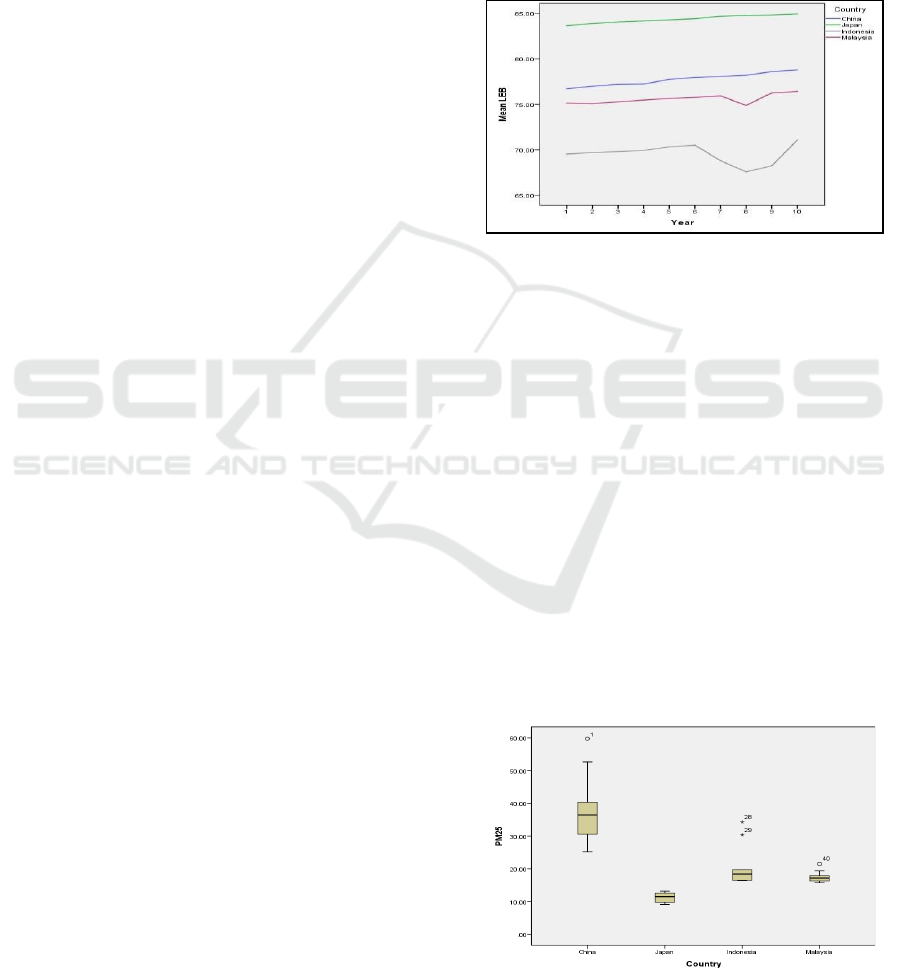
Figure 1: LEB data for China, Japan, Indonesia and
Malaysia from 2014 to 2023.
Figure 1 shows that Japan's LEB is higher than
China, Indonesia and Malaysia, China's LEB is
higher than Indonesia's and Malaysia's LEB, and
Malaysia's LEB is higher than Indonesia. Figure 1
shows that the LEB Plot for Malaysia and Indonesia
from 2020 to 2022 has changed with the LEB
decreasing, this happened during the Covid-19
pandemic. However, during Covid-19, there is no
influence of LEB in Japan and China (Figure 1).
Figure 2 shows that PM 2.5 conditions in China
are relatively high compared to three other countries,
Japan, Indonesia and Malaysia. The minimum
PM2.5 value was 25.20 and the highest was 59.77 in
China. Japan's PM2.5 conditions are relatively low
compared to China, Indonesia and Malaysia. The
minimum PM2.5 value is 9.10 and the highest is
13.20 in Japan. Figure 2 shows that PM2.5 conditions
in Indonesia and Malaysia are relatively the same.
Figure 2: Box plot of PM2.5 in China, Japan, Indonesia
and Malaysia from 2014 to 2023.
Analysis of the Relationship Between LEB and PM 2.5 for Some Developed and Developing Countries in Asia from 2014 to 2023
179
From the analysis by using model 1, it was found
that:
Table 1: Analysis variance for model (1)
Source D F
Sum of
Squares
Mean
Square
F
-
Value
P-value
Model
2
936.92215
468.46107
84.66
<.0001
Error 37 204.72761 5.53318
Corrected
Total
39
1141.6497
6
R-Square = 0.8207
Table 1 shows the model 1 test with the null
hypothesis that the model is not significant. From the
results of the F test=84.66 with p-value<0.0001, we
can conclude that the null hypothesis is rejected,
which means the model can be used to explain LEB.
The results of R-square = 0.8207 indicate that 82.07%
of LEB variation can be explained by the model.
The estimate model is as follows:
LEB
ˆ
=
76.486
−
0.205PM2.5
+
9.618
D1
The parameter test results are presented in Table 2
below.
Table 2: The estimation and test parameter model 1.
Varia ble DF
Parameter
Estimate
Stand ard
Error
t Value Pr >|t|
Interc e
p
t
1
76.48605 0.8189
7
93.39
<
.0001
PM25
1
-0.20508 0.0328
5
-6.24
<
.0001
D1
1
9.61837 0.7653
9
12.57
<
.0001
Table 2 shows that the test for the Intercept, PM2.5,
and D1 parameters each has a p-value <0.0001,
which shows that the test results are very
significantly different from zero.
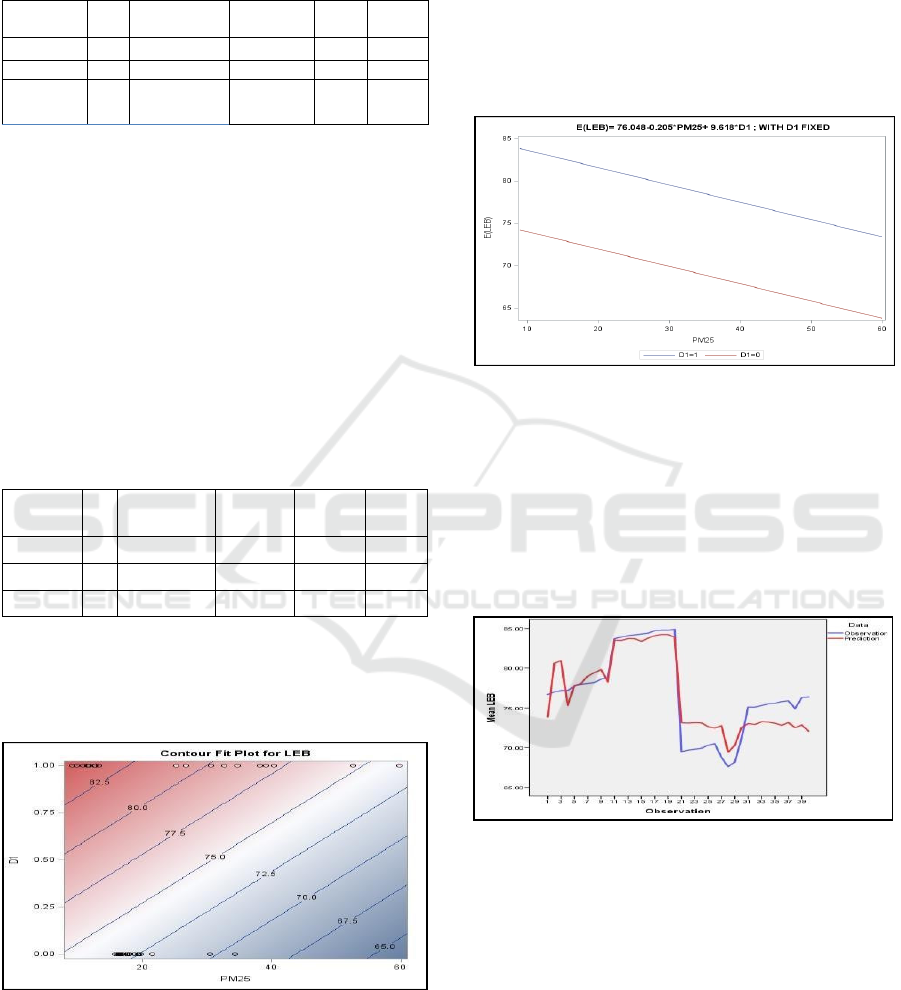
Figure 3: Contour Fit Plot for LEB Model (1)
The contour shows that the LEB of developed
countries (Japan and China) has a high LEB value in
red, while developing countries (Indonesia and
Malaysia) have a low LEB value compared to
developed countries. Figure 3 and the analysis results
in table 2 where the coefficient of the PM2.5
parameter is negative, namely (-0.20508) which
shows that there is a negative relationship between
PM2.5 and LEB, which means the lower the PM2.5
the higher the LEB or in other words the higher
environmentally healthy LEB is getting higher. This
is also shown from the analysis results presented in
Figure 4 below.
Figure 4: Comparison of LEB between developed countries
(China and Japan) and developing countries (Indonesia and
Malaysia)
Figure 4 confirms the results of the analysis above
that there is a negative relationship between LEB and
PM2.5 in the four countries discussed in this research,
namely the lower the PM2.5 conditions, the higher
the LEB value, which means a healthy environment
will cause high LEB.
Figure 5: Observed and predicted LEB values by using
model 1
Figure 5 shows that the observed and predicted
LEB values have the same pattern and are relatively
close to each other, this shows that the modeling used
is quite good.
5 CONCLUSSION
Research on the relationship between environmental
conditions (PM2.5) and LEB has
attracted many
ICOMESH 2023 - INTERNATIONAL CONFERENCE ON MEDICAL SCIENCE AND HEALTH
180

researchers in the health sector. In this
research, the
relationship between LEB and PM2.5 between
developed countries (China and Japan) and
developing countries (Indonesia and Malaysia) in
Asia is discussed using multiple regression analysis
with dummy variables. The results show that the
model is significant. The relationship between LEB
and PM2.5 with data from 2014 to 2023 shows a
negative relationship, this shows that the healthier the
environment, the higher a country's LEB.
ACKNOWLEDGEMENT
The authors would like to thank to the HETI project
and University of Lampung for the financial support
for academic year 2023-2024 for this study.
REFERENCES
Kiesewetter, G., Schoepp, W., Heyes, C., & Amann, M.
(2015). Modelling PM2.5 impact indicators in Europe:
Health effects and legal compliance. Environmental
Modelling & Software, 74, 201-211.
Chen, C., Chen, P., & Yang, C. (2019). Relationship
between fine particulate air pollution exposure and
human adult life expectancy in Taiwan. Journal of
Toxicology and Environmental Health, Part A, 82, 826
- 832.
Badulescu, D., Simut, R., Badulescu, A., & Badulescu, A.
V. (2019). The relative effects of economic growth,
environmental pollution and non-communicable
diseases on health expenditures in European Union
countries. International journal of environmental
research and public health, 16(24), 5115.
Martins, N. R., & Da Graca, G. C. (2018). Impact of PM2.5
in indoor urban environments: A review. Sustainable
Cities and Society, 42, 259-275.
Fann, N., Lamson, A. D., Anenberg, S. C., Wesson, K.,
Risley, D., & Hubbell, B. J. (2012). Estimating the
national public health burden associated with exposure
to ambient PM2. 5 and ozone. Risk Analysis: An
International Journal, 32(1), 81-95.
Song, C., He, J., Wu, L., Jin, T., Chen, X., Li, R., Ren,
P., Zhang, L., Mao, H. (2017). Health burden
attributable to ambient PM2. 5 in China.
Environmental pollution, 223, 575-586.
Harrison, R.M., Harrison, R.M., Bousiotis, D., Mohorjy,
A.M., Alkhalaf, A.K., Shamy, M.Y., Alghamdi,
M.A., Khoder, M.I., & Costa, M. (2017). Health risk
associated with airborne particulate matter and its
components in Jeddah, Saudi Arabia. The Science of the
total environment, 590-591, 531-539.
Gao, M., Guttikunda, S.K., Carmichael, G.R., Wang, Y.,
Liu, Z., Stanier, C.O., Saide, P.E., & Yu, M. (2015).
Health impacts and economic losses assessment of the
2013 severe haze event in Beijing area. The Science of
the total environment, 511, 553-61.
Fang, D., Wang, Q., Li, H., Yu, Y., Lu, Y., & Qian, X.
(2016). Mortality effects assessment of ambient PM2.5
pollution in the 74 leading cities of China. The Science
of the total environment, 569-570, 1545- 1552.
Britton, J.R. (2017). Death, disease, and tobacco. The
Lancet, 389, 1861-1862.
Kurt, O.K., Zhang, J., & Pinkerton, K.E. (2016). Pulmonary
health effects of air pollution. Current Opinion in
Pulmonary Medicine, 22, 138–143.
Chen, Z., Ma, Y., Hua, J., Wang, Y., & Guo, H. (2021).
Impacts from Economic Development and
Environmental Factors on Life Expectancy: A
Comparative Study Based on Data from Both
Developed and Developing Countries from 2004 to
2016. International Journal of Environmental
Research and Public Health, 18.
Analysis of the Relationship Between LEB and PM 2.5 for Some Developed and Developing Countries in Asia from 2014 to 2023
181
