
Nutritional Status, Blood Glucose, and Blood Pressure as Factors for
Early Detection of Metabolic Risk in College Students: Observational
Research
Adi Sucipto
1,* a
, Desty Ervira Puspaningtyas
2b
, Puspita Mardika Sari
2c
,
Silvia Dewi Styaningrum
2
, Dwita Mukti Rahmawati
2
, Getha Puji Lestari
2
,
Renata Deby Sintia
2
and Dhea Putri Ananda
2
1
Nursing Program, Faculty of Health Sciences, Respati University Yogyakarta. Yogyakarta 55281, Indonesia
2
Nutrition Program, Faculty of Health Sciences, Respati University Yogyakarta. Yogyakarta 55281, Indonesia
Keywords: Metabolic Syndrome, Body Mass Index, Blood Glucose, Blood Pressure.
Abstract: Metabolic health problems are increasingly receiving attention among students because modern lifestyles tend
to be less active and unhealthy eating habits. Nutritional status, random blood glucose, and blood pressure are
important indicators that can provide an overview of a person's metabolic health status. Low awareness of the
importance of metabolic disorders early detection and lack of understanding of the relationship between
nutritional status, random blood glucose, and blood pressure can cause delays in preventative action and
management of the risk of metabolic disorders. This study aims to determine the relationship between
nutritional status, random blood glucose, and blood pressure as factors for early detection of the risk of
metabolic disorders in students. This observational study with a cross-sectional approach was conducted in
July 2023 in Universitas Respati Yogyakarta and carried out on health students from several health study
programs taken by accidental sampling. The number of samples in the research was 35 respondents. The
instruments used were microtoise, body scales, digital blood pressure meter, glucometer, and recording sheet.
The respondents' average body mass index (BMI) was 25.84, with a body weight of 63.76 kg and a height of
157.31 cm. Respondents' average random blood glucose and blood pressure were respectively 89.63 mg/dL
and 112/80 mmHg. Body weight and BMI correlate fairly strongly with diastolic blood pressure, with r=0.394
(p=0.019) and r=0.414 (p=0.013). A relationship exists between body weight and BMI with diastolic blood
pressure. It is hoped that the research results will provide further insight into the importance of early detection
of metabolic risk in students so that it becomes a more effective prevention and health intervention strategy
in the campus environment.
1 INTRODUCTION
College is a critical phase of life, where students face
new academic, social, and environmental demands
that can impact their health. A health problem that is
often found is metabolic syndrome disorder.
Metabolic syndrome is a group of symptoms from
various cardiometabolic risk factors including insulin
resistance, glucose intolerance, dyslipidemia, and
central obesity. This condition increases the risk of
a
https://orcid.org/0000-0001-6740-1835
b
https://orcid.org/0000-0002-4943-2707
c
https://orcid.org/0000-0003-2100-6703
*
Corresponding author
cardiovascular disease, type 2 diabetes, orthopedic
problems, and mental disorders (Djausal, 2015).
Someone is categorized to suffer from metabolic
syndrome if they experience at least three of five
conditions, namely hypertension (high blood
pressure), low HDL levels (dyslipidemia), high
triglyceride levels, high blood sugar levels or
prediabetes, and obesity with fat accumulation in the
abdomen (Rahma Listyandini, Fenti Dewi Pertiwi,
2020)
50
Sucipto, A., Puspaningtyas, D. E., Sari, P. M., Styaningrum, S. D., Rahmawati, D. M., Lestar i, G. P., Sintia, R. D. and Ananda, D. P.
Nutritional Status, Blood Glucose, and Blood Pressure as Factors for Early Detection of Metabolic Risk in College Students: Obser vational Research.
DOI: 10.5220/0013660300003873
Paper published under CC license (CC BY-NC-ND 4.0)
In Proceedings of the 1st International Conference on Medical Science and Health (ICOMESH 2023), pages 50-54
ISBN: 978-989-758-740-5
Proceedings Copyright © 2025 by SCITEPRESS – Science and Technology Publications, Lda.

Metabolic diseases have increased significantly
among the global population. Previous research
showed that the prevalence of metabolic syndrome
among the global population is 20-25% (Rini, 2015).
College students, as a relatively young age group, are
often considered to be at low risk for these diseases.
However, lifestyle changes, unhealthy diets, and high
levels of stress can lead to increased metabolic risk in
this group. The results of a research study conducted
by Wohangara and Santoso showed that the majority
of the nutritional status of Tarumanagara University
students class of 2017 was obese (45.2%), did not
exercise (41.1%), and had the habit of consuming
junk food once per week (Wohangara and Santoso,
2021). Cases of metabolic syndrome in adolescents
have increased over the past year last decade.
Research conducted by Dieny et al found that the
increase in the incidence of metabolic syndrome in
adolescents was caused mainly by an increase in
obesity rates among adolescents (Dieny, Widyastuti
and Fitranti, 2015).
Some of the reasons for the increase in the
prevalence of metabolic syndrome in teenagers are
due to lack of physical activity, fast food, stress, lack
of sleep, and high sugar (Rochmah et al., 2014).
Students tend to spend a lot of time in front of screens,
whether studying, working, or socializing digitally,
which can lead to a decrease in physical activity.
Apart from that, unhealthy food choices and the habit
of consuming drinks high in sugar also contribute to
the increased risk of metabolic health problems
among students.
This situation is a serious concern because
metabolic health problems can impact academic
performance, psychological well-being, and overall
quality of life (Rochmah et al., 2014). Students who
experience metabolic health problems tend to face a
high risk of long-term illnesses, such as type 2
diabetes, heart disease, and other health problems.
Therefore, further understanding of the factors that
cause and influence metabolic health problems
among students is very important to develop effective
prevention and intervention strategies, one of which
is through early detection of the risk of metabolic
syndrome. Early detection can be done by carrying
out routine checks such as adolescent nutritional
status, blood pressure, and blood glucose levels in
adolescents. Therefore, regular examinations are key
in preventing and managing metabolic syndrome in
adolescents (Sihombing and Tjandrarini, 2015).
2 METHODS
This research is an observational study with a cross-
sectional approach. This study aims to determine the
relationship between nutritional status, random blood
glucose, and blood pressure as factors for early
detection of the risk of metabolic disorders in
students. Data collection was carried out at the
Anthropometry Laboratorium, Universitas Respati
Yogyakarta in July 2023. This research population
was active students of the Faculty of Health Sciences,
Universitas Respati Yogyakarta totaling 35 students.
The sampling process is carried out by accidental
sampling. The tools used in collecting data are
microtoise, body scales, digital sphygmomanometers,
glucometers, and recording sheets.
The data collection process is carried out by taking
anthropometric measurements (body weight and
height) first, after that measuring blood pressure and
checking blood glucose which are then recorded in an
observation sheet. The data collection process was
assisted by three student research assistants who
played a role in anthropometric measurements and
blood pressure checks. All assistants have obtained
previous perceptions to be able to carry out valid
measurements on respondents.
All respondents were explained the entire research
process, their rights, and obligations. Respondents
signed informed consent as an agreement to
participate in the research. The data collection
process is carried out after obtaining the ethical
clearance from the Health Research Ethics
Commission, Faculty of Health Sciences, Universitas
Respati Yogyakarta with number
056.3/FIKES/PL/V/2023 and research permit number
088/PPPMPL-Eks/V/2023. The data normality test
used Shapiro Wilk because the sample size was <50
people. Normality test results for body weight, body
height, body mass index (BMI), random blood
glucose, and diastolic blood pressure were normal
(>0.05). The bivariate variable test uses the Annova
because the data is from more than 2 categories and
is normally distributed. For the data not normally
distributed, the statistical analysis used is Kruskal-
Wallis.
3 RESULTS AND DISCUSSION
Table 1 presents the data on respondent
characteristics. Based on the characteristics of the
respondents, it is known that the normality test results
Nutritional Status, Blood Glucose, and Blood Pressure as Factors for Early Detection of Metabolic Risk in College Students: Observational
Research
51
with Shapiro-Wilk showed that age and systolic blood
pressure data were not normally distributed.
Table 1. Characteristics of Respondents
Variable Mean±SD p
#
Age (years) 22 (20
–
23)* <0.001
Bod
y
wei
g
ht
(
k
g)
63.76±15.16 0.064
Hei
g
ht
(
cm
)
157.31±6.12 0.395
BMI
(
k
g
/m
2
)
25.84±6.41 0.083
Random blood glucose
(
m
g
/dL
)
89.63±12.78 0.497
S
y
stolic blood
p
ressure 112
(
99
–
136
)
* 0.004
Diastolic blood
p
ressure 80.54±8.42 0.093
*median (minimum-maximum)
#normality test with Shapiro-Wilk
The median age of respondents is 22 years with a
minimum age of 20 years and a maximum of 23 years.
The average body weight of respondents was 63.76
kg with a standard deviation (SD) of 15.16 kg. The
average height of respondents was 157.31 cm with an
SD of 6.12 cm. The average body mass index (BMI)
of respondents was 25.84 kg/m2 with a SD of 6.41
kg/m2. The mean random blood glucose (GDS) was
89.63 mg/dL with an SD of 12.78 mg/dL. The median
systolic blood pressure is 112 mmHg with a minimum
and maximum range of 99-136 mmHg, while the
average diastolic blood pressure is 80.54 mmHg with
an SD of 8.42 mmHg.
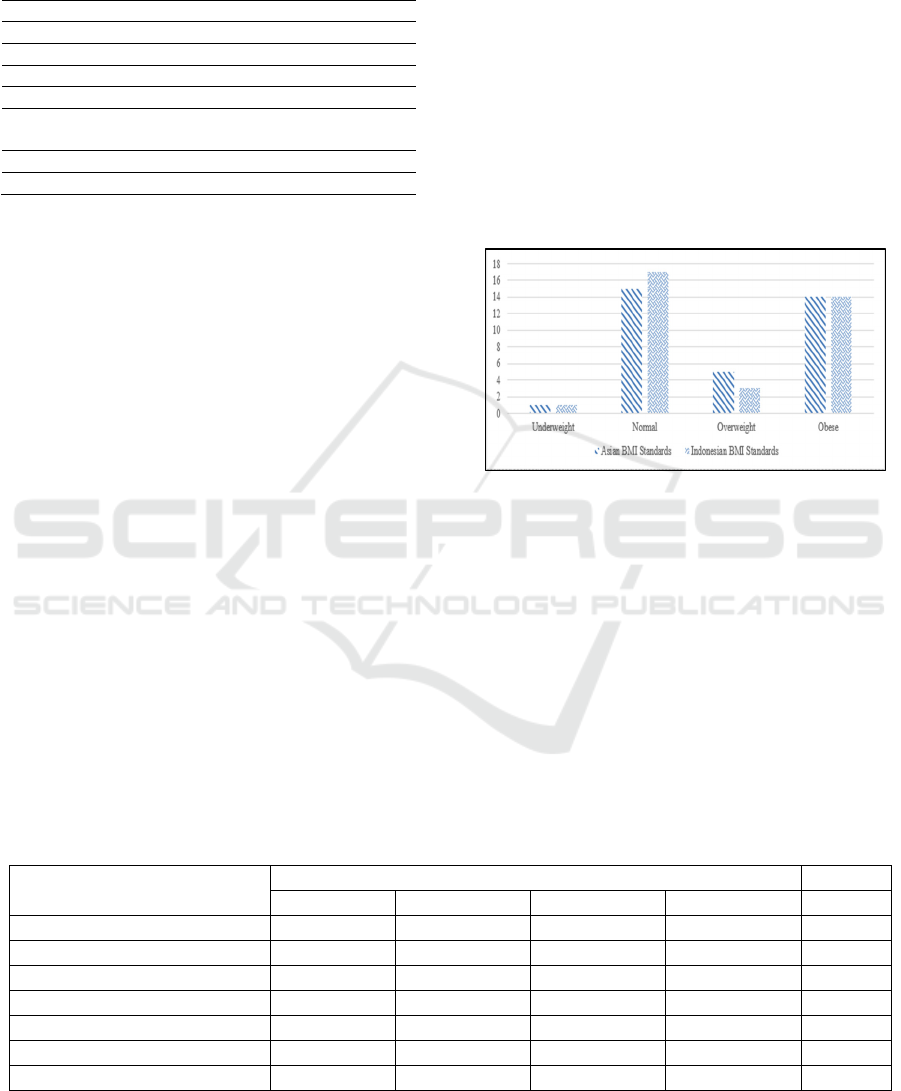
Based on Figure 1, there is a difference in
nutritional status based on Asian standards and
Indonesian standards. Based on Asian standards, the
number of respondents in the normal category is less
than the Indonesian standard. Meanwhile, the Asian
standard overweight category is higher than the
Indonesian standard. This is because the Asian
standard categorization range for normal BMI is
narrower than the Indonesian standard, in which the
Asian standard for normal BMI is 18.5 – 22.9 kg/m
2
while the Indonesian standard for normal BMI is 18.5
– 25 kg/m
2
(Iqbal and Puspaningtyas, 2018).
Table 2 shows differences in the characteristics of
health indicators based on nutritional status based on
Asian standards. The median age for underweight and
normal group is 21 years, with an age range between
20 and 23 years. Body weight increased along with
increasing nutritional status, with the highest value in
the obesity group (78.01 ± 11.66 kg) and the lowest
in the underweight (44.2 kg). The average height of
the normal group (159.13 ± 6.29 cm) tends to be
higher than the nutritional status of other groups. BMI
increased along with increasing nutritional status,
with the highest value in the obesity group (32.39 ±
4.57 kg/m2) and the lowest in the underweight group
(18.16 kg/m2).
Figure 1. Distribution of Nutritional Status Based on Asian
Standards and Indonesian Standards
The average random blood glucose in each group
was within the normal range (73-90 mg/dL). Median
systolic and diastolic blood pressure for each group
was within the normal range. There were no
significant differences in age, height, random blood
glucose, or systolic diastolic blood pressure between
the underweight, normal, overweight, and obese
groups (p=0.700; 0.378; 0.614; 0.693; 0.216). There
are significant differences in body weight and BMI
between the underweight, normal, overweight, and
obese nutritional status groups (p<0.001).
Table 2. Differences in Characteristics of Health Indicators Based on Asian Standard Nutritional Status
Variable
Mean ± SD
Underweight Normal Overweight Obesity p
Age (years) 21 21 (20-23)* 22 (20-23)* 22 (20-23)* 0.700*
Body weight (kg) 44.2 52.12± 6.74 62.68 ± 6.17 78.01± 11.66 <0.001*^
Height (cm) 156 159.13± 6.29 158.10 ± 6.18 155.16 ± 5.88 0.378**
BMI (kg/m
2
) 18.16 20.51± 1.43 25.03 ± 1.19 32.39 ± 4.57 <0.001*^
Random blood glucose (mg/dL) 73 89.93± 14.29 88.40 ± 7.23 90.93 ± 12.93 0.614**
Systolic blood pressure 112 113 (99-136)* 111 (104-116)* 116 (104-136)* 0.693*
Diastolic blood pressure 84 78.73± 7.29 76.00 ± 6.32 83.86 ± 9.56 0.216**
*median (minimum-maximum)
# kruskal-wallis
**Annova
^significant at p<0.001
ICOMESH 2023 - INTERNATIONAL CONFERENCE ON MEDICAL SCIENCE AND HEALTH
52
Table 3. Differences in Characteristics of Health Indicators Based on Indonesian Standard Nutritional Status
Variable
Mean ± SD
Underweight Normal Over
weight
Obesity
p
A
g
e
(y
ears
)
21 22
(
20-23
)
*21
(
20-22
)
*22
(
20-23
)
* 0.568*
Bod
y
wei
g
ht
(
k
g)
44.2 52.89 ± 6.72 65.37 ± 6.61 78.01 ± 11.66 <0.001*^
Hei
g
ht
(
cm
)
156 158.82 ± 5.96 159.17 ± 8.43 155.16 ± 5.88 0.394**
BMI (kg/m
2
) 18.16 20.91 ± 1.77 25.77 ± 0.64 32.39 ± 4.57 <0.001*^
Random blood glucose
(
m
g
/dL
)
73 89.71 ± 13.38 88.67 ± 10.21 90.93 ± 12.93 0.622**
S
y
stolic blood
p
ressure 112 111
(
99-136
)
* 113
(
104-116
)
* 116
(
104-136
)
* 0.796*
Diastolic blood pressure 84 78.29 ± 6.97 76.67 ± 8.62 83.86 ± 9.56 0.247**
*median (minimum-maximum)
# kruskal-wallis
**Annova
^significant at p<0.001
Table 3 shows the differences in characteristics of
health indicators based on nutritional status based on
Indonesian standards. The median age for the
underweight and overweight group is 21 years old,
with an age range of 20 to 23 years. Similar to Asian
standards, body weight increased along with
increasing nutritional. The average height of the
overweight group (159.17±8.43 cm) is considered to
be higher than the nutritional status of other groups.
There is a difference in BMI for the normal group
(20.91 kg/m2) and overweight group (25.77 kg/m2)
based on the Indonesian standard and Asian standard,
in which the Indonesian standard is higher than the
Asian standard. There were no significant differences
in age, height, random blood glucose, or systolic
diastolic blood pressure between the underweight,
normal, overweight, and obese groups (p=0.568;
0.394; 0.622; 0.796; 0.247). There were significant
differences in body weight and BMI between the
underweight, normal, overweight, and obese
nutritional status groups (p<0.001).
Table 4 shows that there is no significant
correlation between body weight, height, and BMI
with random blood glucose levels and systolic blood
pressure. However, there is a significant positive
correlation between body weight and BMI with
diastolic blood pressure.
Table 4. Correlation Test Between Nutritional Status and
Blood Glucose Levels and Blood Pressure
*pearson
#spearman
^significant at p<0.05
The results of this research are in line with
research conducted by Utami and Ulumuddin et al,
which states that there is a relationship between body
mass index and systolic and diastolic blood pressure
with weak relationship strength. This shows that body
mass index is not the main factor that influences
blood pressure in type 2 diabetes mellitus patients
(Utami, 2019), (Ulumuddin and Yhuwono, 2018).
This is different from the results of research
conducted by Nurmalasari et al which shows that
there is no significant relationship between BMI and
fasting blood glucose levels in adults and the elderly
with a p-value> 0.05 (Efon Nurmalasari, Melvinawati
Kristina Naibaho and Ahmad Fitra Ritonga, 2021).
The results of research conducted by Rosiana et al on
differences in nutritional status and quality of food
intake in elderly people who took and did not follow
Prolanis showed that there were differences in
nutritional status between subjects who took and did
not take Prolanis (p=0.029), but there were no
differences in quality of food intake based on prolanis
participation (p=0.538) (Rosiana Dwi Astiti, Ani
Margawati, Ayu Rahadiyanti, 2019).
An increase in body weight and BMI will
contribute to blood pressure (Fadlilah, Sucipto and
Amestiasih, 2019). Increased body weight can affect
blood pressure through several mechanisms. Several
factors that can explain this relationship include an
increase in the amount of fat tissue, increased insulin
levels, increased heart rate, and genetic factors.
Increasing body weight can increase the amount of
fatty tissue in the body, which in turn can increase
blood volume and blood pressure. Additionally,
increased body weight is also associated with
increased insulin levels, which can cause sodium and
water retention, thereby increasing blood volume and
blood pressure. Apart from that, increasing body
weight can also cause an increase in heart rate and
genetic factors can also influence blood pressure
Nutritional Status, Blood Glucose, and Blood Pressure as Factors for Early Detection of Metabolic Risk in College Students: Observational
Research
53

(Efon Nurmalasari, Melvinawati Kristina Naibaho
and Ahmad Fitra Ritonga, 2021; Kalangie, Warouw
and Umboh, 2016). The indicators of nutritional
status that most influence blood pressure in male
adolescents are BMI and waist circumference, in
female adolescents it is neck circumference, and in
both genders, it is BMI (Novianingsih and Kartini,
2022). The results of the study showed that the
indicator of nutritional status that most influences
blood pressure in adolescent boys is BMI and in
adolescent girls is neck circumference.
4 CONCLUSIONS
There is a relationship between body weight and BMI
and diastolic blood pressure. It is hoped that the
research results will provide further insight into the
importance of early detection of metabolic risk in
students so that it can become a more effective
prevention and health intervention strategy in the
campus environment. By understanding the risk
factors involved, it is hoped that the results of this
research will provide better insight into the
development of health programs that can motivate
positive behavioral changes and improve metabolic
health among students. Through this effort, it is hoped
that positive changes in lifestyle and health can be
achieved, which in turn can have a positive impact on
students.
ACKNOWLEDGEMENTS
The researchers would like to thank the Research and
Community Service Institute (LPPM) of Universitas
Respati Yogyakarta, which has provided grant funds
through the internal research grant scheme for the
2023 fiscal year. The research contract agreement
letter is 01/Pen/Hibah.Int/PPPM/V/2023. The
researcher would also like to express his thanks to the
laboratory assistant for the assistance and permission
given as well as the enumerator friends who helped in
collecting research data
REFERENCES
Dieny, F. F., Widyastuti, N. and Fitranti, D. Y. 2015.
Sindrom metabolik pada remaja obes: prevalensi dan
hubungannya dengan kualitas diet, Jurnal Gizi Klinik
Indonesia, 12(1), p. 1. doi: 10.22146/ijcn.22830.
Djausal, A. N. 2015. Effect of central obesity as risk factor
of metabolic. 4, pp. 19–22.
Efon Nurmalasari, Melvinawati Kristina Naibaho and
Ahmad Fitra Ritonga. 2021. Hubungan Indeks Massa
Tubuh Dengan Kadar Glukosa Darah Puasa Pada Usia
Dewasa Dan Lansia, Binawan Student Journal, 3(1),
pp. 19–22. doi: 10.54771/bsj.v3i1.263.
Fadlilah, S., Sucipto, A. and Amestiasih, T. 2019. Age,
Gender, Smoking Behaviour, and BMI Related to
Cardiovascular Diseases Risks, Nursing Journals,
11(1), pp. 261–268. Available at:
https://doi.org/10.35912/jakman.v1i1.4.
Iqbal, M. and Puspaningtyas, D. E. 2018. Penilaian Status
Gizi ABCD. 1st edn. Edited by A. Sulia and T. Utami.
Jakarta: Salemba Medika.
Kalangie, V. M., Warouw, S. M. and Umboh, A. 2016.
Correlation between body weight and blood pressure of
Junior High School in Pineleng District, Jurnal e-
CliniC, 4(1), pp. 1–5.
Novianingsih, E. and Kartini, A. 2022. Hubungan Antara
Beberapa Indikator Status Gizi Dengan Tekanan Darah
Pada Remaja, Journal of Nutrition College, 1(1), pp.
169–175. doi: 10.14710/jnc.v1i1.691.
Rahma Listyandini, Fenti Dewi Pertiwi, D. P. R. 2020.
Asupan Makan, Stress, dan Aktivitas Fisik dengan
Sindrom Metabolik pada Pekerja Di Jakarta, Jurnal
Kajian dan Pengembangan Kesehatan Masyarakat,
01(01), pp. 19–32.
Rini, S. 2015. Sindrom Metabolik, Jurnal Majority, 4, pp.
88–93.
Rochmah, W. et al. 2014. Prevalensi Sindrom Metabolik
pada Pekerja Perusahaan The Prevalence of Metabolic
Syndrome among Company Workers’, Jurnal
Kesehatan Masyarakat Nasional, 9(2), pp. 113–120.
Rosiana Dwi Astiti, Ani Margawati, Ayu Rahadiyanti, A.
F. A. T. 2019. Perbedaan Status Gizi Dan Kualitas
Asupan Makanan Pada Lansia Yang Mengikuti Dan
Tidak Mengikuti Prolanis, Asian Journal of Chemistry,
8(3), pp. 70–73. doi:
https://doi.org/10.14710/jnc.v8i3.25808.
Sihombing, M. and Tjandrarini, H. 2015. Faktor Risiko
Sindrom Metabolik pada Orang Dewasa di Kota Bogor
(Risk Factors Metabolic Syndrome Among Adults in
Bogor), Penelitian Gizi dan Makanan, 38(1), pp. 21–
30.
Ulumuddin, I. and Yhuwono, Y. 2018. Hubungan indeks
massa tubuh dengan tekanan darah pada lansia di desa
pesucen, banyuwangi’, J. Kesehat. Masy. Indones,
13(1), p. 2018. Available at:
https://jurnal.unimus.ac.id/index.php/jkmi/article/dow
nload/3437/3259.
Utami, T. P. 2019. Hubungan antara Indeks Massa Tubuh
dan Tekanan Darah pada Pasien Diabetes Mellitus Tipe
2, Jurnal Archives Pharmacia, 1(1), pp. 19–22.
Available at:
https://digilib.esaunggul.ac.id/public/UEU-Journal-
19982-11_1226.pdf.
Wohangara, V. S. and Santoso, A. H. 2021. Pemetaan
Faktor-Faktor Risiko Sindoroma Metabolik Pada
Mahasiswa Fakultas Kedokteran Universitas
Tarumanagara Jakarta, Ebers Papyrus
, 27(1), pp. 91–
99.
ICOMESH 2023 - INTERNATIONAL CONFERENCE ON MEDICAL SCIENCE AND HEALTH
54
