
Apple Classification Based on HOG, KNN and SVM
Jiahui Huang
College of Information Science and Technology, Beijing University of Chemical Technology, Beijing, China
Keywords: Apple Classification, HOG, KNN, SVM.
Abstract: In the rapid development of deep learning, traditional machine learning in the field of classification has the
advantages of simplicity, ease of understanding, and strong interpretability. Apples, as an important global
agricultural product, bring a lot of economic value and have health benefits for human beings. However, they
are time-consuming and labour-intensive to sort manually. Therefore, realizing the intelligence of
classification process is helpful to improve economic efficiency. For the apple dataset with high similarity,
this research adopts two models, k-nearest neighbor (KNN) and support vector machine (SVM), and combines
four models with two features, Histogram of Oriented Gradients (HOG) feature extraction and original
features, to compare and research the models suitable for apple classification. It is found that HOG features
do not perform well on apple images of similar shape and size, but both SVM and KNN using raw features
show good performance on both training and test sets. The proposed method is simple to implement, has high
accuracy and is suitable for further extension of application to other fruit domains.
1 INTRODUCTION
Apple, as one of the most important agricultural
products all over the world, brings a lot of economic
benefits. Selection and sorting after harvesting are an
important part of the commercialization process.
Sorting apples manually is time-consuming and
labor-intensive for different varieties of apples. Some
different kinds of apples are very close to each other
in terms of shape, color and size. The shortcoming of
detection will finally result in loss of efficiency.
Automate and de-manipulate the apple classification
process by extracting features of different apples can
effectively increase the speed, save money and time
costs. Trying to research a model with high accuracy
in apple classification task requires a combination of
both feature extraction method and classifiers.
Finding the best of data features and classifier is of
great importance.
Currently, many apple classification methods have
been proposed. In Bhargava and Bansal’s work in
2021, they segmented the apple images by the grab-
cut method and fuzzy c-means clustering, extracted
multiple features, and used principal component
analysis (PCA) to select them. The classification was
done by applying KNN, LR, SRC, and SVM
classifiers. The cross-validation technique with
distinct values of k was used to validate the
performance of the system. The method obtained
more than 95% accuracy on the SVM model when k
equals to 10 (Bhargava and Bansal 2021). A. K. Bhatt
and D. Pant together trained a back-propagation
neural network to classify apples, using surface apple
quality parameters as the independent variables and
apple quality as the dependent variable (Bhatt and
Pant 2015). The experimental results obtained are in
good agreement with the true values and have shorter
computation time and higher accuracy (Bhatt and
Pant 2015). Misigo. R investigate the applicability
and performance of Naive Bayes algorithm in
classification of apple fruit varieties and compare the
performance of Park Bayes technique with principal
components, fuzzy logic, MLP neural performance
(Misigo 2016). These methods either use relatively
expensive instruments, such as X-ray scanners, near-
infrared spectrometers, and industrial cameras, or are
complex to operate, require the design of specialized
hardware modules, and have cumbersome procedures
that are not applicable to the promotion of their use in
the market.
Using a combination of HOG feature extraction
method and machine learning models has been widely
researched by scholars before. Xin Guo et al.
addressed the problem of poor recognition ability of
traditional algorithms for small fruit targets in natural
environments by classifying apples with improved
Huang, J.
Apple Classification Based on HOG, KNN and SVM.
DOI: 10.5220/0012814800003885
Paper published under CC license (CC BY-NC-ND 4.0)
In Proceedings of the 1st International Conference on Data Analysis and Machine Learning (DAML 2023), pages 451-456
ISBN: 978-989-758-705-4
Proceedings Copyright © 2024 by SCITEPRESS – Science and Technology Publications, Lda.
451
HOG and SVM with the Focus plus CSP cascade
module added for deep feature extraction (Guo et al
2022). The combination of HOG and KNN is also
widely used. FAIA Putra et al. proposed a vision-
based vehicle detection system with HOG feature
detection and KNN classifier (Putra et al 2020). Hivi
et al. applied PCA downscaled HOG feature and use
SVM, KNN and Multilayer Perceptron Neural
Network (MLPNN) three different classifiers to
recognize face expression (Dino and Abdulrazzaq
2019).
According to Liu’s work in 2019, he concluded
through experiments that machine learning has the
advantage of simplicity and efficiency in image
classification and recognition compared to neural
networks in classifying small samples of data. Based
on his work and related research by other scholars,
this research further explores the performance of
traditional machine learning on apple classification.
2 METHODS
This research consists of three main parts. The first
part is to preprocess the fruit dataset by selecting all
the apple image classes to form the apple dataset. The
second part is to extract HOG features and original
features for each image for subsequent comparison.
The last part is to classify the images based on the
features using two classification tools KNN and SVM.
2.1 Data Visualization
The research is based on the Fruits-360 dataset. Up to
now, there are 61934 images of 90 kinds of fruits with
hundreds of shooting angles in the set, each image is
formatted as 100100 pixels. The advantage of this
dataset is that its images have the object without the
noisy background, which may avoid reduction of the
classification accuracy when changing the
background environment of the images.
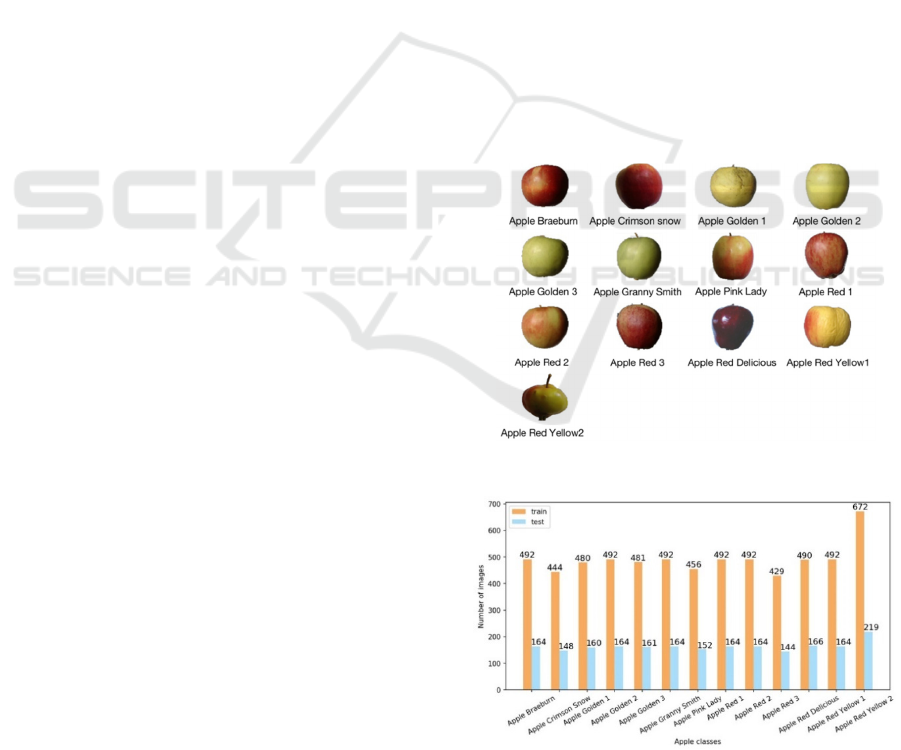
The research selected all the apple varieties to form
the apple dataset, and all the apple classes in it are
shown in Fig. 1.
After selecting, the apple dataset has a total of 8538
images, of which 6404 are training images and 2134
are test images. The ratio of training set to test set is
3:1, The number of training and test sets for each
apple species is shown in Fig. 2
As shown in Fig. 2, some apple classes are
duplicated. For example, Apple Red 1 and Apple Red
2 should be in the same class. By merging all identical
classes, the final dataset is shown in Fig. 3.
2.2 HOG Feature Extraction
The HOG feature detection algorithm, an image
descriptor that addresses human target detection, was
first proposed at CVPR-2005 by French researcher
Dalal et al. The feature extraction method is widely
used in computer vision and image processing, mainly
for detecting and recognizing objects in an image by
extracting the feature descriptors of the image. HOG
is aiming to describe an image with a locally oriented
gradient histogram that represent occurrences of
specific gradient direction in local parts of the image.
The steps of the extraction algorithm for realizing
HOG features are in Fig. 4.
2.3 Machine Learning Classifiers
Apple classification task is viewed as a part of
Supervised learning. Due to multiple apple labels,
some models like KNN, SVM and NB are the three
most used methods for multiple classification
(Binkhonain and Zhao 2019). In this research, the
KNN and SVM models are used to classify apple
classes with features extracted and not extracted with
HOG respectively.
Figure 1: All the apple classes (Photo credit: Original).
Figure 2: Selected apple dataset (Photo credit: Original).
DAML 2023 - International Conference on Data Analysis and Machine Learning
452
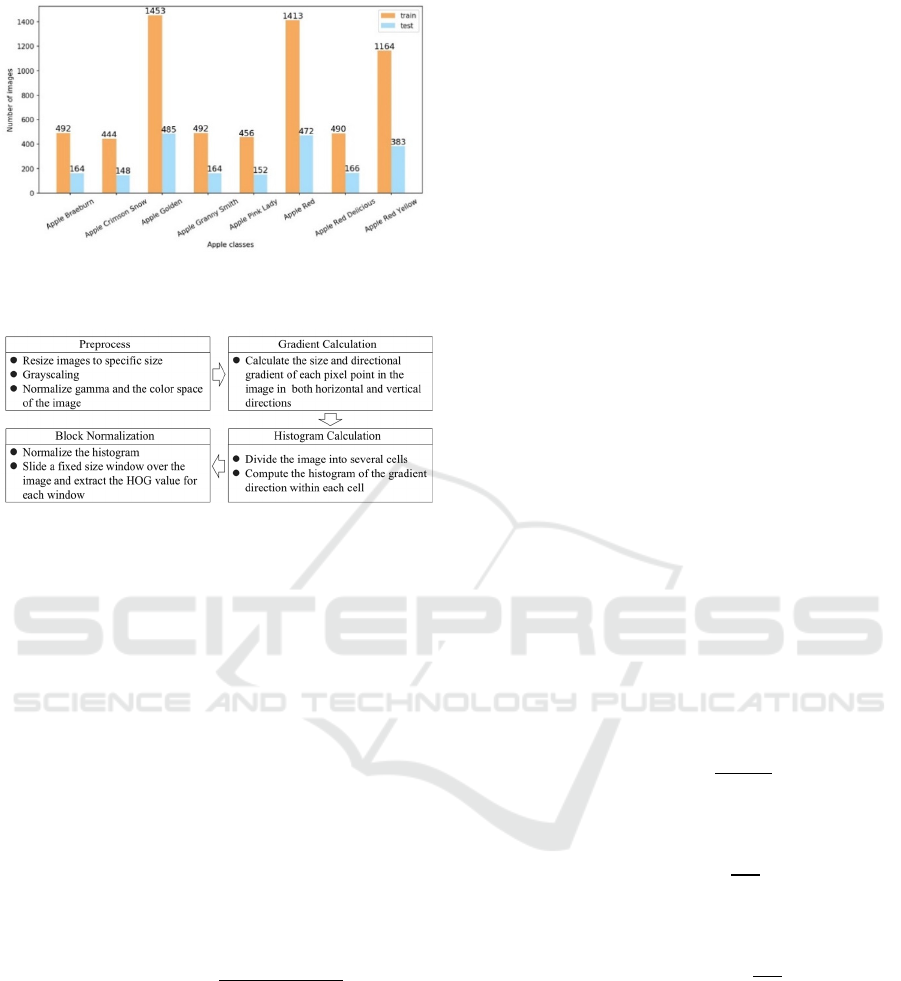
Figure 3: Classes of apples after merging (Photo credit:
Original).
Figure 4: HOG feature extraction process (Photo credit:
Original).
2.3.1 K-Nearest Neighbor
The work uses KNN to classify different kind of
apples. Unlike other complex deep learning models,
KNN is an easy understanding and not time-
consuming algorithm. For classification problems, the
main idea of the KNN algorithm is to decide the class
of a sample point based on the class of the k nearest
neighbors around that sample point. For the HOG
feature vector of the test image, calculate the distance
between it and the HOG feature vector of each sample
in the training set. This can be done using different
distance metrics, commonly the Euclidean distance,
seen in the Eq. (1), where d is the Euclidean distance,
x stands for test image, y stand for training image, and
n is the total number of neighbors.
𝑑
∑
𝑥
𝑦
(1)
The value of k determines how many neighbors a
test point decides its own category based on the
condition of using the Euclidean distance. Generally,
different values of k will lead to greatly distinct
results. Smaller values of k result in higher model
complexity that is prone to overfitting. Predictions of
test points are very sensitive to neighboring instance
points. Larger values of k will make the model too
generalized to accurately predict the testing data
points, which is known as underfitting. To find the
best k value, the common method is to use K-fold
cross validation. The basic idea is dividing the dataset
into k groups with same size, keeping one-fold for
testing and other k-1 folds for training. The process
needs k times and each time different fold are used for
validation.
2.3.2 Support Vector Machine
SVM is a popular machine method due to its high
learning qualities and well results. Built by Vapink’s
study in 2013, the model seeks the optimal balance
between learning capacity and complexity based on
small and medium-sized dataset, which gives it a
strong ability to generalize. The main idea is to
discover a hyperplane to correctly classify data points
from different categories (Çakir et al 2023)
Erro! A origem
da referência não foi encontrada.
. In high-dimensional space, the
optimal function expression of a hyperplane is in Eq.
(2), where w is the weighted vector, x is the input
feature vector, b is the distance between the data point
and the hyperplane.
𝑤
𝑥𝑏0 (2)
The w and b need to fulfil the following
inequalities, seen in Eq. (3):
𝑤𝑥
𝑏1 𝑖𝑓 𝑦
1
𝑤𝑥
𝑏1 𝑖𝑓 𝑦
1
(3)
Then, the distance from any point (x1, x2) in space
to the target hyperplane can be expressed according to
Eq. (4):
𝑟
|
|
||||
(4)
If the function interval r is made equal to 1, then
there is Eq. (5):
𝑁
||||
(5)
Therefore, the formula for taking the interval
maximization is shown in Eq. (6):
𝑓 𝑚𝑎𝑥
||||
(6)
2.4 Evaluation Criteria
To assess the performance of the model, four
evaluation metrics are used in this research: Accuracy,
Recall, Precision and F1-score. The assessment
metrics are determined by the True Positive (TP), True
Negative (TN), False Positive (FP), and False
Negative (FN) values, as shown in Table 1.
Apple Classification Based on HOG, KNN and SVM
453
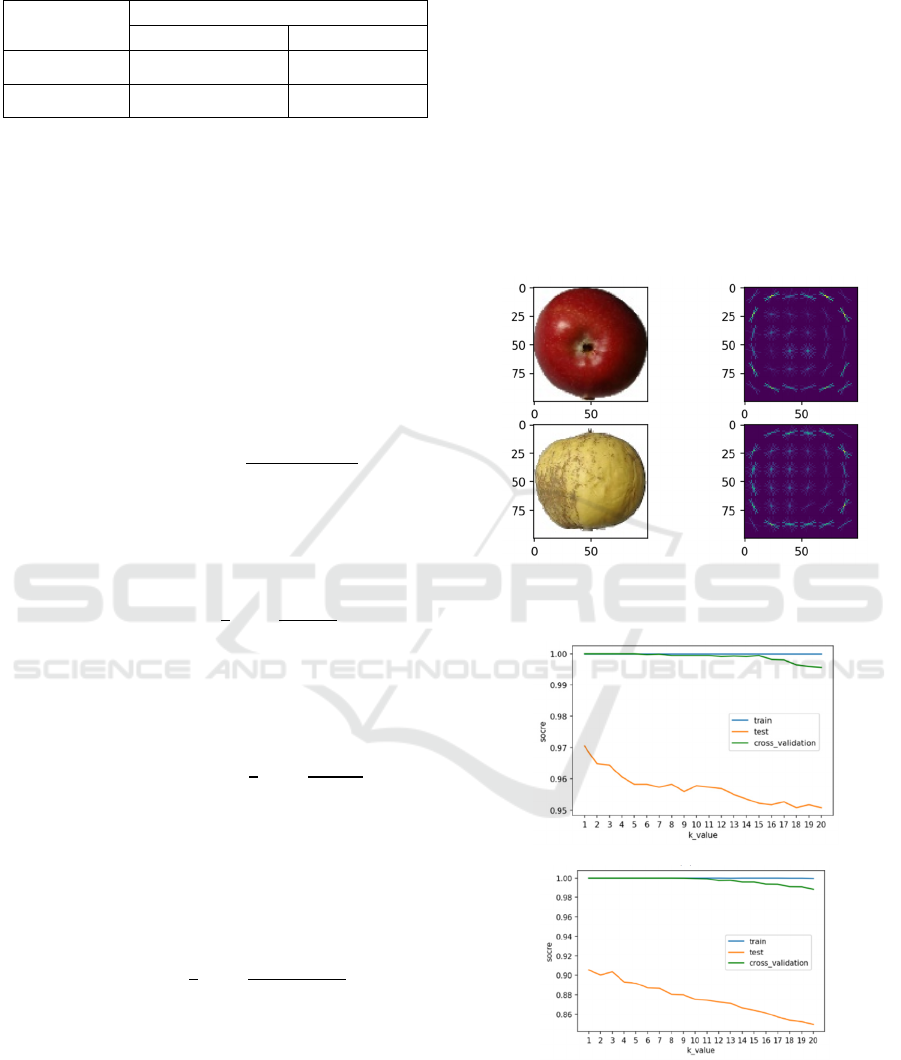
Table 1: Confusion Matrix of classification.
Predicted
Actual
positive negative
positive TP FP
negative FN TN
Since this research is a multi-category problem,
Macro Average rule is used for calculating Recall,
Precision and F1-score. By using the confusion
matrix, they are calculated separately for each
category and then averaged (Zheng 2022).
2.4.1 Accuracy
The proportion of correctly categorized samples to
total samples. It is calculated by multiplying the
accuracy of each category by the proportion of that
category in the total sample and then summing. The
formular is given in Eq. (7):
𝐴𝑐𝑐𝑢𝑟𝑎𝑐𝑦
∑
∑
(7)
2.4.2 Recall
The proportion of correct predictions that are positive
to all that are actually positive, as shown in Eq. (8):
𝑅𝑒𝑐𝑎𝑙𝑙
∑
(8)
2.4.3 Precision
The proportion of all predictions that are correctly
predicted to be positive, as shown in Eq. (9):
𝑃𝑟𝑒𝑐𝑖𝑠𝑖𝑜𝑛
∑
(9)
2.4.4 F1-Score
As defined in Eq. (10), the F1 score can be thought of
as a kind of reconciled average of model precision
and recall, which has a maximum value of 1 and a
minimum value of 0.
𝐹1
∑
(10)
3 RESULT AND DISCUSSION
3.1 HOG Feature Extraction Result
In accordance with the HOG feature extraction
process in Fig. 4, HOG features are extracted from all
the images, and Fig. 5 is an example of a comparison
image before and after extraction.
3.2 Predict Result
In this research of KNN classification model, the
range of k values is set from 1 to 20, and the score of
each k value with raw features and HOG features are
shown in Fig. 6. The two figures illustrate that the
model runs best when k equals to 1 for both raw
features and HOG features. Considering both model
accuracy and overfitting, the k value of 3 is chosen to
build the KNN model.
Figure 5: The comparisions of images before and after
HOG feature extraction (Photo credit: Original).
(a)
(b)
Figure 6: The score of KNN for different k. (a) KNN with
raw features (b) KNN with HOG features (Photo credit:
Original).
DAML 2023 - International Conference on Data Analysis and Machine Learning
454
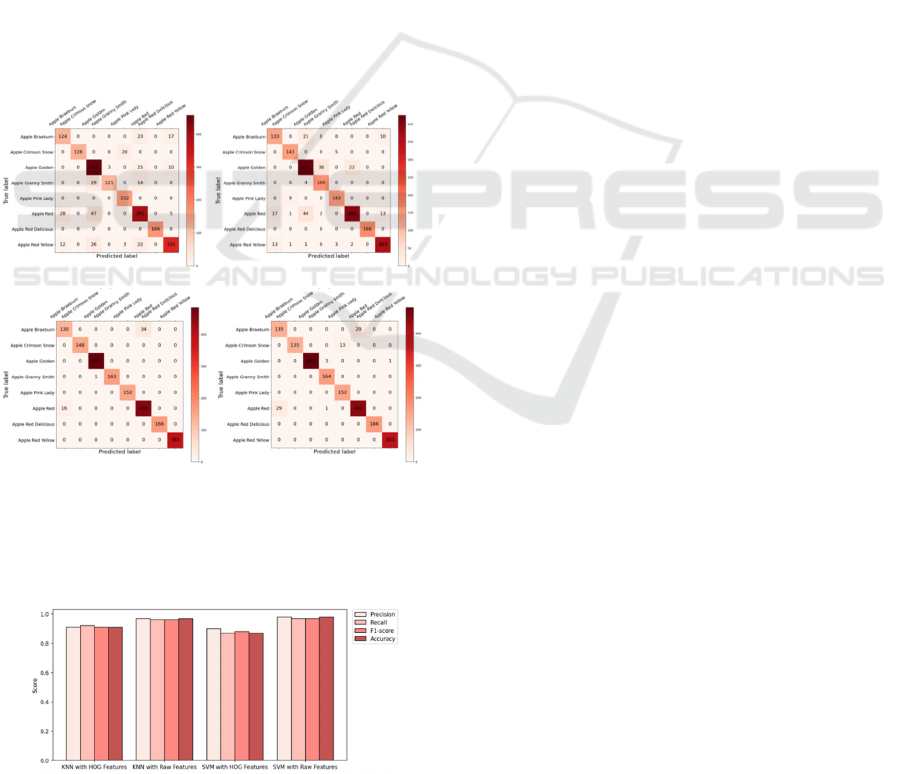
3.3 Evaluation
In order to evaluate the performance of each
classification model, the research compares the
predicted results with the actual results of the testing
set. The confusion matrix is shown as Fig. 7, showing
that KNN and SVM both perform well on predicting
the test set when trained with raw features compared
to using HOG features. It can be seen that for all
model, Apple Red Delicious are correctly classified,
Apple Braeburn has the worst classification result
with relatively high probability of being classified as
Apple Red and Apple Red Yellow. According to Fig.
7, Apple Braeburn is the biggest challenge for these
models with the lowest F1-score, precision and recall
, even for the least misclassified SVM model with
raw features. The evaluation scores of each model are
shown in Fig. 8. This clearly shows that SVM with
raw features performs best on the apple classification
task with the highest Precision, Recall, F1-score and
Accuracy, KNN with raw features second. Both KNN
and SVM with HOG features don’t perform that well.
(a) (b)
(c) (d)
Figure 7: The confusion matrix of model. (a) SVM with
HOG features, (b) SVM with raw features, (c) KNN with
HOG features, (d) KNN with raw features. (Photo credit:
Original).
Figure 8: Evaluation score of each model (Photo credit:
Original).
In this research, a total of four models are
constructed by combining HOG features and original
features, KNN and SVM. Each model is trained in a
short period of time and achieved more than 90%
accuracy. It can be seen from the result that the value
of k has a significant effect on the predict outcome.
According to the cross-validation result of each k and
the effect of overfitting, k equals to 3 is chosen to train
the KNN.
Since apples are similar in shape and size between
some of the different species, the model using HOG
features is not as well as the model that uses the raw
features directly. SVM with raw features performs
best on the apple classification task, which exceeds 97
per cent in all evaluation indicators.
This research uses separate KNN and SVM, in
future investigation, further improvement in
classification accuracy can be attempted by using a
hybrid of KNN and SVM. The model was proposed
by Zhang et al., which has reasonable computational
complexity in training and exceptional results in
practice (Zhang et al 2006)
Erro! A origem da referência não foi
encontrada.
. Due to the high similarity of apple images
and poor performance of HOG features, another idea
to improve the model is using wavelet transform to
extract image texture features. It is based on research
by Jiang et al. specifically for the problem of
recognizing and classifying high similarity images in
a specific domain (Jiang et al 2018).0
It should be noted that this research is based on a
small sample dataset, with many images of an apple
species coming from a rotational shot of a single
apple. Not enough training samples may lead to
overfitting of the model. In addition, the classification
of apple species in this research is not so rigorous, and
there may be cases where different classes are treated
as the same class or the same class is treated as
different classes.
4
CONCLUSION
In current research, SVM with raw features achieved
best results in both training and testing process.
Surprisingly, the KNN model also has a good
performance on this task. Through the research, this
study found that HOG features work less well on high
similarity datasets like Apple image set than using raw
features. This is probably because the individual apple
types are similar in shape and size, differing mainly in
color. This finding could help other researchers to
avoid the use of HOG when classifying images with a
high degree of similarity in shape and size.
Furthermore, the success of SVM with raw features in
Apple Classification Based on HOG, KNN and SVM
455

apple classification provides value for the application
of traditional machine learning in agriculture.
REFERENCES
A. Bhargava, and A. Bansal, “Classification and grading of
multiple varieties of apple fruit,” Food. Anal. Method,
vol. 14, pp. 1359-1368, 2021.
A. K. Bhatt, and D. Pant, “Automatic apple grading model
development based on back propagation neural network
and machine vision, and its performance
evaluation,” Ai & Society, vol. 30, no. 1, pp. 45-56,
2015.
R. Misigo, “ Classification of selected apple fruit varieties
using Naive Bayes,” Univ. Nairobi, vol. 3, no. 1, pp. 56,
2016.
X. Guo, Q. Hao and F. Yang, “Apple multi-target detection
method based on improved HOG and SVM,” Foreign
Electronic Measurement Technology, vol. 11, pp. 154-
159, 2022.
F. A. I. A. Putra, F. Utaminingrum, and W. F. Mahmudy,
“HOG feature extraction and KNN classification for
detecting vehicle in the highway,” IJCCS (Indonesian
Journal of Computing and Cybernetics Systems), vol.
14, no. 3, pp. 231-242, 2020.
H. I. Dino, & M. B. Abdulrazzaq, “Facial expression
classification based on SVM, KNN and MLP
classifiers,” In 2019 International Conference on
Advanced Science and Engineering (ICOASE), April
2019, pp. 70-75
L. H. Ci, “Comparative analysis of image classification
algorithms based on traditional machine learning and
deep learning,” Computer and Information Technology,
vol. 05, pp. 12-15, 2019.
N. Dalal and B. Triggs, “Histograms of oriented gradients
for human detection,” in Proc. IEEE Conf. Comput.
Vis. Pattern Recognit., vol. 1, 2005, pp. 886–893.
M. Binkhonain and L. Zhao, “A review of machine learning
algorithms for identification and classification of non-
functional requirements,” Expert Syst. With Appl.: X,
vol. 1, 2019, Art. no. 100001.
V. Vapnik, The Nature of Statistical Learning Theory. New
York, NY, USA: Springer-Verlag, 2013.
M. Çakir, M. Yilmaz, M. A. Oral, H. O. Kazanci, and O.
Oral, “Accuracy assessment of RFerns, NB, SVM, and
kNN machine learning classifiers in
aquaculture,” Journal of King Saud University-Science,
vol. 35, no. 5, Aug. 2023.
X. Y. Zheng, “Research on assisted diagnosis model for
Alzheimer's disease based on multi-classifier fusion,”
PhD dissertation, Harbin Institute of Technology,
Harbin, Heilongjiang, China, 2022.
H. Zhang, A. Berg, M. Maire, and J. Malik, “SVM-KNN:
Discriminative nearest neighbor classification for
visual category recognition,” Proc. IEEE Conf.
Computer Vision and Pattern Recognition, 2006.
W. C. Jiang, H. B. Liu, Y. J. Yang, J. F. Chen, and A. B.
Sun, “A high similarity image recognition and
classification algorithm combining wavelet transform
and convolutional neural network,” Comp. Eng. Sci,
vol. 09, pp. 1646-1652, 2018.
DAML 2023 - International Conference on Data Analysis and Machine Learning
456
