
Weather Forecast Analysis Based on ARIMA Model: A Case Study of
Stockholm
Haoyu Li
Leicester International Institute, Dalian University of Technology, Panjin, China
Keywords: ARIMA Model, Time Series, Average Temperature, Forecast, Residual Analysis.
Abstract: This paper presents a comprehensive investigation into the development of a temperature prediction model
using the city of Stockholm as a case study. Time series modeling techniques are used in this research to
forecast future monthly average temperatures. The dataset used in this study covers a wide range, from
January 1980 to December 2020, offering ample historical data for analysis. As the primary forecasting
approach, the researchers have selected the Autoregressive Integrated Moving Average (ARIMA) model. To
identify the optimal orders for the ARIMA model, an analysis is performed using Autocorrelation Function
(ACF) and Partial Autocorrelation Function (PACF) plots, allowing for accurate determination of the suitable
parameters. Furthermore, a comprehensive residual analysis is conducted to verify that the residuals
demonstrate the properties of white noise, providing further assurance about the model's reliability. The
obtained results demonstrate that the proposed ARIMA model achieves high prediction accuracy in estimating
future monthly average temperatures. Overall, this research contributes to the field of climate prediction by
showcasing an effective methodology for temperature forecasting at a local level. By using Stockholm as an
example, key patterns and trends specific to the region are identified, highlighting the applicability of the
developed model to similar geographical locations.
1 INTRODUCTION
With the ongoing increase in global mean temperature
and the escalating impacts of climate change, there is
an increasing need for monitoring at local scales to
assess present and future climate variations (Qasmi
and Ribes 2022). Accurate predictions of future
temperature patterns are crucial for various sectors,
including agriculture, energy, and public health. In
recent times, the focus on time series forecasting
methods has surged as they offer valuable insights by
effectively capturing temporal relationships and
producing dependable projections. One such
technique, the Auto Regressive Integrated Moving
Average (ARIMA) model is a prominent method
extensively employed for time series analysis and
forecasting due to its broad applicability and accurate
prediction capabilities. In the past few decades,
numerous scholars have conducted in-depth research
on temperature variations. They have employed the
ARIMA model as a basis for temperature prediction
and proposed various enhanced methods and models.
Dimri utilized a seasonal ARIMA model to
forecast future trends by detrending the data and
eliminating seasonality. The study focused on
predicting climate variables for the next 20 years
(2001-2020). The research findings indicated that
SARIMA exhibited favorable agreement between
predicted and observed trends in both precipitation
and temperature data. Dimri concluded that time series
models like ARIMA possess advantages in capturing
trends, seasonality, and random components in
weather data (Dimri et al 2020). Wu et al. employed
the ARIMA model to forecast and analyze global
surface temperatures, suggesting that the ARIMA
model effectively handles characteristics of
temperature time series data such as seasonality,
trends, and periodicity using a minimal number of
parameters (Wu et al 2023). In Peng's study, focusing
on northwestern Guangxi as an example, drought
predictions were conducted using the ARIMA model
in conjunction with the Vegetation Supply Water
Index (VSWI). The research evaluated the long-term
performance of the ARIMA model for temperature
and demonstrated its accuracy and spatio-temporal
continuity (Peng et al 2022). Amjad et al. modeled the
monthly average temperature in Karachi, Pakistan.
They utilized ARIMA modeling techniques combined
with the Box-Jenkins method to predict monthly
average temperatures in the study area. This model has
been applied to explore precise impacts of time series
164
Li, H.
Weather Forecast Analysis Based on ARIMA Model: A Case Study of Stockholm.
DOI: 10.5220/0012810300003885
Paper published under CC license (CC BY-NC-ND 4.0)
In Proceedings of the 1st International Conference on Data Analysis and Machine Learning (DAML 2023), pages 164-170
ISBN: 978-989-758-705-4
Proceedings Copyright © 2024 by SCITEPRESS – Science and Technology Publications, Lda.

variables on regional warming scenarios (Amjad et al
2022). In Liu's study on the prediction and analysis of
winter daily minimum temperatures, the accuracy of
ARIMA-LM and ARIMA-D methods was evaluated,
with ARIMA-LM demonstrating a short-term
prediction accuracy of up to 80% (Liu and Ge 2022).
Wu investigated the monthly average temperature
in Z.Z city. By employing the twelve-step differencing
method to remove seasonal trends, an ARIMA model
was constructed and fitted to the data (Wu 2018). In
Kesavan's research, remote sensing (RS) techniques
have been utilized for estimating and predicting Land
Surface Temperature (LST) as well as identifying
Urban Heat Island (UHI) in one of the rapidly
developing cities in Tamil Nadu, India. The ARIMA
model was employed for this purpose (Kesavan et al
2021).
Moreover, numerous investigations have advanced
the techniques and theories of temperature forecasting
by incorporating neural network-based algorithms,
leading to enhanced precision in temperature
prediction. Hippert introduced a hybrid forecasting
system that integrates ARIMA models with multilayer
neural networks, effectively capturing both temporal
and fluctuation patterns in temperature prediction
(Hippert et al 2000). Similarly, Ahmad introduced an
alternative approach for temperature prediction by
combining wavelet analysis with the ARIMA model
and Artificial Neural Networks (ANN), providing a
comprehensive study of monthly maximum and
minimum temperature data (Nury et al 2017). Chen et
al. integrated the ARIMA model with the
Backpropagation (BP) neural network model to
forecast sea surface temperatures. Experimental results
indicated that the ARIMA-GABP model exhibited
smaller Mean Absolute Error (MAE) and Root Mean
Square Error (RMSE) values (Chen et al 2022).
In conclusion, global warming poses threats not
only to natural ecosystems but also to human survival.
Frequent and severe weather-related disasters
underscore the urgency of accurately forecasting
temperatures to provide data support for mitigation
and adaptation efforts.
This paper focuses on utilizing the ARIMA model
to predict future temperature trends, with Stockholm
city as a representative case study. Through an
extensive review of the literature, this paper has
identified the strengths and limitations of existing
temperature prediction methods and highlighted the
potential of the ARIMA model in this field.
In the upcoming sections of this paper, we will
delve into the research methodology, covering data
collection and preprocessing, the formulation of the
ARIMA model, and an in-depth assessment of its
predictive performance. This paper will analyze
experimental results, discuss the implications of the
findings, and provide recommendations for future
research.
Overall, by combining robust time series modeling
with case-specific analyses, this study aims to deepen
the understanding of future temperature trends in
Stockholm city, thereby contributing to climate change
prediction and its application in decision-making.
2 METHODOLOGY
2.1 Data Source and Description
The data for this paper comes from the official website
of Stockholm University (Bolin 2023). The data is
used because the website is the official information
release platform of the school, with credibility and
authority. This means that the data obtained comes
from reliable sources and has been reviewed and
verified by the relevant authorities.
2.2 Index Selection and Presentation
To ensure that the data satisfies the basic assumptions
of the ARIMA model, such as stationarity and
normality, several tests are conducted. These tests
involve checking for various aspects of a time series.
First, the Augmented Dickey-Fuller (ADF) tests are
used to determine if the time series exhibits
stationarity over time. Next, the Ljung-Box tests
examine the independence and identically distributed
nature of the residuals. Once stationarity and
independence are confirmed, the ACF and PACF plots
are analyzed to select the appropriate ARIMA model
order. The significant points on these two plots
provide insights into the optimal ARIMA model order
by guiding the selection of the appropriate AR
(autoregressive) and MA (moving average) orders.
These tests and analysis ensure that the chosen
ARIMA model captures the underlying patterns
effectively and satisfies the necessary assumptions,
allowing for accurate temperature forecasts in
Stockholm.
2.3 Method Introduction
This paper utilizes a methodology for temperature
forecasting in Stockholm using the ARIMA model,
with a specific emphasis on incorporating seasonality
through the Seasonal ARIMA (SARIMA) model.
The ARIMA model, widely utilized in time series
analysis, incorporates the autoregressive (AR),
integrated (I), and moving average (MA) components
to effectively capture various characteristics of the
data. The autoregressive component (AR) models the
Weather Forecast Analysis Based on ARIMA Model: A Case Study of Stockholm
165
dependency of current observations on past
observations, similar to a linear regression framework.
The integrated component (I) utilizes differencing to
make the time series stationary, allowing for the
detection of long-term trends. Lastly, the moving
average component (MA) captures the relationship
between current observations and past forecast errors.
In cases where the temperature data exhibits
significant seasonal patterns, the SARIMA model is
introduced. This model extends the ARIMA
framework by incorporating additional seasonal
terms. It considers factors such as lagged seasonal
values, which allow for more accurate predictions by
addressing the periodicity and cyclical behavior
within the data.
Following a comprehensive data collection and
preparation process, the ARIMA or SARIMA model
is fitted to the historical temperature data using
appropriate parameter estimation techniques, such as
maximum likelihood estimation. Diagnostic tests are
implemented to verify the accuracy and sufficiency of
the selected model, ensuring its validity in
representing the data.
By applying the ARIMA model with the inclusion
of seasonality through the SARIMA extension, this
study provides an effective framework for temperature
forecasting in Stockholm. The methodology enables
researchers, policymakers, and practitioners to gain
valuable insights into future temperature trends,
fostering informed decision-making in various sectors
impacted by weather conditions.
3 RESULTS AND DISCUSSION
3.1 Data Visual Analysis
The present study conducted temperature forecasting
for Stockholm using the ARIMA model and provided
a detailed analysis and discussion of the predicted
results. The obtained results and corresponding
discussions are presented below.
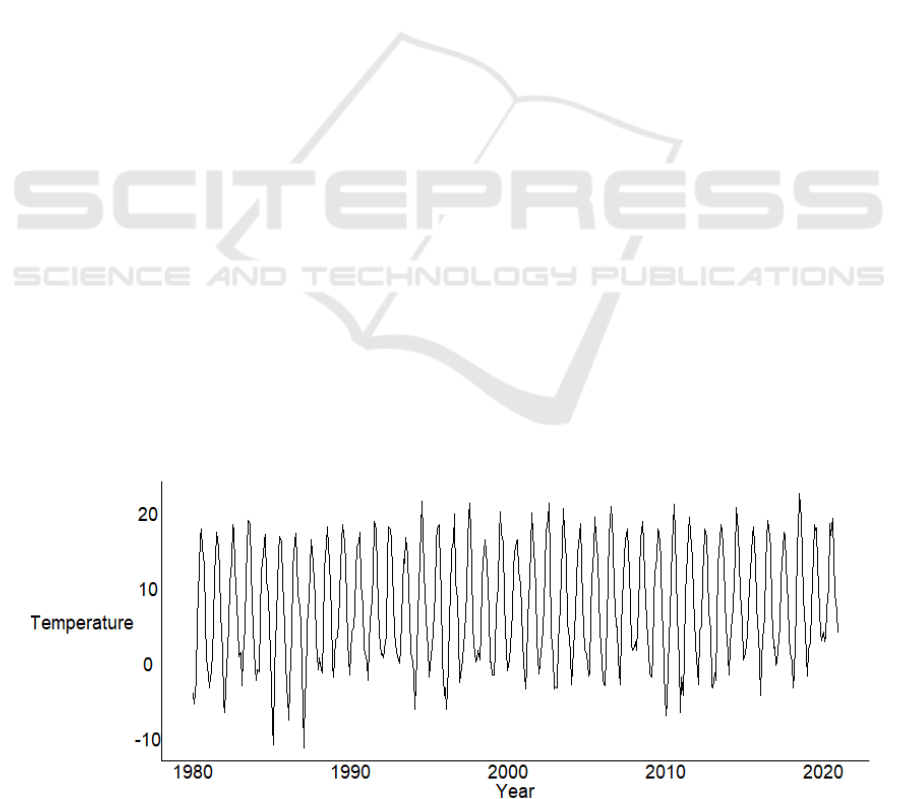
Firstly, the temperature data for Stockholm was
subjected to visual analysis in this study. The time
series plot displayed the overall trend of temperature
variation over time in Stockholm. Upon observing the
time series plot, it can be inferred that the temperature
exhibits some form of seasonal periodicity. Seasonal
time series plots further illustrated the average
variation pattern of temperature within different
seasons. Figure 1 depicts a time series plot describing
the monthly average temperature in Stockholm from
1980 to 2020. The graph illustrates the presence of
both trends and seasonality in this time series.
To get a better idea of seasonality, Figure 2 shows
the average variation in temperature in Stockholm
over the different months of the year. To ensure that
the data presented in the picture remains clear, it is
retained at an interval of five years.
3.2 Stationarity Analysis
Next, the study examined the stationarity of the
temperature data. The conducted test resulted in a
Dickey-Fuller statistic of -14.208, accompanied by a
lag order of 7 and a p-value of 0.01. Given that the p-
value is below the significance level of 0.05, the null
hypothesis is rejected, indicating that the temperature
data is stationary.
Moreover, the BOX-Ljung test results indicate a
test statistic X-squared of 2470.5 with 12 degrees of
freedom. The extremely low p-value (p < 2.2e-16)
presents robust evidence against the null hypothesis of
independence in the data.
3.3 ARIMA Model Parameter
Selection
To estimate the ARIMA model's parameters, ACF and
Figure 1: Monthly mean temperature in Stockholm, 1980-2020 (Picture credit: Original).
DAML 2023 - International Conference on Data Analysis and Machine Learning
166
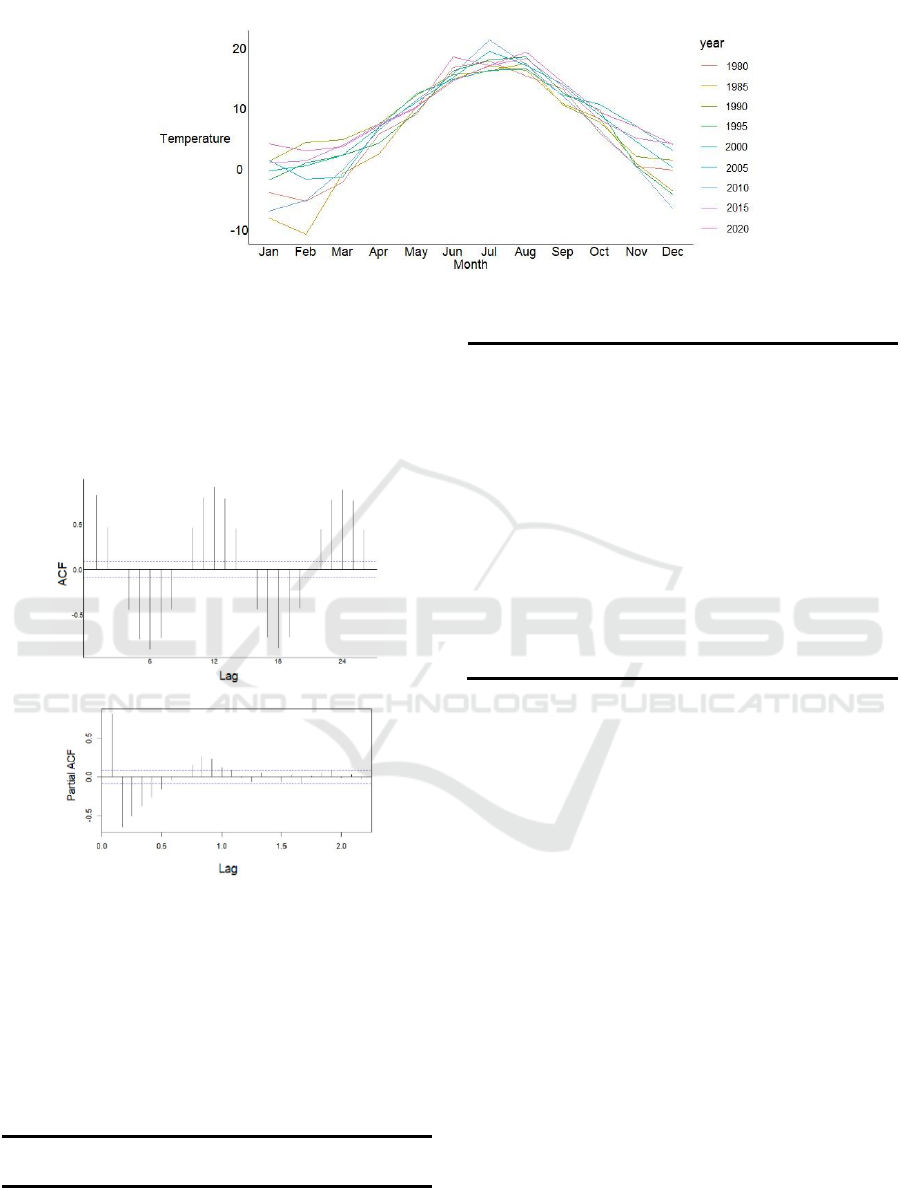
Figure 2: Seasonal chart of monthly mean temperature in Stockholm, 1980-2020 (Picture credit: Original).
PACF analyses were further performed. Figure 3 shows
the ACF diagram and the PACF diagram. Considering
the patterns observed in the ACF and PACF plots, (1,
0, 0) is identified as the appropriate parameter
configuration for the ARIMA model (p, d, q).
Figure 3: ACF and PACF plot of monthly mean temperature
(Picture credit: Original).
In R Studio, the auto.arima() function is called to
process the temperature data of Stockholm, and the
resulting model is ARIMA(1,0,0)(2,1,0) (Bolin 2023),
which proves the previous analysis. The resulting
ARIMA model parameters are shown in Table 1.
Table 1: ARIMA (1,0,0) (2,1,0) (Bolin 2023) with drift.
Point
Forecast
Lo 80
Hi 80
Lo 95
Hi 95
Jan
2021
1.735
-1.054
4.524
-2.530
6.000
Feb
2021
0.945
-1.981
3.872
-3.530
5.421
Mar
2021
1.831
-1.109
4.770
-2.665
6.327
Apr
2021
7.377
4.436
10.318
2.879
11.875
May
2021
12.485
9.544
15.426
7.987
16.983
Jun
2021
18.235
15.294
21.176
13.737
22.733
Jul 2021
19.183
16.242
22.124
14.685
23.681
Aug
2021
19.0313
16.090
21.973
14.533
23.530
Sep
2021
14.029
11.088
16.971
9.531
18.528
Oct
2021
8.573
5.632
11.514
4.075
13.071
Nov
2021
5.323
2.382
8.264
0.825
9.821
Dec
2021
2.785
-0.156
5.726
-1.714
7.283
3.4 Result and Forecasting
Based on the ARIMA (1,0,0) (2,1,0) (Bolin 2023)
model, the predicted temperature values for Stockholm
over the next 12 months are presented in Fig.4. This
time series plot compares the actual temperature values
with the predicted ones.
Additionally, Table 2 provides the confidence
intervals for each month's predicted temperature,
ensuring a comprehensive understanding of the
uncertainty associated with the predictions. Each
confidence interval is reported with three decimal
places.
The forecasted results demonstrate a strong
agreement between the predicted and actual
temperature values. The predicted temperature
fluctuations over time align closely with the observed
trend, providing confidence in the accuracy of the
model.
Overall, the ARIMA model (1,0,0) (2,1,0) (Bolin
2023) successfully captures and predicts the
temperature variations in Stockholm. The inclusion of
confidence intervals enhances the interpretation of the
predicted values by considering the range of possible
outcomes.
Weather Forecast Analysis Based on ARIMA Model: A Case Study of Stockholm
167
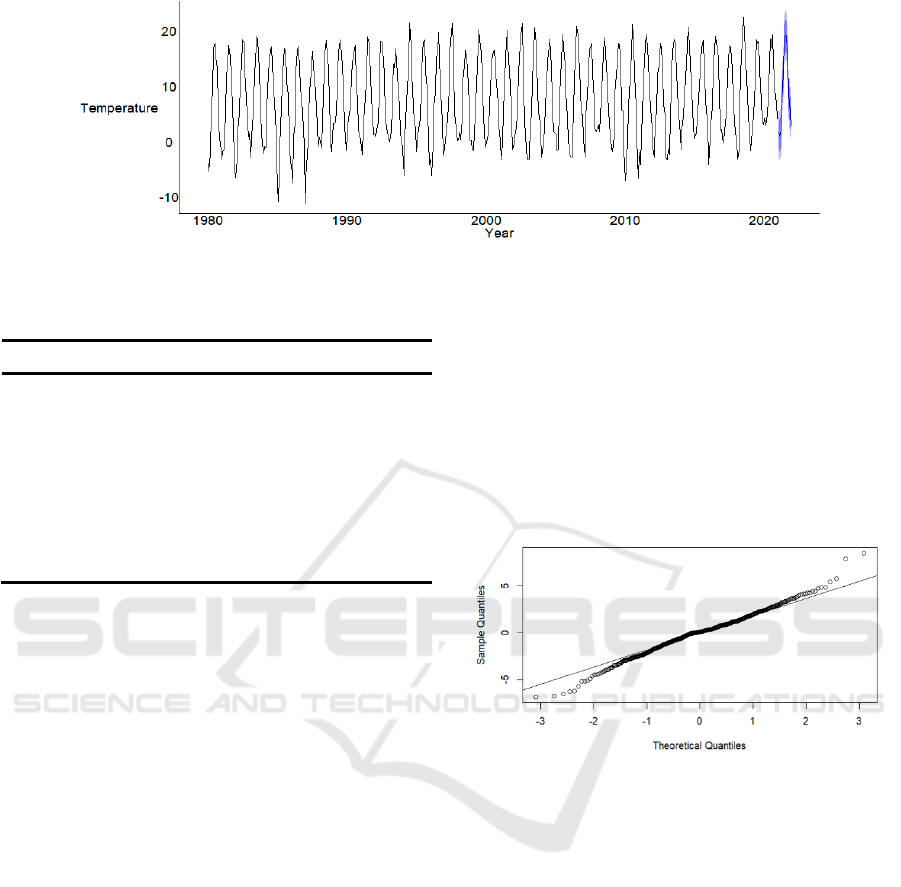
Figure 4: Temperature forecast for Stockholm over the next 12 months (Picture credit: Original).
Table 2: ARIMA (1,0,0) (2,1,0) (Bolin 2023) with drift.
Ar1
Sar1
Sar2
Drift
Coefficients
0.3177
-0.6544
-0.3265
0.0066
S.E.
0.0436
0.0440
0.0441
0.0062
Sigma^2
4.736
Log likelihood
-1055.39
AIC
2120.78
AICc
2120.91
BIC
2141.65
3.5 Residual Analysis
To assess in more detail the ability of the ARIMA
model to predict temperatures in Stockholm, a
hysteresis residual analysis was performed. By further
testing and analyzing the residual sequence, the
rationality and reliability of the model can be verified.
First, an ADF test is performed to determine the
stationarity of the residual sequence. In this study, 5%
significance level was used for testing, and p-value was
calculated to judge the results.
The ADF test reveals a p-value of 0.01 for the lag
residual, which is below the significance level of 0.05.
Consequently, we can reject the null hypothesis,
indicating the stability of the lag residual series.
Next, the autocorrelation of the lag residuals is
tested to verify whether there is a significant
autocorrelation. This is achieved by calculating the Q
statistic and comparing it with the critical value. To
perform the Box-Ljung test, a 95% confidence level is
used here and the lag order range is set to 12.
According to the BOX-Ljung test results of the
residual sequence, Q statistics are all in the confidence
interval when the order of 12 lags. This means that at
the 95% confidence level, there is no significant
autocorrelation in the lag residual series.
Finally, the QQ graph is used to check the
distribution of the lag residual sequence. The QQ chart
can be used to compare the lag residual sequence with
the theoretical normal distribution to further determine
whether the normal distribution hypothesis is
conformed to.
Figure 5 shows the QQ graph. According to the
analysis results of the QQ graph, the data points of the
lag residual series are approximately on a straight line,
which is in good agreement with the theoretical normal
distribution. The analysis indicates that the residual
difference between the predicted values and the true
values of the model exhibits characteristics of white
noise behavior.
Figure 5: QQ plot showing normality assessment of data
(Picture credit: Original).
3.6 Discussion and Limitation
Based on the above analysis, the conclusion is drawn:
the ADF test shows that the lag residual sequence is
stable, the BOX-Ljung test shows that no significant
autocorrelation between the residuals is found, and the
QQ map verifies that the lag residual sequence is
approximately in line with the normal distribution.
Based on the above discussion, the ARIMA model
performs well and robustly for the temperature
prediction of Stockholm. The accuracy and reliability
of the forecast are verified by the good agreement
between the predicted results and the actual values and
the residual analysis results.
Compared to previous studies, this study provides
more accurate temperature predictions by taking into
account seasonality and autocorrelation. The model
can capture the trends and periodic changes implied in
DAML 2023 - International Conference on Data Analysis and Machine Learning
168

the temperature data to achieve more accurate
predictions.
However, some limitations remain. First of all, the
forecast in this paper is based on historical data, and
possible unexpected events or contingencies in the
future cannot be fully taken into account. In addition,
the paper solely relies on temperature data as a
forecasting variable, while other important factors like
precipitation and wind speed may be necessary to
consider in real-world scenarios.
Although this study has certain limitations, it offers
valuable insights into the field of meteorology and
climate research in Stockholm. Moreover, its findings
hold practical application potential in various contexts.
Future studies can further improve the model and
introduce more external variables to improve the
accuracy and reliability of temperature predictions.
In further research, other time series models or
hybrid models, such as VARIMA, can be considered
to seek more accurate temperature prediction methods.
These models are able to combine seasonal, trend and
cyclical factors to further improve the accuracy of
temperature forecasts.
In addition, the predictive performance of different
models can be compared to assess their strengths and
weaknesses in the Stockholm temperature prediction.
By comparing it with other prediction models, the
model that is most suitable for the region can be
selected and more reliable predictions can be made for
relevant decisions.
In summary, the ARIMA model is used to predict
the temperature in Stockholm, and the results are more
accurate and robust. However, further improvement
and exploration are still needed to obtain more accurate
and reliable temperature prediction results and apply
them to practical meteorological and climate studies.
4 CONCLUSION
In conclusion, the developed seasonal ARIMA model,
utilizing the meteorological data from Stockholm
City's monthly average temperature spanning from
1980 to 2020, has demonstrated high forecasting
accuracy. The improved predictive accuracy of this
model will assist relevant departments in formulating
effective strategies and measures to address the
consequences of fluctuating temperature changes. By
taking proactive measures beforehand, potential
impacts can be mitigated.
However, there is scope for further improvement in
order to enhance the accuracy and stability of the
model's predictions. Different techniques or
approaches can be explored to address these areas and
achieve better results. Future research should explore
additional influencing factors when predicting time
series, which would offer new insights into time series
forecasting. Incorporating these factors into the model
will likely enhance its overall performance and provide
a more robust understanding of temperature
fluctuations.
In summary, while the present study successfully
developed a seasonal ARIMA model with impressive
forecasting accuracy for monthly average temperatures
in Stockholm City, further enhancements are
necessary. Integrating additional influencing factors
and expanding the dataset will enable more reliable
predictions and support informed decision-making in
response to temperature changes.
REFERENCES
S. Qasmi and A. Ribes, “Reducing uncertainty in local
temperature projections,” Science Advances, Oct. 2022,
vol. 8, no. 41.
T. Dimri, S. Ahmad, and M. Sharif, “Time series analysis of
climate variables using seasonal ARIMA approach,”
Journal of Earth System Science, Jun. 2020, vol. 129, no.
1.
H. Wu, J. Wang, W. Wu, H. Zhao, and P. Zhang, “Prediction
and Analysis of Global Gas Gauge Temperature Based
on ARIMA Model,” Modern Information Technology,
Aug. 2023, vol. 16, no. 7, pp. 145–150.
S. Peng, X. Zhang, M. Li, and Y. Xiang, “Drought
Prediction Based on ARIMA Model and VSWI index: a
Case Study of Northwest Guangxi,” Geomatics &
Spatial Information Technology, Dec. 2022, vol. 12, no.
45, pp. 38–41, 44.
M. Amjad, A. Khan, K. Fatima et al, “Analysis of
Temperature Variability, Trends and Prediction in the
Karachi Region of Pakistan Using ARIMA Models,”
Atmospher, Dec. 2022e, vol. 14, no. 1, p. 88.
F. Liu and R. Ge, “Prediction and Analysis of Winter Daily
Minimum Temperature Based on ARIMA,” Electronic
Technology & Software Engineering, Jun. 2022, vol. 12,
pp. 184–188.
Z. Wu, “Construction and Analysis of Temperature Change
Prediction Model in Z.Z City,” Science & Technology
Ecnony Market, Apr. 2018, vol. 3, pp. 33–34, 146.
R. Kesavan, M. Muthian, K. Sudalaimuthu, S. Sundarsingh,
and S. Krishnan, “ARIMA modeling for forecasting
land surface temperature and determination of urban
heat island using remote sensing techniques for Chennai
city, India,” Arabian Journal of Geosciences, May 2021,
vol. 14, no. 11.
H. S. Hippert, C. E. Pedreira, and R. C. Souza, “Combining
neural networks and ARIMA models for hourly
temperature forecast,” Proceedings of the IEEE-INNS-
ENNS International Joint Conference on Neural
Networks. IJCNN 2000. Neural Computing: New
Challenges and Perspectives for the New Millennium,
2000, vol. 4.
Weather Forecast Analysis Based on ARIMA Model: A Case Study of Stockholm
169

A. H. Nury, K. Hasan, and Md. J. B. Alam, “Comparative
study of wavelet-ARIMA and wavelet-ANN models for
temperature time series data in northeastern Bangladesh,”
Journal of King Saud University - Science, Jan. 2017,
vol. 29, no. 1, pp. 47–61.
X. Chen, Q. Li, X. Zeng, C. Zhang, G. Xu, and G. Wang, “A
Hybrid ARIMA-GABP Model for Predicting Sea
Surface Temperature,” Electronics, Jul. 2022, vol. 11,
no. 15, pp. 2359–2359.
S. U. Bolin Centre for Climate Research, “Stockholm
Historical Weather Observations — Monthly Mean Air
Temperatures since 1756 | Bolin Centre Database,”
bolin.su.se, Jan. 14, 2021.
https://bolin.su.se/data/stockholm-historical-monthly-
temperature-3 (accessed Oct. 30, 2023).
DAML 2023 - International Conference on Data Analysis and Machine Learning
170
