
Pre-Diagnosis of Heart Disease Based on Basic Health Information
Xinya Li
1
, Yishun Li
2
and Yunhui Liu
3
1
School of Resources and Environment, Shandong Agricultural University, Taian, China
2
School of Mathematics, Northwest University, Xi’an, China
3
School of Science, Hubei University of Technology, Wuhan, China
Keywords: Pre-Diagnosis, Heart Disease, Random Forest, Logistic Regression, ROC Curve.
Abstract: Heart disease is one of the deadliest diseases in modern society. Identifying heart disease at an early stage can
ease the stress of treatment and prevent severe health damage. In this paper, a set of data initially gathered
from the Behavioral Risk Factor Surveillance System is processed and selected to mainly focus on basic health
information related to heart disease. Random forest and logit regression are used to better comprehend the
correlation between heart disease and selected variables and to establish pre-diagnose models. Although both
models have acceptable identification ability, the logit regression model can better explain the numerical
relationship between variable values and the probability of having a heart disease. Furthermore, through the
ROC curve, it is possible to choose appropriate classification thresholds to adjust the prediction accuracy of
heart disease carriers and fit different needs. The constructed models can help to preliminarily screen possible
heart disease carriers through information that can be acquired by only a short inquiry. Therefore, proper
health suggestions and appropriate examinations could be provided to possible heart disease patients.
1 INTRODUCTION
The heart is an essential organ that sustains human life
and is an indispensable presence, but heart disease is a
common and sudden illness (Qin 2023). Although the
prevention and control of heart disease have been
gradually improved in recent years, factors such as
accelerated aging and unhealthy living habits have
increased the prevalence and mortality rates (Zhang, et
al 2022). Over the past decade or so, the mortality rate
of heart disease in urban and rural populations has
fluctuated and risen, ranking second only to malignant
tumors in terms of death. It has been reported that more
than 540,000 people die of heart disease each year in
China, which means that on average, one person dies
every minute as a result (Wei, et al 2022). According
to the China Cardiovascular Health and Disease Report
2022, the rural cardiovascular disease mortality rate in
2020 will be 336.13 per 100,000, of which the heart
disease mortality rate will be 171.36 per 100,000. The
urban cardiovascular disease mortality rate will be
291.04 per 100,000, of which the heart disease
mortality rate will be 155.86 per 100,000 (Hu and
Wang 2023). Therefore, it is vital to understand the
factors that influence heart disease and use this to
develop a timely plan.
In the process of studying factors related to
diseases and constructing statistical models, it is
essential to choose suitable indicators to form an
appropriate indicator system. However, possible
factors are countless and the connections between
factors and diseases are complex. In order to predict
heart disease accurately with more convenience, it
would be better to choose data that is strongly related
to the disease and easy to acquire and measure. From
experience, heart disease is seemingly having a
correlation with age and gender. Scholars in different
fields conducted many research and studies on heart
disease and found strong connections between heart
disease and food consumption (Li 2012). Body mass
index may also have an influence on the probability
of having heart disease according to Liu et al (Liu et
al 2022). Exercise habits and alcohol consumption
might be helpful to reduce the risk of heart disease
(Meide 1981). Mutual influence is also found
between heart disease and diabetes (Sobel and
Schneider 2013). Based on former studies, this paper
mainly focuses on 10 variables to find out the main
factors influencing the probability of getting heart
disease and calculate the numerical relationship
between the indicators. Reliable statistical model will
also be constructed to predict the probability of
getting heart disease through given information.
92
Li, X., Li, Y. and Liu, Y.
Pre-Diagnosis of Heart Disease Based on Basic Health Information.
DOI: 10.5220/0012805100003885
Paper published under CC license (CC BY-NC-ND 4.0)
In Proceedings of the 1st International Conference on Data Analysis and Machine Learning (DAML 2023), pages 92-97
ISBN: 978-989-758-705-4
Proceedings Copyright © 2024 by SCITEPRESS – Science and Technology Publications, Lda.

In similar directions, Sun et al. stratified a
community sample of people over 35 years of age for
a survey of cardiovascular disease risk factors and
performed chi-square tests on the data (Sun and Mou
2009). Song et al. similarly grouped age and
performed a chi-square test on the detection rate data
(Song, et al 2008). Dong et al. designed a
questionnaire, performed the correlation coefficient
method and factor analysis on the questionnaire data,
and then tested the questionnaire for reliability and
validity (Dong et al 2022). He et al. used t-tests for
continuous variables, chi-square tests for ranked
variables, and dichotomous logistic regression
analyses between some indicators (He, et al 2008).
The explanatory variables of a binary logit model are
two categorical variables, and the model is often used
to study the relationship between categorical
probabilities and explanatory variables (Wang, et al
2021). The aim of the study in this paper is to
investigate the factors influencing heart diseases,
whether being suffering from the disease is a fixed
category of data and the values are two, yes or no. In
summary, after consideration and optimization,
binary logit regression analyses are applied to study
the effect of factors on heart diseases, i.e., whether
they are factors that possibly lead to heart diseases.
Therefore, all 10 variables presented in the dataset
should be considered as factors influencing the
probability of having a heart disease. Random forest
and logistic regression will be used to estimate the
exact influence of each variable on heart disease and
to construct a numerical model to give instruction
when pre-diagnosing heart disease.
2 METHODS
2.1 Data Source
The Cardiovascular Diseases Risk Prediction Dataset
on the Kaggle website was obtained from the
Behavioral Risk Factor Surveillance System and was
preprocessed and cleaned. The Behavioral Risk Factor
Surveillance System initially collect data through
telephone investigations to estimate domestic health
status in the USA. The dataset used in this paper was
further processed and selected from the
Cardiovascular Diseases Risk Prediction Dataset to
focus mainly on variables regarding heart disease.
2.2 Variable Description
The dataset used in this paper contains 4855
observations and 11 variables. 5 of the variables are
binary categorical variables while 6 of them are
continuous numerical variables. However, the initial
variable “Age_Category” contains rank data. The
median is used to represent each level so the data can
be recognized and processed as continuous numerical
data, and the variable term is changed to “Age”. Table
1 demonstrates a further explanation of each variable.
Table 1: Variable Description.
Term
Symbol
Type
Exercise
X
1
Categorical
Diabetes
X
2
Categorical
Sex
X
3
Categorical
Age
X
4
Numerical
BMI
X
5
Numerical
Smoking_History
X
6
Categorical
Alcohol_Consumption
X
7
Numerical
Fruit_Consumption
X
8
Numerical
Green_Vegetables_Consumption
X
9
Numerical
FriedPotato_Consumption
X
10
Numerical
Heart_Disease
-
Categorical
2.3 Method Introduction
Random forest is an integrated learning model with
decision trees as the basic classification. Random
forests can be used for both classification and
regression and have high prediction accuracy without
a significant increase in computing power.
The logit regression model is the most widely used
discrete choice model. The dependent variable is
usually required to be a qualitative variable, while the
independent variable can be either a qualitative
variable or a quantitative variable. Predicting diseases
based on patient information is also one of the most
classic application scenarios of logit regression.
According to the dataset, the variable to be
predicted in this paper is a binary qualitative variable,
and there are both qualitative and quantitative
variables in the dependent variable. Therefore, both
logit regression and random forest are appropriate to
study the correlation between heart disease and the
remaining 10 indicators. A random forest model and a
logit regression model will be constructed to identify
heart disease carriers.
3 RESULTS AND DISCUSSION
3.1 Discriptive Data Analysis
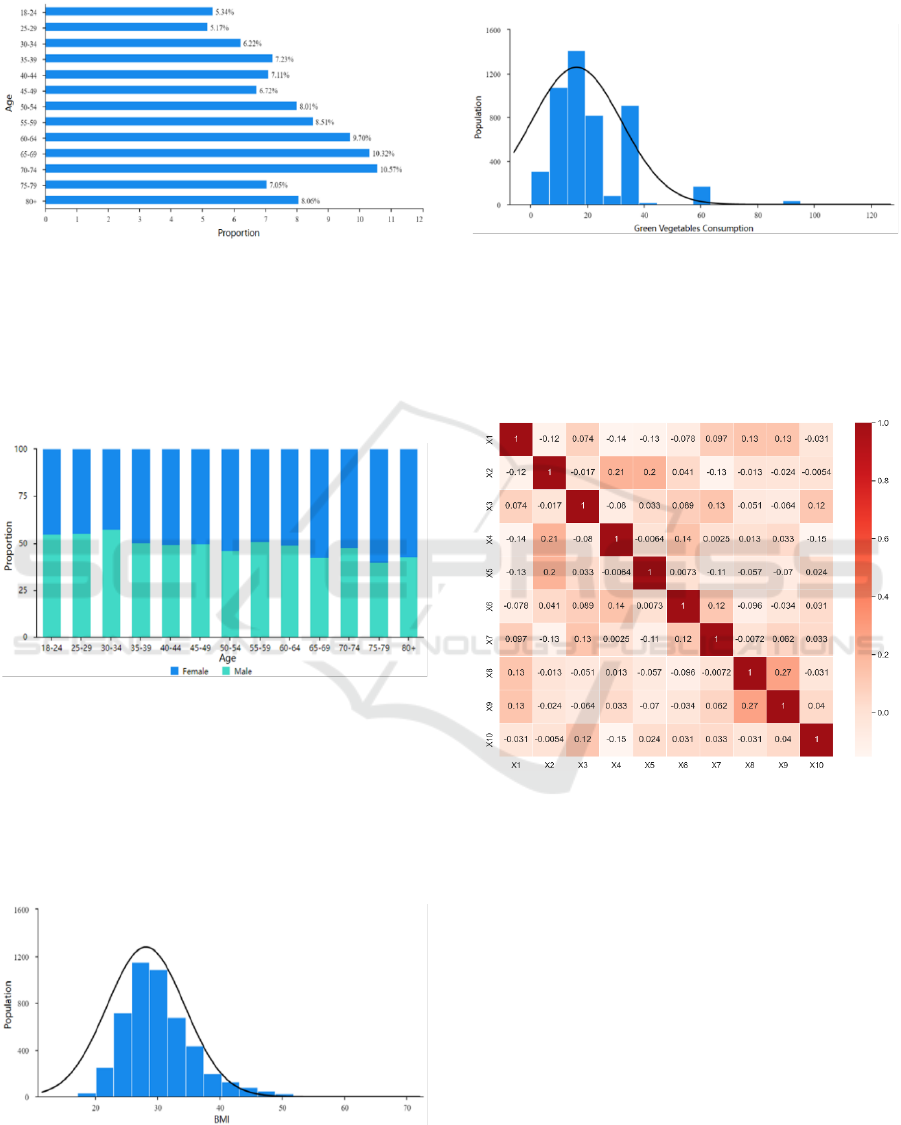
Figure 1 shows the distribution of age. Subjects in the
dataset basically cover all ages above 18. There are
Pre-Diagnosis of Heart Disease Based on Basic Health Information
93
sufficient samples in each age group, meaning the
dataset is fairly representative in terms of age.
Figure 1: Bar Chart of Age Category (Picture credit:
Original).
As can be seen in Figure 2, younger group tend to
have slightly more male subjects while elder group ten
to have a little more female subjects. But the
proportion of female and male is approximately equal
in general.
Figure 2: Gender Distribution by Age Group (Picture credit:
Original).
From Figure 3, it can be seen that the distribution
of the Body Mass Index is right-skewed. A large
number of respondents have a BMI between 20 and
30, which falls within the normal to overweight range.
However, there are also a significant number of
respondents with a BMI in the obese range (>30).
Figure 3: Distribution of BMI (Picture credit: Original).
Figure 4 shows that green vegetable consumption
appears to be normally distributed. Most respondents
eat green vegetables around 15 times a month.
Figure 4: Distribution of Vegetables Consumption (Picture
credit: Original).
As can be seen from Figure 5, the correlation
coefficients between the variables are very low and
there is no multicollinearity, thus allowing regression
analyses to be performed.
Figure 5: Correlation Heatmap (Picture credit: Original).
3.2 Random Forest
In the processing of fitting Random Forest, the
importance of variables can also be obtained. Figure 6
states that BMI has the greatest influence on the
probability of having a heart disease.
The training set ratio is set to 0.8, the number of
decision trees is 100, the node splitting criterion is
Gini, and the maximum depth of the tree is not
restricted for Random Forest. From Table 2, it can be
seen that: the model obtained an average accuracy of
86%, a recall rate of 91%, and an f1-score of 0.87. The
model results are acceptable.
DAML 2023 - International Conference on Data Analysis and Machine Learning
94

Figure 6: Variable Importance from Random Forest (Picture
credit: Original).
Table 2: Test Results of Random Forest.
-
Accuracy
Recall Rate
f1-score
Sample Size
0.0
0.91
0.99
0.95
886
1.0
0.29
0.02
0.04
85
Accuracy
0.91
971
Average Value
0.86
0.91
0.87
971
3.3 Binary Logistic Regression
This paper uses the Binary Logistic Regression model,
whether or not to have heart disease is the dependent
variable, and the 10 factors are the independent
variables, where 0 represents no and 1 represents yes.
Next, this paper uses SPSSAU to analyze the
influence of the 10 factors on the probability of having
a heart disease. The model can be expressed as follows
and the following p denotes the probability of having
a heart disease.
(1)
(2)
The logit model is constructed with 4855 samples
and 10 variables in the full dataset. The calculation
results of Model 1 are displayed in Table 3.
It can be seen from Table 3 that gender and
diabetes have a significant influence on heart disease.
The odd of heart disease in men is 2.69 times that in
women, and the odd of diabetes patients is 2.336 times
that of people without diabetes. Furthermore, people
with a history of smoking are 1.829 times more likely
to suffer from heart disease than people without a
smoking history. Growing older also increases the risk
of heart disease. With every additional year of age, the
risk of heart disease increases by 1.368 times. But at
the same time, drinking alcohol and green vegetable
intake can effectively reduce the prevalence of heart
disease. When their monthly intake of alcohol and
green vegetables increased, heart disease odd
decreased by 0.979 and 0.991 times, respectively.
However, exercise, BMI, fruit consumption, and fried
potato consumption do not have a significant effect on
heart disease according to the p value.
Table 4 shows the confusion matrix when the
classification threshold is 0.5 by default. By
calculation, the total accuracy of prediction is 92.21%.
When the true value is 0, which means when the
subject does not have heart disease, the prediction
accuracy is extremely high. When subjects do have
heart disease, however, the forecast accuracy drops to
merely 2.96%, which is unacceptably low.
Table 3: Results for Binary Logistic Regression Model.
Term
Coefficient
p value
OR
Exercise
-0.22
0.089
0.803
Diabetes
0.99
0
2.69
Sex
0.849
0
2.336
Age
0.314
0
1.368
BMI
0.015
0.13
1.015
Smoking_History
0.604
0
1.829
Alcohol_Consumption
-0.021
0.004
0.979
Fruit_Consumption
-0.003
0.176
0.997
Green_Vegetables_Consumption
-0.009
0.044
0.991
FriedPotato_Consumption
0.009
0.188
1.009
-7.14
0
0.001
Table 4: Confusion Matrix of the Logit Model.
Predicted Value
0
1
True
Value
0
4465
18
1
360
12
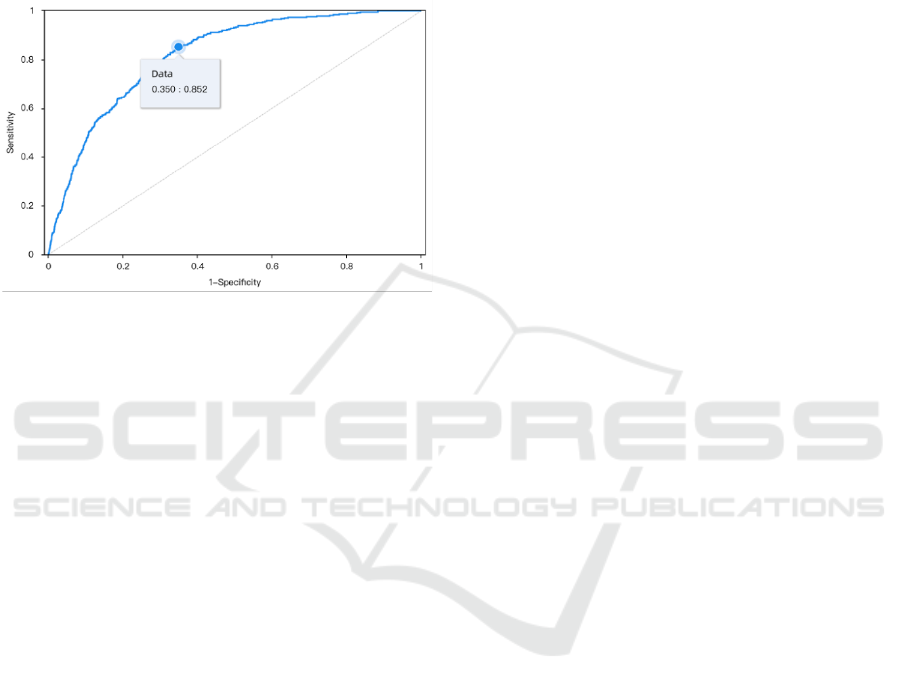
3.4 ROC Analysis
From the ROC curve on Figure 7, the AUC value is
calculated to be 0.820, which means the constructed
logistic model has the ability to effectively divide
people with heart disease and people without it. The
problem probably comes from the huge gap between
Pre-Diagnosis of Heart Disease Based on Basic Health Information
95
the proportion of subjects with heart disease and
subjects without it in the dataset used. When there are
too few subjects with heart disease in the dataset, it is
easy to obtain high accuracy by classifying more
subjects possible under the no-heart-disease category.
Therefore, accuracy is not a reasonable indicator to
evaluate the quality of the logit model if the purpose is
to identify heart disease carriers.
Figure 7: ROC Curve of Logit Regression Model (Picture
credit: Original).
Sensitivity is the accuracy when the true value is 1,
and Specificity is the accuracy when the true value is
0. When the goal is to identify as many heart disease
carriers as possible, the Sensitivity should be high with
the Specificity at an acceptable level. According to
Fig.7, when the Sensitivity is over 0.85, Specificity is
0.65. The classification threshold is calculated to be
0.0628. It means when the threshold value is set to
0.0628, the model can identify over 85% of heart
disease carriers while misclassifying 35% of non-
carriers as heart disease carriers.
4 CONCLUSION
This study selected 4855 observations and 10 variables
from the dataset, focusing on possible influencing
factors related to the development of heart disease. A
random forest model and a binary logit model are
constructed respectively trying to predict whether the
subjects have heart diseases.
The random forest model has a total accuracy of
86% and an AUC value of 0.88, indicating it can be
considered an effective model. However, the
prediction accuracy of heart disease carriers is
significantly lower than that of non-carriers, which
might be resulted from the proportion difference
between carriers and non-carriers in the dataset.
Increasing the sample size may also help to improve
accuracy.
The logit model has a total accuracy of 92% and an
AUC value of 0.82, proving its effectiveness.
However, the prediction accuracy of heart disease
carriers and non-carriers also have a huge difference
because of the proportion difference in the dataset.
Therefore, the ROC curve is introduced to adjust the
accuracy. By choosing an appropriate threshold value,
the accuracy of identifying heart disease carriers can
be improved at the cost of sacrificing the prediction
accuracy of non-carriers.
By comparison, the random forest model and the
logit regression model both have the ability to identify
heart disease carriers and non-carriers. However, the
logit regression model can better interpret the
relationship between variables and the risk of having a
heart disease. Adjusting threshold value can also help
the logit model to fit different needs.
It is undeniable that due to the limited amount of
data collected, the models may have errors. The
samples only cover a certain population, which may
cause some differences and affect the accuracy of the
results. Limited by the knowledge level of the authors,
this paper cannot better interpret and improve the
model. However, this paper proposes possible methods
to predict and screen potential heart disease carriers,
hoping to provide inspiration and ideas for clinicians
and future studies.
4.1 Authors Contribution
All the authors contributed equally, and their names
were listed in alphabetical order.
REFERENCES
C. C. Qin, “Research on Heart Disease Prediction Based on
Catboost Model,” Qufu Normal University, 2023.
F. Zhang, et al, “Analysis of Heart Disease Mortality Trends
among Residents of Death Cause Monitoring Points in
Hebei Province from 2014 to 2019,” China Public
Health Journal, vol. 38(03), pp. 351-355, 2022.
Q. Wei, et al, “Joinpoint regression analysis of heart disease
mortality trends in urban and rural China from 2004 to
2019,” Chinese Journal of Cardiology, vol. 27(04), pp.
371-376, 2022.
S. S. Hu and Z. W. Wang, “Overview of China
Cardiovascular Health and Disease Report 2022,” China
Cardiovascular Disease Research, vol. 21(07), pp. 577-
600, 2023.
D. M. Li, “A natural vegetable and fruit diet may offset the
impact of genetic factors on heart disease,” Knowledge
of Cardiovascular Disease Prevention and Control
(Science Popularization Edition), vol. 05, p. 66, 2012.
DAML 2023 - International Conference on Data Analysis and Machine Learning
96

J. K. Liu, et al, “The mediating role of body mass index in
the association between cerebrovascular disease and
heart disease in the elderly,” China Journal of Chronic
Disease Prevention and Control, vol. 30(04), pp. 246-
250, 2022.
D. Meide, “Moderate alcohol consumption and exercise can
reduce the risk of heart disease,” Foreign Medical
Intelligence, vol. 07, pp. 113-114, 1981.
E. B. Sobel and J. D. Schneider, “Medical Management of
Diabetes and Heart Disease,” Taylor and Francis; CRC
Press, April 2013.
M. Sun and J. J. Mou, “Investigation and risk factor analysis
of cardiovascular diseases among urban residents in
Shaanxi Province,” Grassroots Medical Forum, vol.
13(22), pp. 691-693, 2009.
Z. G. Song, et al, “Survey of Cardiovascular Diseases
among Middle and Young Workers in Tongxiang City,”
Zhejiang Preventive Medicine, vol. 08, pp. 24-27, 2008.
S. Q. Dong, X. Zheng and X. Li, “Design and evaluation of
a survey questionnaire on the health status of traditional
Chinese medicine and cardiovascular disease risk
factors among college students,” Modern Distance
Education of Traditional Chinese Medicine in China,
vol. 20(11), pp. 150-152, 2022.
C. S. He, et al, “Investigation and risk factor analysis of
cardiovascular diseases in maintenance hemodialysis
patients,” Journal of Sun Yat sen University (Medical
Science Edition), vol. 29(S1), pp. 45-47, 2008.
H. Q. Wang, et al, “A study on the influencing factors of
academic problems among college students based on
binary Logit regression model,” Science and
Technology and Innovation, vol. 01, pp. 40-43, 2021.
Pre-Diagnosis of Heart Disease Based on Basic Health Information
97
