
Regression Models for Bike Rental Prediction Based on External
Factors
Wenda Li
School of Philosophy, Renmin University of China, Beijing, China
Keywords: Data Mining, Regression Model, Intelligent Transportation.
Abstract: Recently public bike systems have been more and more popular for its environmental effects and accessibility
for daily use. Various researches have been conducted to improve all elements of the bike rental business,
such as determining the requirements for bikes in each bike station and designing the bike recycling route. In
order to develop more efficient bike systems, this paper applied two different kinds of regression models to
predict the demand for rental bikes considering weather and temporal factors based on actual data in a big
city. Three model frameworks are used in this paper, which are the backward stepwise selection model, ridge
regression and lasso. These models show that holidays, weather situations and humidity are negative factors
affecting the count while the weekday, working day, and feeling temperature are positive factors. The decision
tree models are used and show better performances than linear models. The result shows that the random
forest model has the best effect in predicting the demand for bikes. The study will contribute to the bike
system managers to determine the redistribution of bikes depending on external factors and utilize the total
amount of bikes placed in the system over a long period of time.
1 INTRODUCTION
Many countries have been running public bike
systems, such as New York’s city bike system and
Beijing’s shared bike system. The emergence of a
public bike system not only plays an important role in
environmental and health issues but effectively
compensates for the deficiency of public
transportation as well. Users can rent a bike from one
location and return it to a different bike station with
ease and this can save lots of time in travelling. Apart
from the convenience of the bike system, the
distribution of the bike system is also worth paying
attention to. The accessibility of public bikes for
residential areas and working places means that the
number of bikes at each location should be distributed
fairly and adequately. To avoid situations where there
are no bikes or slots at a bike station, it is important to
predict how many bikes will be needed in the future
since accurately predicting the demand of shared
bicycle users helps to achieve the matching of supply
and demand of shared bicycles.
The affecting reasons for public bikes demand
vary a lot with internal factors and external factors.
People’s preference to rent bikes for travelling and
commuting, how clean and the bikes look and how
comfortable bike users feel while in riding, are several
kinds of internal factors that influence people’s
choices of bike riding. These factors mostly represent
people’s perspectives about bike riding and they
inherent many aspects of views about ideas and
incentives, which implies that people’s need are
irrational, formed over a long time, affected by many
complex factors and it is difficult to capture by
measuring and setting variables and hared to predict
further. Thus, to accurately predict the future using of
bikes, using external data better fits the purpose and
statistical methods. One advantage of external data is
that many companies have shared their data, giving
access to data about time, weather and how the bikes
are used. What’s more, since people tend to react
quickly to the external factors, predictions based on
them can reflect the rental demand in a short term,
usually within a day, which can improve the accuracy
of the prediction. The bike managers can make very
timely and effective changes to the bike distribution.
This paper will propose multiple factors
regressions to predict the amount of bike renting in a
bike system using open-source data. First, this paper
will extract and explore the data of external factors,
such as weather condition, time and temperature and
sort them by day. Then, this paper will describe two
kinds of models--the linear regression models and tree
regression models. In each kind of model, this paper
Li, W.
Regression Models for Bike Rental Prediction Based on External Factors.
DOI: 10.5220/0012801900003885
Paper published under CC license (CC BY-NC-ND 4.0)
In Proceedings of the 1st International Conference on Data Analysis and Machine Learning (DAML 2023), pages 35-41
ISBN: 978-989-758-705-4
Proceedings Copyright © 2024 by SCITEPRESS – Science and Technology Publications, Lda.
35

will provide an improved version of the basic model
so that the model’s accuracy is increased and the error
is reduced, improving the model’s prediction accuracy.
Finally, this paper will evaluate two kinds of models
and compare their predicting outcomes through MSE,
and CV errors. The best model among all the
considered models will be given and used to predict
the bike rental number in a short period of time.
2 LITERATURE REVIEW
Bike-sharing systems have become a popular research
topic in recent years. To develop more efficient bike-
sharing systems, researchers have examined the
distribution strategy of bikes, accessibility for users,
and predicting rental bike demand. The station areas
of Madrid's bike-sharing system were improved by
using a technique based on a geographic Information
System (GIS) that updated the information on
population and employment to estimate the
distribution of spatial needs (García-Palomares et al.,
2012). The problem was divided into two parts:
finding the needs for each level of station management
and contriving the best routes to design the bicycle
inventory (Schuijbroek et al., 2016).
Foreseeing the demand of bike users is essential
for managing the total supply and allocation of shared
bikes. Thus many researchers have concentrated on
the relative factors of bike demand. Zheng et al.
studied the influencing factors and utilized a cluster
strategy with similar patterns to simulate the effect of
weather conditions on usage numbers (Zheng et al.,
2018). An unobserved component model has been
applied to calculate the forecast of monthly rentals of
bikes of a BSS in Germany (Wirtgen et al., 2022).
With the deep neural network, the accuracy of
prediction can be improved and the flexible fitting of
the model can be achieved (Thirumalai and
Koppuravuri, 2017). Although numerous researchers
have investigated the overall demand and accessibility
of public bike-sharing systems, not many researches
focused on explaining certain influencing factors,
such as weather conditions and dates. In this study,
this paper will focus on predicting problems in public
bike rental demand considering weather and temporal
conditions.
In this paper, six algorithms will be used: (a).
Backward selection regression model (b) Ridge
regression (c)Lasso (d) Bagging (e) Random forest (f)
Boosting. As for the method, the boosting algorithm
presented very excellent performances in demands of
free-floating car service prediction (Alencar et al.,
2021). R. Simon et al. developed and compared the
state-of-the-art Random Forest algorithm and
Convolutional Neural Networks to better predict short
and long-term bike rental count (Ruffieux et al., 2017).
MLR and ARIMAX have been applied to predict the
travel time in BSS of Washington (Salih-Elamin and
Al-Deek, 2020). Li developed a BRNN through linear
regression to predict bikes and used GA to minimize
the schedule cost (Li, 2020).
The cross-validation method will be applied to the
training data and test data to find the best
hyperparameter. Then this study will consider which
is the best model with its corresponding performance.
In the last part, a variable importance analysis will be
carried out to determine which factor occupies the
most essential part of the regression model.
3 DATA PREPARATION AND
EXPLORATORY ANALYSIS
This research uses two-year data from the Rental Bike
Sharing Data Set that was obtained from the Kaggle
website (Fanaee-T and Gama, 2014). The data set time
starts from 2011, January and ends at 2012, December
and records the number of rental bikes for each hour
and each day. Table 1 shows the rental bike-sharing
data set variables and their corresponding description.
Table 1: Description of Variables in the Rental Bike Sharing Data Set.
Parameters Abb
r
. Classification
Date and time Hourly Date and timestamp Y-M-D
Number of total rentals Count Continuous Variable
Hour Hour Continuous Variable
Temperature Temp Continuous Variable
“feel like”temperature Atemp Continuous Variable
Relative Humidity Hum Continuous Variable
Wind speed Wind speed Continuous Variable
Season Season Categorical Variable
Holiday Holiday Categorical Variable
Workingday Workingday Categorical Variable
Weather Weathersit Categorical Variable
Week status Wstatus Categorical Variable
Day of the week Weekday Categorical Variable
DAML 2023 - International Conference on Data Analysis and Machine Learning
36
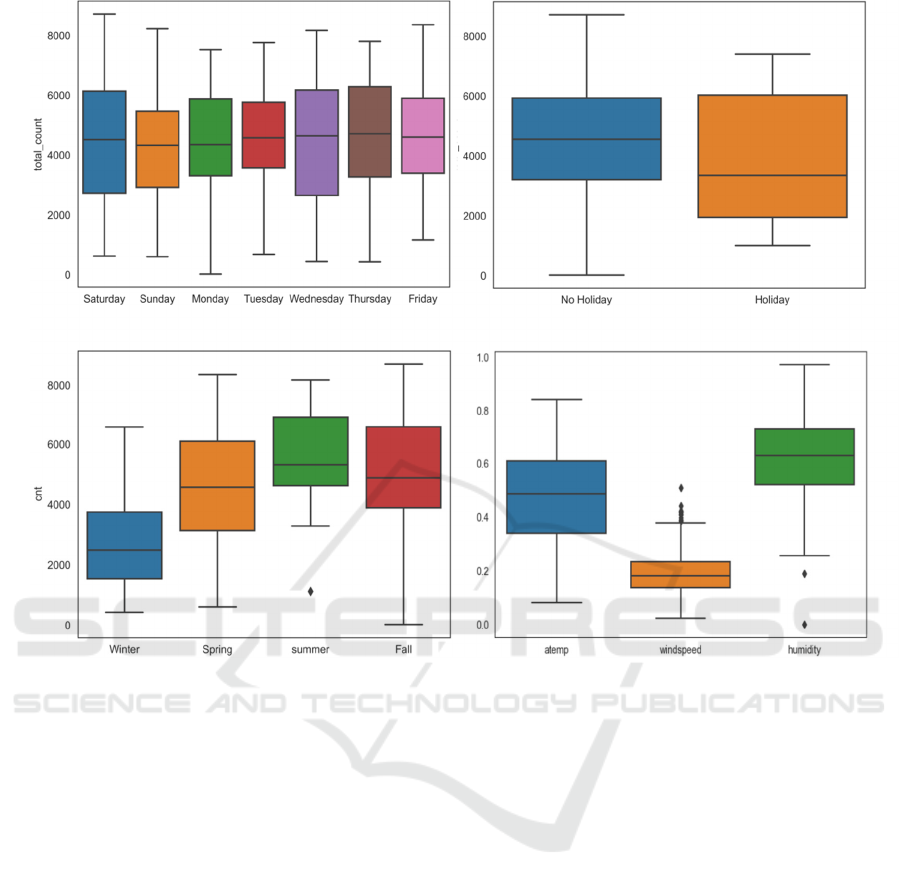
Figure 1: Boxplots for rental bike sharing data (Picture credit: Original).
Figure 1 represents the boxplots of the count of
rental bikes depending on the day of the week,
working day, season, and the distribution of weather
conditions. The rental count in holiday is less than that
in no holiday time and this can be witnessed in the top
right panel. The figure on bottom left of figure 1
presents rental bike use in winter is less than that in
other seasons, which reveals the seasonal effect of
weather use. This is probably because people use
fewer bikes to commute on holidays. Since the traffic
highly depends on weather conditions, the count
corresponding weather, such as little clouds (including
clear weather), mist, drizzle, snowstorm, recorded in
the data will significantly change the bike use demand.
In this study, the measurable weather factors such as
temperature, wind and humidity factors will also be
considered because they are important weather
indicators as well. The bottom right panel shows the
distribution of normalized measurable weather data. It
is worth noting that the temp and atemp are highly
positively correlated, which shows that they contain
the same information. Hence this paper is going to
ignore temp and use atemp in the following analysis.
In short, the predictors that will be considered
mainly include the temporal reasons and climate
reasons and the variables are Atemp, Hum, Wind
speed, Holiday, Working day, Weather, and Weekday.
The grid search method suggests choosing the best
settings by arranging all possible grids in the space of
parameters. Each grid axis represents a parameter of
the algorithm, and each point in the grid corresponds
to a specific combination of parameters (Ve and Cho,
2020). The bike rental data will be split into training
data set and a test data set using a 10-fold validation
test to find the best hyperparameters. Thus the data set
will be divided into two parts, each part containing half
of the full data set. 10 rounds of training and validating
will be applied and all the result validation errors will
be averaged to reduce the mean square error. Such
predictive accuracy and MSE control are optimized.
Regression Models for Bike Rental Prediction Based on External Factors
37
4 ANALYSIS OF INFLUENTIAL
FACTORS OF BIKE RENTAL
DATA BASED ON LINEAR
REGRESSION MODEL
4.1 Methodology
Backward stepwise selection and forward stepwise
selection are two easily applicable methods to
calculate the coefficients and quickly establish a
model using different counts of predictors. To the
characteristics of the backward method, backward
stepwise selection begins with the full least square
model that includes all predictors, and then eliminates
the predictor that is the least helpful one by one.
Since the variables satisfy that there are less
variables than the samples, this paper can apply
backward stepwise selection to the data.
The values that minimize the ridge regression
coefficient
β
ˆ
estimates (Ridge) are
===
+−−
p
j
j
n
i
p
j
ijji
xy
1
2
2
11
0
)(
βλββ
(1)
λ≥0 represents a parameter in (2) (James et al.,
2011). The second term
=
p
j
j
1
2
βλ
is called a shrinkage
penalty. Ridge regression improves the over least
squares because the ridge coefficient. estimates lead to
a substantial reduction in the variance of predictions
The lasso coefficients
β
ˆ
(Lasso) minimize
===
+−−
p
j
j
n
i
p
j
ijji
xy
1
2
11
0
)(
βλββ
(2)
The Lasso model has advantages in finding key
predictors because it can perform variable selection.
4.2 Model Development
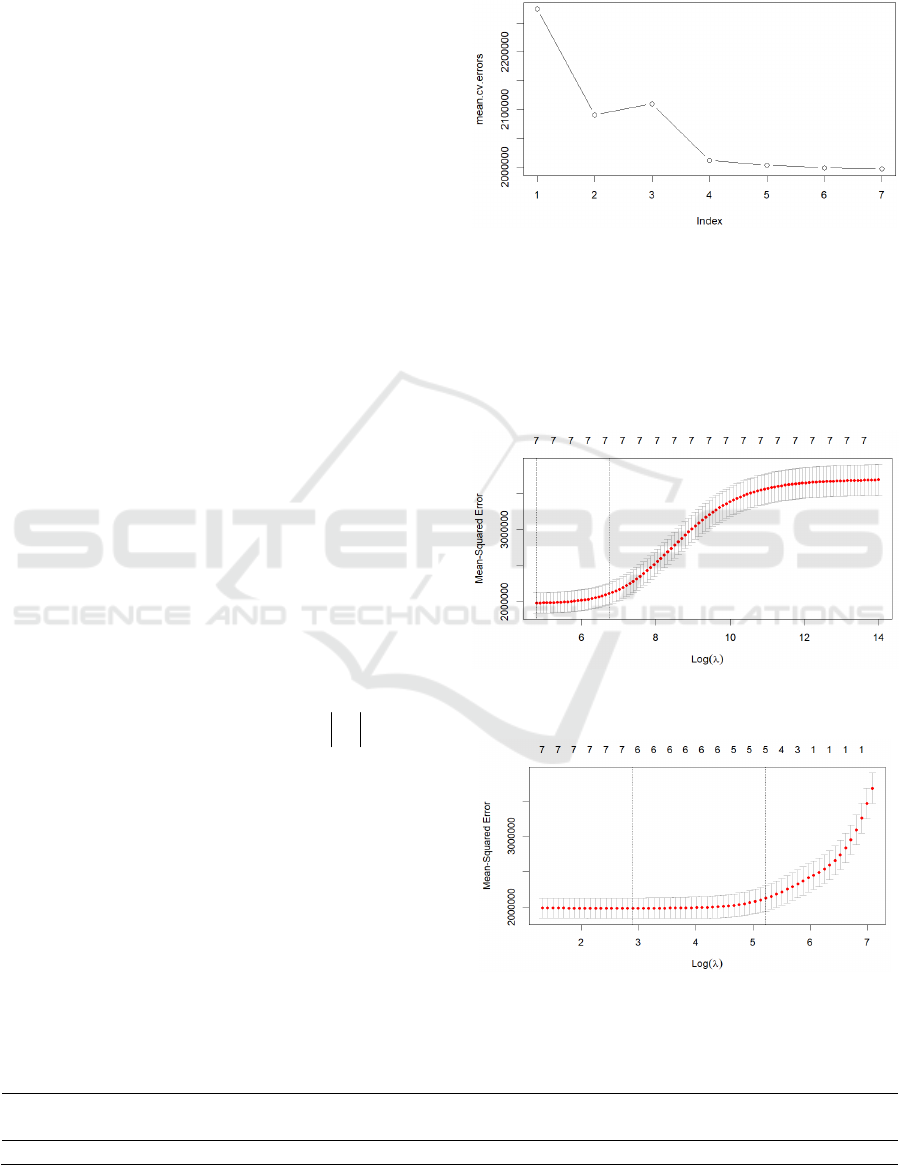
The backward stepwise selection regression requires
us to determine how many variables k are to be applied
in the model. The test MSE in the training set is a
measure of fitting outcome. The lower the test MSE,
the better the model. Figure 2 shows the test MSE for
models corresponding with their numbers of variables.
The model with seven variables has the lowest test
MSE, which means it is the best model among the ones
considered. Table 2 shows the coefficients in the 7-
variable model.
Figure 2: Test MSE (Picture credit: Original).
The ridge regression and lasso select the hyper
parameter λ which results in the smallest test MSE and
this paper can minimize the cross-validation error
through the grid searching process. The process is
displayed in figure 3,4 and the coefficient outcome is
shown in table 3 and 4.
Figure 3: Grid search result for ridge regression (Picture
credit: Original).
Figure 4: Grid search result for Lasso (Picture credit:
Original).
Table 2: Coefficients of BSS.
Predictors (intercept) Holiday Weekday Working day Weathersit Atemp Hum
Wind
spee
d
Value 3451.77 -481.79 64.06 108.25 --506.73 7164.10 -1856.16 -3808.24
DAML 2023 - International Conference on Data Analysis and Machine Learning
38

Table 3: Coefficients for Ridge Regression.
Predictors (intercept) Holiday Weekday Workingday Weathersit Atemp Hum Wind speed
value 3514.29 -467.52 61.02 111.46 -528.10 6716.66 -1612.89 -3285.63
Table 4: Coefficients for Lasso.
Predictors (intercept) Holiday Weekday Workingday Weathersit Atemp Hum Wind speed
value 3377.84 -404.70 56.36 78.45 -500.88 7064.51 -1691.33 -3540.10
From the ridge regression model, it can be seen
that when the holiday increases by one unit, the total
count of bikes (TCB) decreases by 467.52 units; this
is probably because on holiday people use less public
transportation to commute between workplace to
home. When the weekday increases by 1 unit, the TCB
increases by 61.02 unit; when working day increases
by 1 unit, the TCB increases by 111.46 unit; when
weathers increase by 1 unit, the TCB decreases by -
528.10 units; the coefficient outcome between weather
and TCB shows that extreme weather conditions hold
more people indoor. When atemp increases by 1 unit,
the TCB increases by 6716.66 units; when humidity
increases by 1 unit, the TCB decreases by 1612.89
units. Such an outcome reveals that people tend to
choose bike riding when the weather gets warmer and
drier. The overall outcome shows that holidays,
weathers and humidity are negative factors affecting
the TCB, while the weekday, and working day atemp
are positive factors.
From the lasso model, it is the same for the ridge
regression model that holiday, weather and humidity
are negative factors affecting the TCB, while the
weekday and workingday atemp are positive factors.
However, different from the ridge regression, the
atemp, humidity, and wind speed take up larger
importance in the lasso model.
The lasso regression coefficient estimates for the
bike rental data are displayed in figure 5. As λ
increases, the L1 Norm decreases. All coefficients
increases as the L1 Norm increases.
Figure 5: Lasso coefficients with L1 norm (Picture credit:
Original).
5 BIKE RENTAL DEMAND
PREDICTING MODEL BASED
ON TREES REGRESSION
MODEL
5.1 Model Introduction
Bagging is a general and efficient method for lowering
the variance in a statistical learning procedure. The
bagging algorithm can be expresses as the following
form (James et al., 2011):
).(
ˆ
1
)(
ˆ
1
*
xf
B
xf
B
b
b
bag
=
=
(3)
Random tree can enhance the bagged trees through
making a small tweak that makes the trees more
diverse. At each split of the tree, a subset of m (m<p)
predictors is randomly selected from the total set of p
predictors as split candidates. This paper choosed m=
here in our model consideration.
Boosting fits small trees to the residuals and adds
new decision trees to the fitted function, which
improves the model where it is weak.
Since there are 4 qualitative predictors in the
chosen 7 predictors of the model, this paper may apply
tree models to the data to improve the predicted result.
Trees are very explainable for the predictors and they
can more easily simulate the real decision-making
scenario for bike renting.
5.2 Model Development
The ordinary decision tree suffers from high variance.
Bootstrap aggregation can be a very useful method to
reduce the variance. This paper constructs B
regression trees using B bootstrapped training sets and
averages the resulting predictions. The individual tree
goes deep and is not pruned leading its high variance.
However, they also have rather low bias and to
compensate for the rising variance, averaging these
trees is necessary. In this way, trees are obtained in
proper range of variance and bias.
Regression Models for Bike Rental Prediction Based on External Factors
39
In the bagging procedure, mtry value of 7 is
chosen. In contrast, when a random forest model is
applied, the commonly acceptable mtry is 3 here.
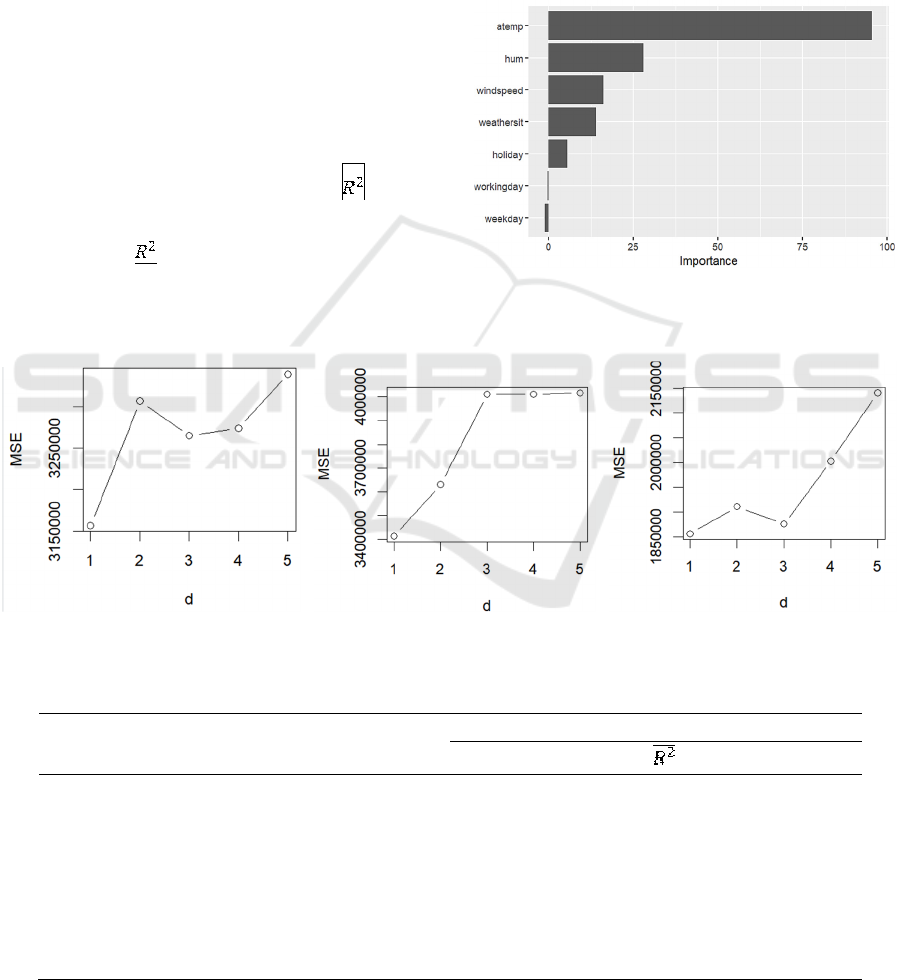
The hyperparameters in boosting are B,λ, and d.
B is the number of trees, λ is the shrinkage parameter,
and d is the number of splits in each tree. They
determine the complexity of the boosted ensemble. A
single split in each tree makes it a stump, which works
well when d=1. The optimal hyperparameters for B
and λ is 50 and 0.2. The hyper parameter tuning output
is shown in figure 6.
6 RESULTS & DISCUSSION
After training all the regression models, the
performance of each of them in the Rental Bike
Sharing Data is evaluated through MSE,
and CV
errors. The model performs with the lowest MSE and
CV and highest
value is the best one. As table 5
shows, the tree model performs better than linear
models in the test result. Among the tree models the
random forest tree model performs best between other
tree models. The backward selection model has the
worst performance of the six models.
Variance importance analysis helps to identify the
most important features for each model. As it is shown
in figure 7, atemp, humidity and windspeed factors are
the most influential variables in the random tree model
and atemp is the most significant factor in all seven
predictors, which shows that temperature takes up
most of people’s consideration when choosing public
bikes.
Figure 7: Variance importance error for random forest
model (Picture credit: Original)
.
Figure 6: Lasso coefficients with L1 norm grid search result for boosting regression( Left Side:λ=0.05;Middle :λ=0.2;Right
Side:λ=0.5) (Picture credit: Original).
Table 5: Model Performance.
Testing
Models Hyperparameter MSE
CV
Backward Selection Regression k=7 2117970 0.51 1996719
Ridge regression λ=121 2024368 0.53 1913997
Lasso λ=35 2022813 0.57 1906772
bagging mtry=7 1894905 0.65 1781000
Random Forest mtry=3 1828957 0.79 1671845
boosting d=1,B=50,λ=0.2 1879793 0.71 1742764
DAML 2023 - International Conference on Data Analysis and Machine Learning
40
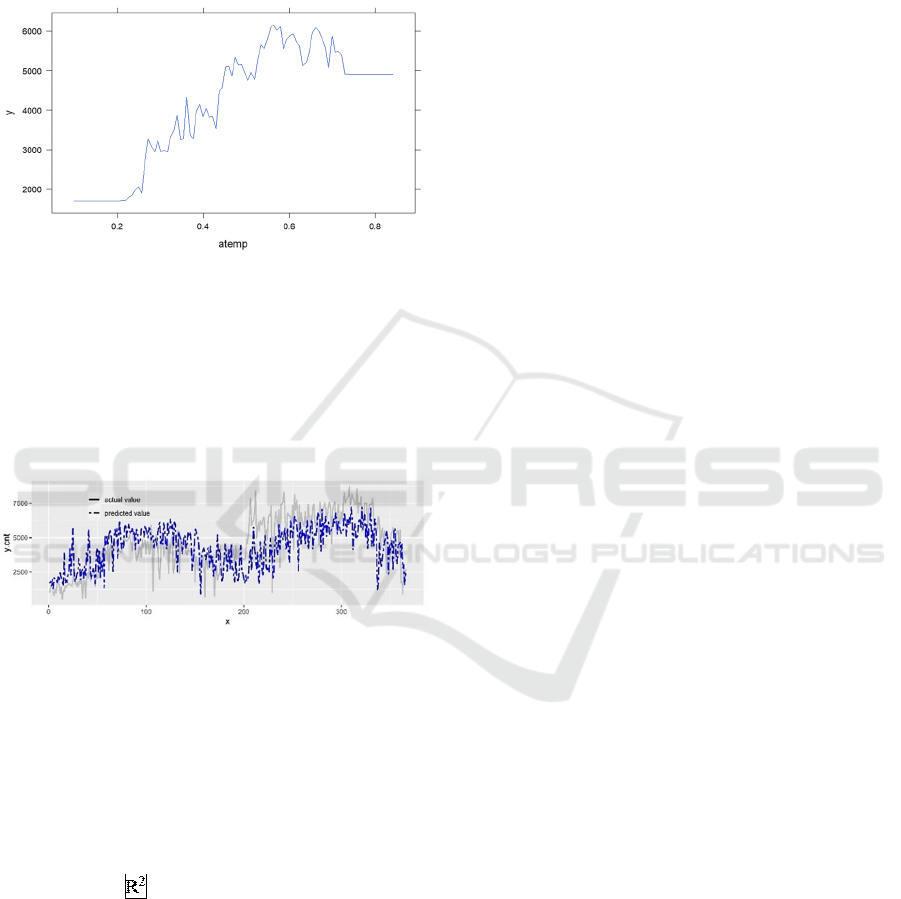
This paper also produces the partial dependence plot
for atemp variable. After accounting for all the
variables, the marginal effect of the selected variables
is illustrated in Figure 8. As the paper presumed, the
count of bikes first increases with atemp and at about
0.6 it reaches the climax, then decreases with atemp.
Figure 8: Partial independence plot for atemp variable
(Picture credit: Original).
Figure 9 shows the fitted values and the actual values
of the data by the random forest model. The model
fitting effect is good, as the two lines in the
comparison chart are very close. This can be
illustrated through that the model’s fitted value is
much around to the actual value.
Figure 9: Fitting plot for random forest (Picture credit:
Original)
.
7 CONCLUSION
The study mainly focuses on the bike renting count
prediction using the Bike Rental Sharing Data Set.
The analyzing outcome shows find that random forest
model improves the predicting result and its mean
square value,
and cross validation error best
compared to backward stepwise selection regression,
ridge regression, lasso,bagging, and boosting. This
leads to the conclusion that the random forest model
can be seen as a useful tool to predict bike demand.
From the result variance importance analysis, it can
infer that the most influential factors of bike rental
demand are temperature, humidity, and wind speed.
This conclusion can contribute to bike system
operation to predict the bike using demand more
accurately and determine the redistribution of bikes
more precisely.
REFERENCES
J. C. García-Palomares, J. Gutiérrez, and M. Latorre,
“Optimizing the location of stations in bike-sharing
programs: A GIS approach,” Applied Geography, vol.
35, Jul.2012, pp. 235-246, doi:10.1016/j.apgeog.2012.
07.002.
J.Schuijbroek, R. C. Hampshire and W. J. Van Hoeve,
“Inventory rebalancing and vehicle routing in bike
sharing systems,” European Journal of Operational
Research, vol. 257, Jun. 2016, pp. 992 – 1004,
doi:10.1016/j.ejor.2016.08.029.
Z. Zheng, Y. Zhou, L. Sun, “A Multiple Factor Bike Usage
Prediction Model in Bike-Sharing System,” In: Li, S.
(eds) Green, Pervasive, and Cloud Computing GPC
2018. Lecture Notes in Computer Science, vol 11204,
2019.
C. Wirtgen, M. Kowald, J. Luderschmidt, H. Hünemohr,
“Multivariate demand forecasting for rental bike
systems based on an unobserved component model,”
Electronics, vol. 11, Dec. 2022, pp. 4146,
2022,doi:10.3390/electronics11244146.
C.Thirumalai, and R. Koppuravuri, “Bike sharing
prediction using deep neural networks,” JOIV:
International Journal on Informatics Visualization, vol.
1, 2017, pp. 83-87,doi:10.30630/joiv.1.3.30.
V. A. Alencar, L. R.Pessamilio, F. Rooke, H. S. Bernardino,
and A. Borges Vieira, “Forecasting the carsharing
service demand using uni and multivariable models,”
Journal of Internet Services and Applications, vol. 12,
Dec. 2021, pp. 1-20,doi:10.1186/s13174-021-00137-8.
S. Ruffieux, N. Spycher, E. Mugellini and O. A. Khaled,
"Real-time usage forecasting for bike-sharing systems:
A study on random forest and convolutional neural
network applicability," 2017 Intelligent Systems
Conference (IntelliSys), London, UK, 2017, pp. 622-
631, doi: 10.1109/IntelliSys.2017.8324359.
R. Salih-Elamin, and H. Al-Deek, “Short-term prediction
for bike share systems' travel time under the effects of
weather conditions,” Advances in transportation
studies, vol. 50. Apr. 2020, pp. 81-94, doi:10.4399/
97888255317326.
S. Li, “A Decision Model for Bike Sharing Based on Big
Data Analysis,” Journal Européen des Systèmes
Automatisés, vol. 53, Apr. 2020,pp 283-288,
doi:10.18280/jesa.530216.
H. Fanaee-T, and J. Gama, “Event labeling combining
ensemble detectors and background knowledge,”
Progress in Artificial Intelligence, vol. 2, Jun. 2014, pp.
113-127,doi:10.1007/s13748-013-0040-3.
S. VE, and Y Cho, Y. “A rule-based model for Seoul Bike
sharing demand prediction using weather data,”
European Journal of Remote Sensing, vol. 53, Jun2020,
pp. 166-183, doi:10.1080/22797254.2020.1725789.
G. James, D. Witten, T. Hastie and R. Tibshirani. An
introduction to statistical learning. New York: Springer,
vol. 112, 2011, pp. 18.
Regression Models for Bike Rental Prediction Based on External Factors
41
