
The Prediction and Analysis of Hyper-Parameter for Stock Market
Prediction Based on GRU
Ziyi Jia
College of Information Science and Engineering, China University of Petroleum (Beijing), Beijing, China
Keywords: Stock Market Prediction, GRU Model, Exploratory Data Analysis.
Abstract: Stock market prediction has a crucial place in investment, risk management, and economic policy. Recently,
the rise of deep learning has led to the use of advanced techniques such as neural networks, which have
significantly improved the accuracy of stock market predictions and the ability to process complex data. In
this research, the gated recurrent unit (GRU) model is constructed in-house for data analysis and mathematical
modeling. Meanwhile, feature selection and loss functions are introduced to optimize the model. In addition,
the results of the model's predictions are visualized against real data, which helps to evaluate and improve the
performance. Simultaneously, this study delved into the application of evaluation metrics through exploratory
data analysis. Experimental results indicate that the model exhibits strong performance in the field of stock
market prediction. The utilization of GRU models in stock price prediction holds significant implications for
individuals, businesses, and financial institutions, as they provide critical market outlooks that support
financial and economic decision-making across multiple domains, improve forecasting accuracy compared to
traditional methods, and help all parties to better address market challenges and opportunities.
1 INTRODUCTION
Financial markets affect a wide range of sectors and
have a significant impact on the overall economy.
Stock prices occupy a key position in the financial
sector, reflecting company valuations and market
sentiment. Their price volatility directly affects
investment, corporate finance, and the stability of
financial markets, with far-reaching implications for
the global economy. Therefore, investors and
researchers have been exploring the patterns of stock
price behavior. However, the complexity and multiple
uncertainties of the stock market make stock price
analysis challenging (Abu-Mostafa and Atiya 1996).
For this reason, it is necessary to propose an effective
model for analyzing historical data and making
accurate predictions.
In the early days when there was a lack of
automated technical support, financial practitioners
mainly relied on traditional financial theories and
analytical methods to predict short-term fluctuations
in stock prices by focusing on market sentiment, news
announcements, and other relevant factors, and
manually analyzing historical data. These analytical
methods are mainly based on statistical and
mathematical principles, usually using linear models
(Box et al 2015). However, facing the complexity of
the market, traditional methods have limitations in
accurately predicting stock prices.
In recent years, the potential of machine learning
in forecasting has been extensively investigated in the
financial market as computational power has
increased and data storage costs have decreased
(Singh et al 2019). In the field of financial market
analysis, traditional forecasting methods such as
single decision trees, Bayesian methods, and
discriminant analysis have been gradually replaced by
superior-performing algorithms. Besides , the
nonlinearity, data-driven nature, and possession of
seamless generalization capabilities have made deep
artificial neural networks (ANNs) a mainstream tool
(Zhong and Davi 2017). However, due to the
constraints of ANN itself, a new generation of neural
network models such as Deep Neural Networks (DNN)
and Convolutional Neural Networks (CNN) have been
proposed by researchers. Xu et al. effectively derived
crucial stock market features from stock market
returns using CNN techniques, subsequently
employing these features to forecast stock market
trends (Xu et al 2018). Nonetheless, the outcomes fell
short of complete satisfaction. Subsequently, when
handling time series data, Recurrent Neural Networks
Jia, Z.
The Prediction and Analysis of Hyper-Parameter for Stock Market Prediction Based on GRU.
DOI: 10.5220/0012798900003885
Paper published under CC license (CC BY-NC-ND 4.0)
In Proceedings of the 1st International Conference on Data Analysis and Machine Learning (DAML 2023), pages 75-80
ISBN: 978-989-758-705-4
Proceedings Copyright © 2024 by SCITEPRESS – Science and Technology Publications, Lda.
75

(RNN) emerged as a viable choice, albeit still
grappling with the issue of vanishing gradients. To
address this challenge, researchers introduced Long
Short-Term Memory (LSTM) networks, tailored
specifically for processing extended sequences
(Hochreiter and Schmidhuber 1997). A Long Short-
Term Memory Network (LSTM) model was
employed for predicting the trend of the Chinese
Shanghai and Shenzhen stock markets and was
successfully carried out by Chen et al (Chen et al 2015,
Li et al 2017 & Cho et al 2014). introduced additional
metrics, including variables related to investor
sentiment, when applying an LSTM model to predict
the performance of the CSI 1300 index. The results
show that the prediction accuracy of the model is
improved, which provides a new idea to improve the
traditional performance of LSTM.
To enhance the modeling and forecasting
capabilities of time series data and address time series
problems more effectively, the GRU model was
introduced and designed (Tesla Stock Data 2023).
Built upon the foundation of LSTM, GRU streamlines
the architecture, resulting in a reduction in parameters
and improved computational efficiency. The extensive
adoption of this model serves as evidence of its
outstanding performance.
The central objective of this paper revolves around
constructing an accurate and efficient model to predict
Tesla's stock price using GRU. To elaborate further,
first, historical stock price data are collected and
processed. Second, the GRU model is constructed and
trained on selected datasets, multiple evaluation
metrics are introduced in this study to improve the
model performance. Finally, the trained model is
subjected to stock market prediction and comparative
analysis by the researchers. The experimental results
clearly show that the model exhibits significant
performance advantages in stock price trend
prediction. This improvement is attributed to the GRU
model's ability to efficiently capture complex
correlations in time-series data, which improves the
accuracy and robustness of stock price forecasting.
This research is relevant and is expected to provide
more accurate stock price prediction tools to help
investors make informed decisions and reduce risks,
thereby stabilizing the financial market.
2 METHODOLOGY
2.1 Dataset Description and
Preprocessing
The Tesla stock market dataset (Tesla Stock Data
2023) from Kaggle contains 8813 data points with 7
variables (excluding the first ordinal feature). The
dataset consists of three parts. The first is a variable
named trading date: 1823 days of historical data from
20160 to 2021 are used. In the upcoming part,
attention will be focused on datasets containing stock
price details, encompassing Min, High, Opening, and
Closing prices, with all data consistently recorded on
the same day. The third stage involves two key
indicators in the stock market: the adjusted closing
price, which is usually used for the stock price after
taking into account factors such as dividends, stock
splits, and so on, and the day's trading volume, which
is the total turnover of the stock during the day.
Segmentation of the dataset is required to ensure
that having a separate dataset adequately evaluates
model performance when training and validating the
model. Specifically, to be more precise, the initial
dataset undergoes a division into two parts,
approximately 60% of the data is designated for
training purposes, leaving about 40% for testing. It is
worth noting that since each feature may have an
impact on the classification, there is no need to remove
any irrelevant data, which allows the model to learn
and make predictions taking all information into
account. Column names are renamed for ease of
subsequent code writing and reading: they are
uniformly changed to lowercase letters and column
names. The date field is normalized and converted to
date format and is Checked to delete the missing
values. This information is useful for data quality
assessment and data preprocessing.
2.2 Proposed Approach
This study aims to construct a stable, reliable, and
efficient forecasting model with the help of the GRU
model, which can be used to assist investors and
financial practitioners to better understand and
accurately predict stock market price movements.
Following the process in Fig. 1, first, historical stock
market price data are collected and preprocessed.
Second, the GRU model is constructed and the model
is trained using the training dataset. To streamline the
model architecture and mitigate the risk of overfitting,
the initial optimization approach is to restrict the
model's depth. Limiting the depth improves the
generalization ability. Or, using regularization
DAML 2023 - International Conference on Data Analysis and Machine Learning
76
techniques, the parameters of the model are penalized
so that they are not too extreme, thus reducing
overfitting. Meanwhile, the GRU model's feature
selection method determines which historical price
features are most critical to predictive performance.
The features with the highest scores are selected for
further model simplification. After the model training
was completed, the Mean Absolute Error (MAE),
Root Mean Square Error (RMSE), and Mean Gamma
Deviation Regression Loss (MGD) metrics were
employed to comprehensively assess the model's
predictive performance, stability, and discriminative
power. Mean Square Error (MSE) as well as
Regression Variance Score, Regression R2 Score, and
Mean Poisson Bias Regression Loss (MPD) were also
used as reference data.
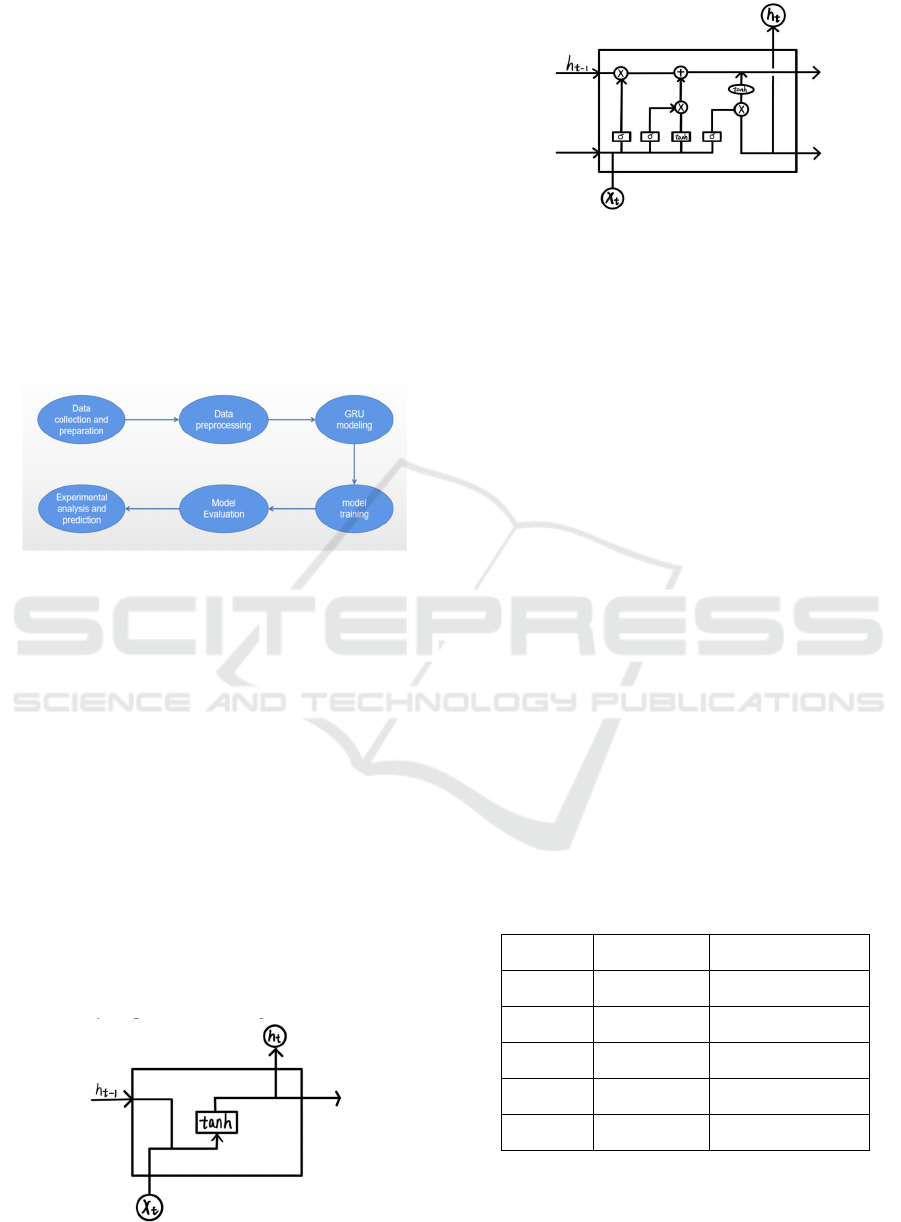
Figure 1: Flowchart Process (Picture credit: Original).
2.2.1 RNN and LSTM
RNN and LSTM are two neural network models used
to process sequential data. RNN employs a recurrent
mindset with the core concept of sharing weights and
state information when processing sequential data, as
shown in Fig. 2. Although RNN performs well on
certain sequential tasks, it has an important drawback,
the gradient vanishing problem, which leads to
limited performance when processing long sequences
or tasks that require capturing long-term
dependencies. LSTM is developed on the basis of
RNN, which introduces three important gating
mechanisms, namely the forgetting gate, input gate,
and output gate. Fig. 3 illustrates its main structure.
These gating mechanisms enable LSTM to better
capture long-term dependencies and thus perform
well in many sequence modeling tasks.
Figure 2: The structure of RNN (Picture credit: Original).
Figure 3: The structure of the LSTM (Picture credit:
Original).
2.2.2 GRU
GRU is also a deep learning model for processing
sequence data. It not only solves the gradient
vanishing problem of RNN, but also has a simpler
structure and fewer parameters than LSTM, and thus
is easier to train and deploy under resource
constraints. The core principle of GRU aims to
achieve effective control of information flow and
relies on gating mechanisms to do so. There are two
key gating mechanisms and two state components
incorporated in GRU. The role of these gating
mechanisms is to manage the flow of information in
recurrent neural networks in order to better capture
long-term and short-term dependencies in sequential
data and to overcome the gradient vanishing problem.
Specifically, the update gate decides to keep or forget
the previous information, the reset gate adapts to the
new input, and finally, the long and short-term
dependencies are captured by the candidate's hidden
state and the final hidden state.
The structure of the GRU model is shown in Table
1. It has a total of three layers in its structure,
containing is labeled parameterized grue layer, a
culling layer, and a perceptual layer.
Table 1: The Structure of the Gru Proposed in This Paper.
Layer Param # Output Shape
GRU_1 3360 None, 15, 32
GRU_2 6336 None, 15, 32
GRU_3 6336 None, 32
DROUP 0 None, 32
DENSE 33 None, 1
2.3 Implementation Details
The study uses the Kaggle, Colab platform and
The Prediction and Analysis of Hyper-Parameter for Stock Market Prediction Based on GRU
77
employs Python's Pandas library to read stock price
data and TensorFlow's Keras library to construct GRU
models. This study is conducted on a computer
running Windows 10 operating system. The model
contains 3 GRU layers with a number of 32 neurons,
a Dropout layer for preventing overfitting, and a
Dense layer for outputting the predicted values. The
loss function of the model is chosen to be MSE and
the optimizer is chosen to be Adam. The model has
been trained up to 200 times on the training set, this
process is designed to continually improve and
enhance the model's performance and ensure that it
learns and adapts adequately on the training set. The
validation set primarily serves to gauge how well the
model can apply its knowledge as it undergoes
training.
3 RESULTS AND DISCUSSION
After analysis, optimization, and evaluation, the GRU
model performance is fully understood and optimized.
The experimental analysis and model prediction
process consists of five key steps: model creation,
dataset partitioning, model training, result comparison,
and experimental prediction, which are as follows:
firstly, the architecture of the neural network model is
created, followed by training the initial GRU model
using the training dataset. Secondly, the mean square
error loss function, as depicted in Fig. 4, is employed
to assess the influence of variations in model depth on
both training and testing accuracy, thus serving as an
evaluation of overfitting. Next, the model's prediction
results will be used to compare with the actual data for
visualization and to make the comparison more
intuitive and clear, as shown in Fig. 5. Ultimately, the
essential preparations have been completed to enable
the GRU model to effectively forecast the stock price
for the upcoming 30 days, and after the successful
prediction of the results, it is necessary to compare the
results with the actual data of the past 15 days as
shown in Fig. 6, so that the researcher can evaluate the
accuracy of the model's prediction.
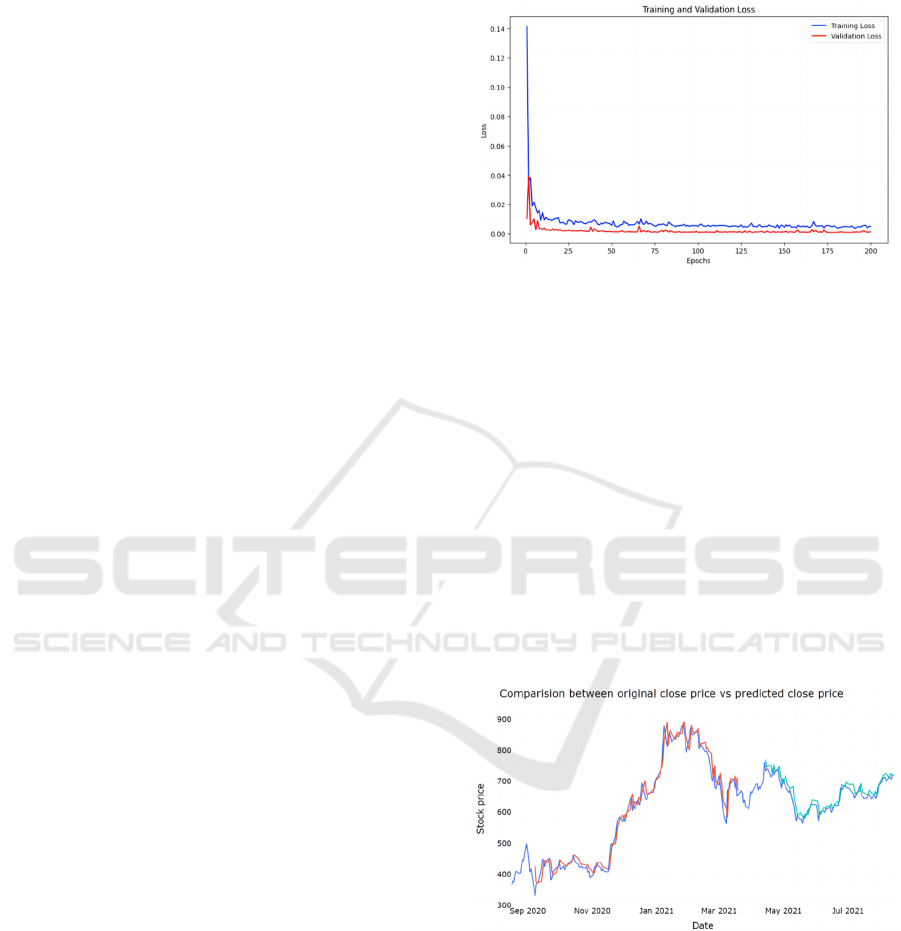
3.1 The Effectiveness of The Model
Fig. 4 presents the loss curves of the GRU model
during the training and validation phases, where the
loss is defined in the form of the MSE. The
observation of these loss values helps us to understand
the progress of the model during the training process,
as well as to assess the presence of overfitting or
underfitting problems. Additionally, the performance
metrics logged during training are employed to offer a
comprehensive evaluation of the model's performance.
Figure 4: Loss trajectory of the model (Picture credit:
Original).
3.2 Confusion Matrix Analysis
In order to gain more insight into the performance of
the GRU model and to make accurate predictions,
Comparisons will be made between the predictions on
the training and test sets and the actual data using the
original stock closing prices of the past year as a
benchmark. Obviously, by visualizing Fig. 5 and
observing the trend and movement of these three lines,
it can be seen that the prediction results are very much
in line with the original closing prices without any
significant deviation or error. This implies that the
model can make precise forecasts of future stock price
fluctuations.
Figure 5: The prediction result of the model (Blue: original
close price, Red: train predicted close price, Green: test
predicted close price) (Picture credit: Original).
DAML 2023 - International Conference on Data Analysis and Machine Learning
78
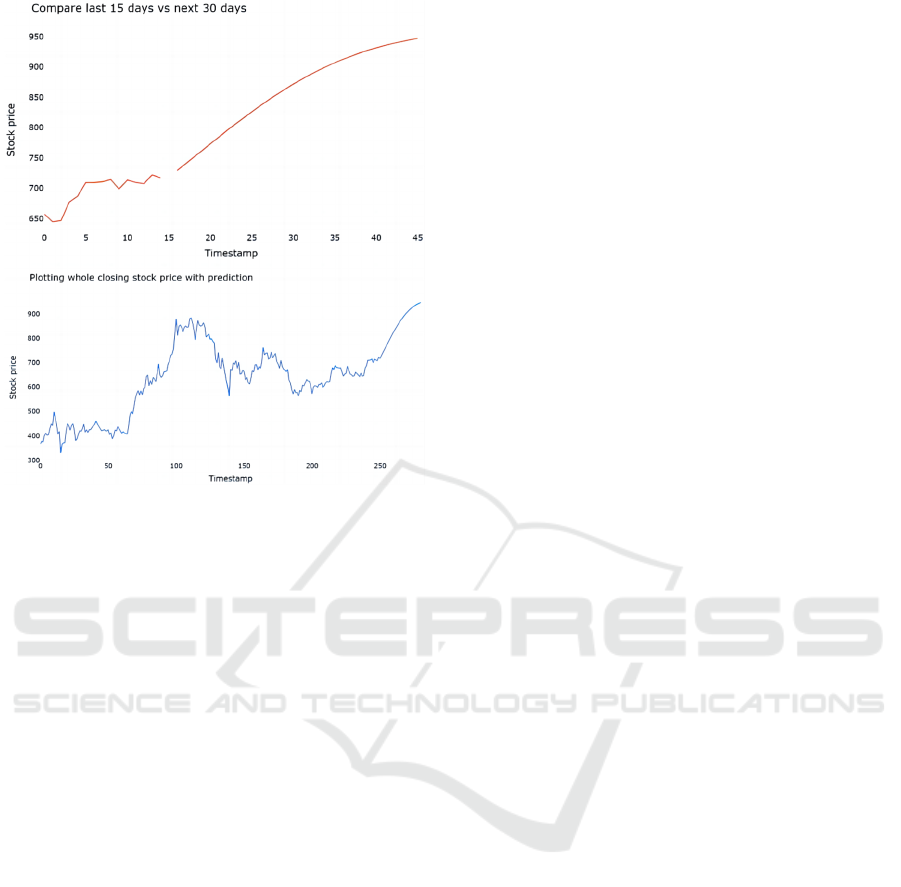
Figure 6: Forecast stock price for the next 30 days (Picture
credit: Original).
As depicted in Fig. 6, a GRU model trained by this
study will be used to predict the stock price for the
upcoming 30 days. This prediction will then be
juxtaposed with the actual stock price data from 15
days prior, and finally, the model's predictions will be
merged with the stock price data to gain deeper
insights into the historical stock price trends, evaluate
the model's predictive performance, and comprehend
the dynamics of the stock price.
3.3 The Comparisons of Performance
In the subsequent investigation, two critical factors
were examined: the iteration count and the
partitioning of the training and test sets. The findings
indicate a significant correlation between the
performance of the GRU model and the
aforementioned factors. This relationship arises
because the model's convergence speed and stability
exhibit unpredictable fluctuations with varying
iteration counts. In other words, increasing the training
session count may enhance performance, but it also
carries the risk of causing model overfitting. Also, a
large training set helps to learn the data features, but
making the test set too small makes it difficult to
accurately assess the generalization ability, and a
small training set may lead to underfitting, thus the
need to balance the influencing factors. These
experiments provide important insights into
optimizing the performance of GRU models, which
can help in more accurate analysis of stock market
forecasting.
4 CONCLUSION
Overall, to achieve more efficient and accurate stock
market price prediction, this study uses a self-built
GRU to analyze, model, and optimize the Tesla stock
market dataset, and to understand and optimize the
performance of this model through loss function
curves and prediction deviation curves. This approach
is expected to bring more powerful tools and insights
to the field of stock market forecasting, as the GRU
model itself has important features such as time series
data capturing capability, and fewer model parameters
while maintaining model interpretability. In this study,
by conducting extensive experiments and exploratory
data analysis using multiple assessment methods
rather than a single metric to ensure a more
comprehensive and multidimensional assessment of
the model. Curve plots are used to visualize the model
training process and model prediction to explore and
evaluate the model performance more explicitly. Two
factors that have a critical impact on the model
performance were later identified through subsequent
experiments with varying parameters. In addition,
future research could focus on discovering other
important factors affecting model performance and
developing strategies to enhance them, which would
help to reconstruct the model to improve the ability to
accurately predict stock prices to meet the increasingly
complex stock market environment and investor needs.
REFERENCES
Y. S. Abu-Mostafa, A. F. Atiya, “Introduction to financial
forecasting,” Appl Intell, vol. 6, 1996, pp. 205–213
G. E. P. Box, G. M. Jenkins, G. C. Reinsel, et al, “Time
series analysis: forecasting and control,” John Wiley
& Sons, 2015
S. Singh, T. K. Madan, J. Kumar and A. K. Singh, “Stock
Market Forecasting using Machine Learning: Today
and Tomorrow,” 2019 2nd International Conference
on Intelligent Computing, Instrumentation and
Control Technologies (ICICICT), Kannur, India, vol.
2019, pp. 738-745
X. Zhong, and E. Davi, “Forecasting daily stock market
return using dimensionality reduction,” Expert Syst.
Appl, vol. 67, 2017, pp. 126-139
B. Xu, D. Zhang, S. Zhang, H. Li, H. Lin, “Stock Market
Trend Prediction Using Recurrent Convolutional
Neural Networks,” Lecture Notes in Computer
Science, vol. 11109, 2018, pp. 166-177
The Prediction and Analysis of Hyper-Parameter for Stock Market Prediction Based on GRU
79

S. Hochreiter and J. Schmidhuber, “Long Short-Term
Memory,” in Neural Computation, vol. 9, 1997, pp.
1735-1780
K. Chen, et al, “A LSTM-based method for stock returns
prediction: A case study of China stock market,” 2015
IEEE International Conference on Big Data (Big
Data), vol. 2015, pp. 2823-2824
J. Li, H. Bu, and J. Wu, “Sentiment-aware stock market
prediction: A deep learning method,” 2017
International Conference on Service Systems and
Service Management, Dalian, vol. 2017, pp. 1-6
K. Cho, B. Van, C. Gulcehre, “Learning phrase
representations using RNN encoder-decoder for
statistical machine translation,” In Conference on
Empirical Methods in Natural Language Processing,
arXiv. 2014, unpublished.
Tesla Stock Data 2016-2021 Homepage,
https://www.kaggle.com/code/ysthehurricane/tesla-
stock-price-prediction-using-gru-tutorial, last
accessed 2023/09/06
DAML 2023 - International Conference on Data Analysis and Machine Learning
80
