
Modelling Drag Forces on a Wheelchair Racing Simulator
Ateayeh Bayat
1,3
and Félix Chénier
1,2,3
1
Department of Systems Engineering, École de Technologie Supérieure (ÉTS), Montreal, Canada
2
Department of Physical Activity Sciences, Université du Québec à Montréal (UQAM), Canada
3
Centre for Interdisciplinary Research in Rehabilitation of Greater Montreal (CRIR), Canada
Keywords: Racing Wheelchair, Simulator, Dynamic Model, Drag Force.
Abstract: A racing wheelchair simulator is a stationary device that allows para-athletes to train inside, in different
simulated conditions (e.g., rolling resistance, wind). Apart from improving performance during training
sessions, it also allows researchers to study the biomechanics of the propulsion in a laboratory, which is
important because wheelchair racing can cause musculoskeletal disorders and pain in athletes. For these
reasons, the realism of these simulators is paramount, and having a model that reproduces a non-linear
relationship between drag force, wheeling speed and wind speed is one of the criteria for achieving this
realism. In this work, we develop and characterize such a model through empirical data recorded on a racing
track, and then implement it on a racing wheelchair simulator with a haptic controller. Propelling on this
simulator proved to be somewhat less challenging than real-life conditions, with a measured resistance force
approximately 5 N lower than during real propulsion conditions. However, the resistance expectedly
increased as simulated face wind increased. These results show a promising avenue for racing wheelchair
athletes, both for training and assessing/correcting their biomechanics.
1 INTRODUCTION
Wheelchair sports have gained recognition for their
positive impact on enhancing power, improving
quality of life, increasing social participation, and
reducing medical complications (Slater & Meade,
2004). However, a notable percentage of individuals
who rely on manual wheelchairs for daily mobility,
ranging from 30% to 73%, experience
musculoskeletal disorders (MSDs) and shoulder or
wrist pain due to repetitive loading during
propulsion (Boninger et al., 2002; Finley & Rodgers,
2004). The risk of developing MSDs is even higher
in wheelchair sports compared to regular wheelchair
use, as the shoulder endures increased strain (Finley
& Rodgers, 2004; Slater & Meade, 2004).
Preserving musculoskeletal integrity is crucial for
manual wheelchair users to maintain an active
lifestyle, underscoring the importance of targeted
sports training to mitigate the elevated risk of MSDs.
In comparison to other wheelchair sports such as
basketball, tennis, or cycling, wheelchair racing is
associated with a higher incidence of injuries
(Roussot, 2014; Taylor & Williams, 1995). Thus,
monitoring propulsion and studying its
biomechanics holds significant importance in
improving users’ health. However, due to the limited
availability of measuring instruments, the
biomechanics of wheelchair racing remain
understudied. To overcome the challenges of
measuring and controlling various propulsion
parameters in real-world settings, the use of in-
laboratory devices, called simulators, becomes
essential. These devices simulate wheelchair
propulsion in a controlled and safe environment,
enabling the measurement of different propulsion-
related parameters and facilitating proper and safe
propulsion training for users (Arlati et al., 2020;
MacGillivray et al., 2020).
To ensure that research findings apply to real-life
conditions, laboratory experiments must employ
instruments that accurately replicate realistic
dynamics (Vanlandewijck et al., 2001). In the case of
stationary devices, it is crucial to model the non-
linear relationship between wheelchair speed and
resistance force. In wheelchair racing, this force
comprises two primary components: 1) a constant
and viscous component influenced by factors such as
track hardness, tire pressure, wheel size, and the
normal force exerted on the ground; and 2) a
Bayat, A. and Chénier, F.
Modelling Drag Forces on a Wheelchair Racing Simulator.
DOI: 10.5220/0012223300003587
In Proceedings of the 11th International Conference on Spor t Sciences Research and Technology Support (icSPORTS 2023), pages 187-193
ISBN: 978-989-758-673-6; ISSN: 2184-3201
Copyright © 2023 by SCITEPRESS – Science and Technology Publications, Lda. Under CC license (CC BY-NC-ND 4.0)
187

component that is proportional to the square of the
wheelchair velocity relative to the air, considering
factors such as athlete’s body position, aerodynamic
profile, and air density (Barbosa et al., 2016; van der
Woude et al., 2001). However, stationary devices on
the market (e.g. Invacare Corp., Revolution Sports
Inc.), employ mechanical rollers to support the rear
wheels of racing wheelchairs and fail to replicate the
intricate non-linear relationship between wheelchair
speed, rolling resistance, and air resistance.
To address these challenges, we first modelled
the relationship between total drag force and
airspeed using empirical data, in order to accurately
model propulsion on a stationary simulator with
greater realism. Then, building upon the previous
work of Chénier et al. (2014), we developed a
wheelchair racing simulator that aims to accurately
reproduce this non-linear resistance force, so that
our system provides users with realistic feedback
during propulsion, enhancing the overall simulation
experience. The aim of this communication is to
present our methodological development and
compare the propulsion forces between real and
simulated conditions.
2 METHODS
This study is composed of two phases. In the first
phase, the equation relating the total resistance force
and speed is developed and characterized using
propulsion data from two wheelchair racing athletes
on a racing track. In the second phase, this equation
is implemented on the simulator and the ability of
the simulator to reproduce this equation is tested
with a wheelchair racing athlete.
2.1 Phase 1. Racing Wheelchair
Dynamic Equations
The simulator needs a dynamic model of the racing
wheelchair to be implemented on it. This model is
expressed by:
𝐹
p
ro
p
ulsion
𝐹
dra
g
𝑚𝑎
(1)
where 𝐹
propulsion
is the resulting linear force from
the propulsive moments applied by the user on the
pushrims that moves the wheelchair forward; 𝐹
drag
is
the force applied by the environment on the
wheelchair/athlete to prevent its movement; 𝑚 is the
mass of the wheelchair/athlete, and 𝑎 is the
wheelchair acceleration. The drag force is modelled
as:
𝐹
drag
𝜇
𝑚𝑔 𝜇
𝑚𝑔𝑣
wheelchair
𝜇
𝑣
wheelchai
r
𝑣
win
d
(2)
where 𝜇
and 𝜇
are the constant and viscous
terms of the rolling resistance, and 𝜇
is the air drag
coefficient, proportional to the square of the
difference between the wheelchair speed and the tail
wind speed.
To characterize this equation, a first experiment
took place on the Ben-Leduc 400m exterior racing
track of Marcel-Laurin Park, Montreal, CA. Two
wheelchair racing athletes were recruited for a study
on the characterization of drag forces during racing
wheelchair propulsion: 1) male, right-handed,
cerebral palsy, T34 classification; 2) female, right-
handed, double tibial amputee, T54 classification.
They gave their informed consent, and the project
was approved by the ethics committee of Université
du Québec à Montréal, #CIEREH 2022–4098. They
used their own racing wheelchair, where we replaced
one rear wheel with an instrumented racing wheel
similar to the one described in Chénier et al. (2021).
This instrumented wheel records the propulsive
forces and moments at a sampling rate of 2500 Hz.
We weighed the instrumented wheelchair and athlete
using 3 portable scales placed under each wheel.
Figure 1: Racing track setup for determining the
coefficients of the dynamic equation.
The athletes were asked to propel at different
constant speeds of 14 to 20 km/h, controlled using a
bicycle computer. The pushrim moments were
measured using the instrumented wheel, which was
synchronized to timing gates delimiting two 75m
straight line zones as pictured in Fig. 1. Four
measurements per speed were done, with the
instrumented wheel installed on both sides. The tail
wind speed 𝑣
wind
was measured continually using an
anemometer (PCE VA-20). Since 𝑚𝑎 0 at a
constant speed, the total drag resistance 𝐹
drag
was
measured using the instrumented wheel using
𝐹
drag
𝐹
propulsion
. Due to assumed symmetry,
𝐹
propulsion
2𝑀
propulsion
/𝑟
wheel
where 𝑟
wheel
is the
radius of the rear wheel. This means that the
icSPORTS 2023 - 11th International Conference on Sport Sciences Research and Technology Support
188
coefficients 𝜇
, 𝜇
and 𝜇
can be characterized by a
least square optimization using the following
equation:
2𝑀
propulsion
𝑟
wheel
𝜇
𝑚𝑔 𝜇
𝑚𝑔𝑣
wheelchair
𝜇
𝑣
wheelchai
r
𝑣
win
d
(3)
with 𝑀
propulsion
being measured by the instrumented
wheel, 𝑣
wheelchair
by the timing gates, and 𝑣
wind
by
the anemometer.
All 75-meter bouts were segmented using the
timing gates. Then, to compensate for inertial forces
due to anteroposterior body movement, only
complete propulsion cycles were processed: for each
bout, 𝑀
propulsion
was cut from the start of the first
push up to the start of the last push and was
averaged over this span.
The difference of 𝑀
propulsion
between both sides
(trials with the instrumented wheel on the left vs.
right) was 0.9 ± 3.7 Nm. There seems to be no side
bias, which suggests that 𝐹
drag
can effectively be
estimated using only one wheel. Characterizing
Eq. (3) yielded 𝜇
0.00599, 𝜇
0.000785 and
𝜇
1.0187, for a coefficient of determination of
𝑅
0.606.
2.2 Phase 2. Racing Wheelchair
Simulator
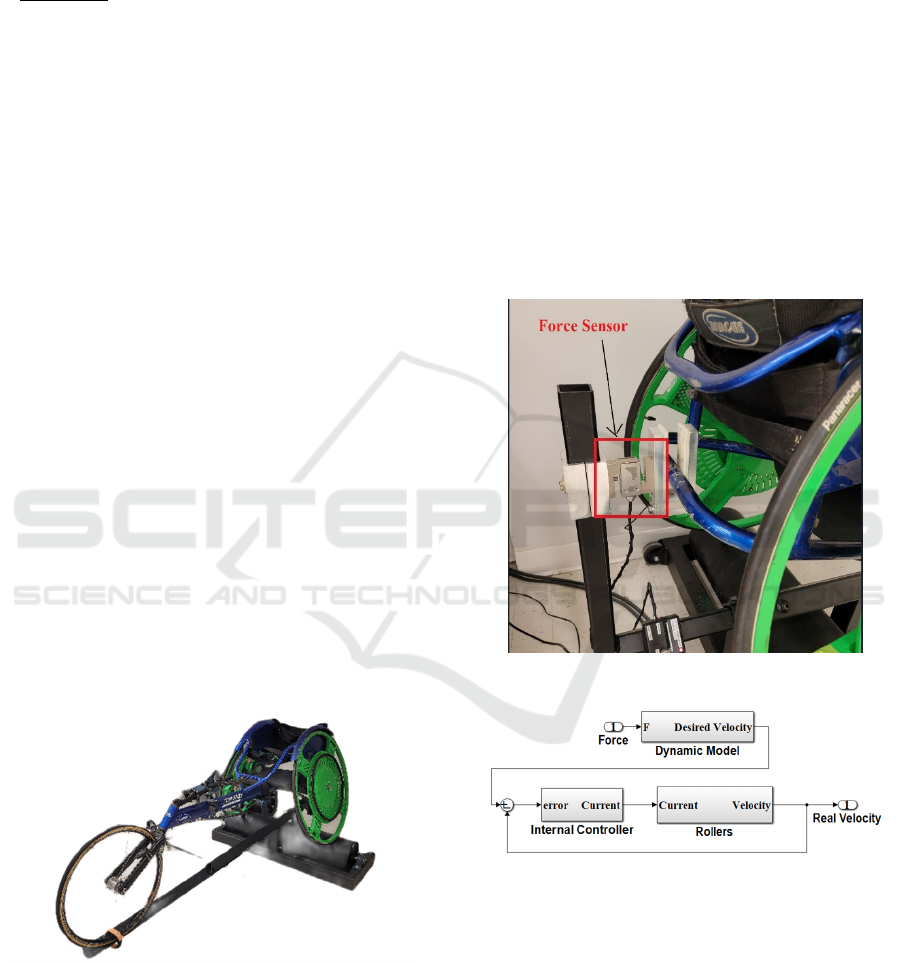
Fig. 2 shows the racing wheelchair simulator,
including both the roller and the racing wheelchair.
The wheelchair’s rear wheels sit on one roller that is
controlled by a 120-volt brushless servomotor and
drive.
Figure 2: UQAM Racing Wheelchair Simulator.
A force sensor is installed into the wheelchair
supports that hold the wheelchair in place, as seen in
Fig.3. By its location, it captures all the
anteroposterior forces between the simulator and the
wheelchair, including the inertial forces due to body
movements.
Real-time information from the force sensor is
fed to an admittance control loop using a real-time
computer (SpeedGoat). The admittance control is a
category of haptic controllers that controls the
relationship between force and speed. In this
controller, the input is the force and the controller
regulates the speed as dictated by the dynamic
equation to simulate (Cavenago et al., 2018). This
control system was chosen for the wheelchair racing
simulator as it is suited for controlling systems with
high inertia (Chenier et al., 2014; Keemink et al.,
2018). Fig. 4 shows the block diagram for an
admittance control block. Both the dynamic model
and speed controller (a proportional-integral—PI
controller) were implemented using Simulink Real-
Time on the SpeedGoat computer.
Figure 3: Force Sensor Location.
Figure 4: Block Diagram of Admittance Control.
The Simulink implementation of this simulator is
a novel modular structure where each part of the
system (e.g., force sensor input, dynamic model,
speed controller) is a separate block designed for
code reuse, and that includes its own unit test
procedure. This structure helps to easily add blocks
or iteratively enhance the system, avoiding
redesigns. It also uses predefined configuration
settings that will help researchers from other labs to
integrate this work into other wheelchair simulators,
Modelling Drag Forces on a Wheelchair Racing Simulator
189
using different versions of MATLAB/Simulink. Fig.
5 and Fig. 6 show the block diagram of the speed
controller and dynamic model respectively.
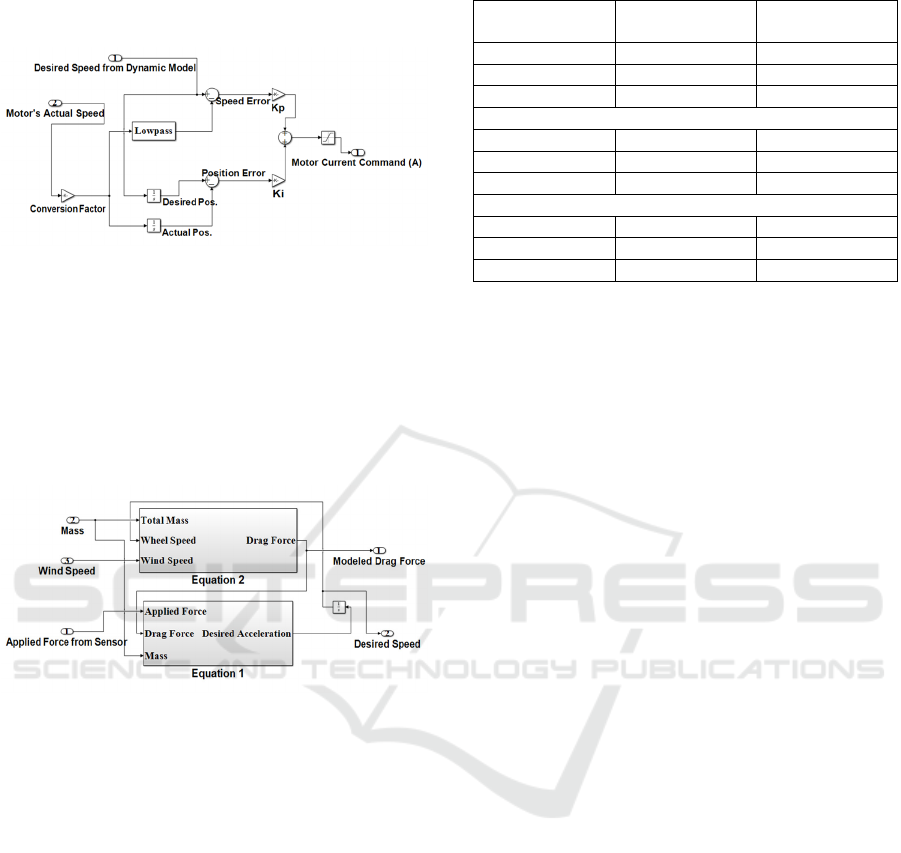
Figure 5: Block Diagram of Speed Controller.
In the speed controller (Fig. 5), the conversion
factor for the motor drive is defined based on the
radius ratio of the wheel, roller, and motor shaft.
This speed signal is then filtered by a low-pass
Bessel filter of order 2 with a cutoff frequency of
20 Hz. The gains for the PI controller were defined
based on the Ziegler method, and then modified by
trial and error, for final values of Kp = 7 and Ki = 5.
Figure 6: Block Diagram of Racing Wheelchair Dynamic
Model.
Equations 1 and 2 were implemented inside the
dynamic model (Fig. 6), which gives two outputs:
the modelled drag force is based on Eq. (2), and it
allows calculating a desired speed based on Eq. (1).
After calibrating the system (essentially
removing the force sensor offset), the simulated
parameters such as the wind speed can be sent in
real time to the simulator, allowing for the change of
the propulsion conditions inside the same propulsion
acquisition.
2.3 Experimental Test of the Racing
Simulator
Participant 2 of Phase 1 was re-invited for a test
experiment of the UQAM Racing Wheelchair
Simulator. His own racing wheelchair was affixed to
the simulator and the right wheel was replaced by
the instrumented wheel.
Table 1: Steady-state propulsion on the simulator.
Task Wheelchair
speed (km/h)
Wind speed
(m/s)
1101
2100
310-1
Rest
4121
5120
612-1
Rest
7141
8140
914-1
The athlete propelled on the simulator in three
blocks of constant speed, each segmented into three
wind speeds (no wind, 1 m/s tail wind, 1 m/s face
wind), as shown in Table 1 where a positive wind
speed value is a tail wind. He propelled for each
segment for the time equivalent to 75 m and had a
rest between blocks. Speed was controlled using a
bicycle computer.
After the propulsion, he answered a few quick
questions about his perception of the realism and
usefulness of the simulator.
2.3.1 Measured Parameters and Analysis
To verify the ability of the speed controller to match
the desired speed, we compared the desired speed to
the real speed.
Then, to verify the ability of the simulator to
match the desired drag force, we used the propulsive
moment measured by the instrumented wheel
(𝑀
propulsion
) to calculate the average measured drag
force 𝐹
drag
using the same method as in phase one.
The 𝐹
drag
(modelled) is the output of Equation 2
which was implemented in Dynamic Model Block.
For each task of Table 1, the average measured drag
force was compared to the average drag force
modelled by the simulator.
3 RESULTS
Fig. 7 presents a comparison of the desired and real
speed in m/s for a few pushes during task 5
(12 km/h, no wind) as an example. Overall, the RMS
of the error was of 0.0413 m/s for the controller.
icSPORTS 2023 - 11th International Conference on Sport Sciences Research and Technology Support
190
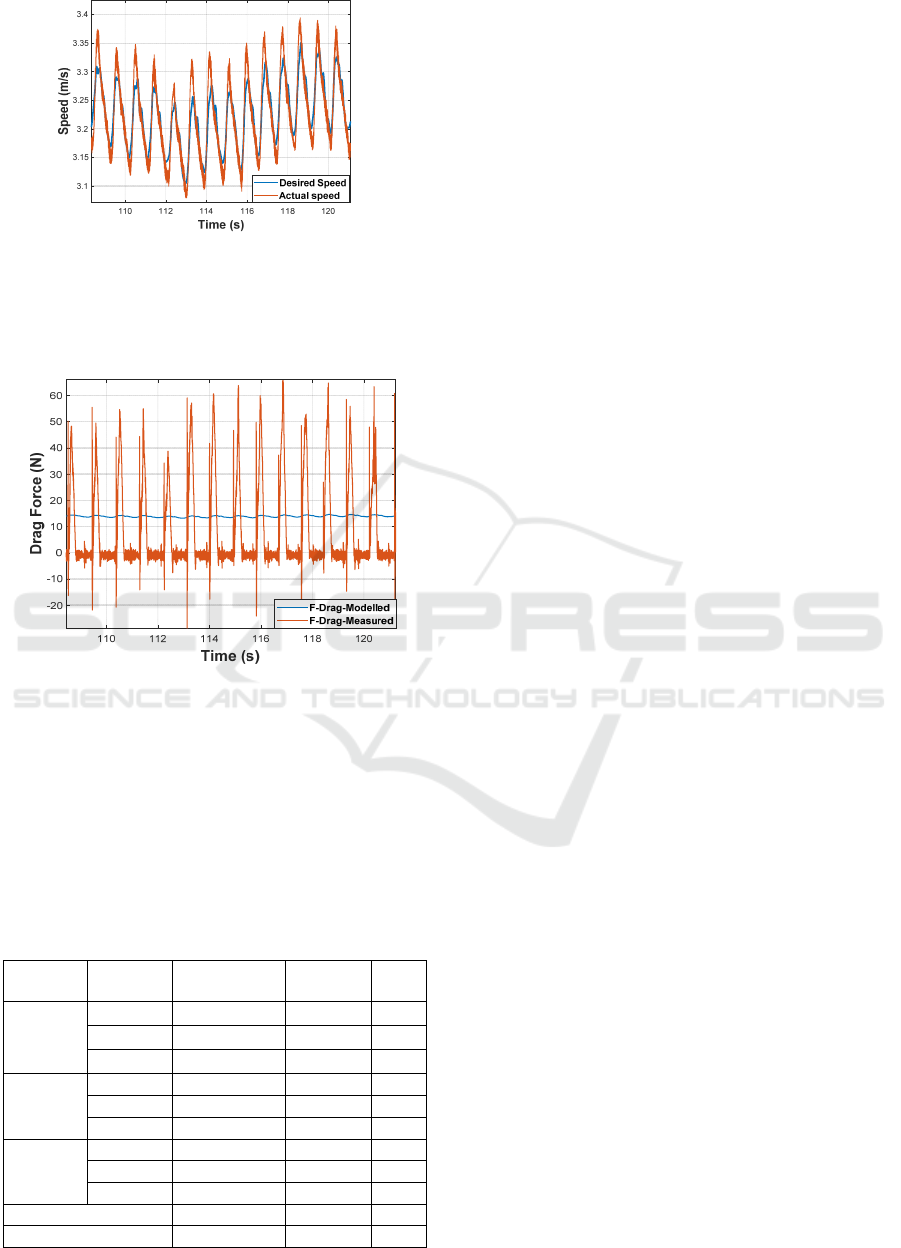
Figure 7: Desired and Real speed during a few pushes at
12 km/h block and 0 m/s wind speed segment.
Fig. 8 shows the modelled and measured drag force
during the same pushes as Fig. 7.
Figure 8: Values of modelled and measured 𝐹
drag
during a
few pushes at 12 km/h block and 0 m/s wind speed
segment.
Table 2 compares average values of modelled
and measured forces for all propulsion tasks during
the complete cycles with constant speed. As we
observe, the average value of drag force that the user
really
overcame (measured 𝐹
drag
) was lower than the
Table 2: Average values of modelled and measured drag
force in different propulsion conditions on the simulator.
W
ind spee
d
(m/s)
Avg. Model’
d
𝐹
dra
g
(N)
Avg. Meas.
𝐹
dra
g
(N)
Diff.
(N)
Block1
10 km/h
1 6.8 2.2 -4.6
0 11.5 6.9 -4.6
-1 17.7 12.6 -5.1
Block2
12 km/h
1 8.2 3.4 -4.8
0 13.8 8.1 -5.7
-1 21.2 16.2 -5.0
Block3
14 km/h
1 10.2 4.7 -5.5
0 16.7 11 -5.7
-1 23.1 20.3 -2.8
Mean 14.4 9.5 -4.9
Std. 5.7 6.1 0.9
one modelled by Eq. (2) (modelled 𝐹
drag
) by about
4.9 N, which suggests that it was easier to propel on
the simulator than in real conditions. The mean
value and standard deviation of these two forces
show that their difference is only a constant value.
4 DISCUSSION
Propelling on the simulator proved to be easier for
the athlete than intended. This discrepancy between
the modelled and measured drag forces may be
attributed to the lag in the controller’s response to
rapid changes. The controller fails to follow the
desired speed during rapid transitions, as depicted in
Fig. 7. Consequently, the wheel may accelerate
faster than it should during the first portion of the
push, resulting in a lower resistance.
This finding is particularly intriguing when we
compare this simulator with the LIO simulator
(Chenier et al., 2014) that uses a similar admittance-
based controller. However, in the LIO simulator, the
input force is measured by two instrumented wheels
instead of a force sensor at the rear of the
wheelchair. As a result of reading the external force
directly applied to the wheel, the LIO simulator’s
controller uses this information in a feed-forward
configuration to directly compensate for the
perturbation applied by the user. In contrast, the
current simulator substitutes the instrumented wheel
with a force sensor, following the configuration in
Pizzaro-Chong (2020). This modification enhances
the affordability, both in terms of cost and time, as
the athletes do not need to change their wheels for
instrumented wheels on the simulator. Furthermore,
this change facilitates the capture of all forces,
including the inertial forces due to body movement,
which may enhance the realism of the simulator
(Chenier et al., 2016). However, the drawback of
using the force sensor is that we could not
implement such a feedforward, as we do not
measure the force applied on the pushrims by the
user. Consequently, the controller could not react as
fast to these external perturbations. This is especially
important for a racing wheelchair simulator, where
the athletes apply high forces, at high speed, during
short amounts of time.
To address this limitation, we propose including
a physical inertia such as a flywheel in a future
iteration of the simulator, in addition to the
electronic inertia provided by our admittance
controller. This additional physical inertia will
compensate instantly for most of the perturbation
exerted by the user while letting the controller reach
Modelling Drag Forces on a Wheelchair Racing Simulator
191

a steady state using a similar proportional-integral
architecture.
Overall, the athlete’s perception of the
experiment was highly positive. He expressed great
satisfaction with the simulation, noting its similarity
to real conditions, where changes in wind speed
affect the sensation of resistance. From a training
aspect, the advantage of the simulator lies in
providing a controlled training environment without
the challenges faced when practising outdoors,
particularly in colder climates where exterior racing
tracks are unavailable during winter. However, the
athlete did mention a slight disparity in the
perceived amount of resistance compared to
overground conditions, which aligns with the
observations from the results.
The primary limitation of this study is the
restricted speed range in which the racing
wheelchair was evaluated. To comprehensively
assess its performance, higher speeds should be
investigated. However, due to the availability of only
one motor that lacked sufficient strength to
accommodate higher desired speeds, this objective
could not be achieved within the scope of this study.
Additionally, the participant pool was limited to a
single individual, which restricted the ability to fully
comprehend the simulator’s strengths and
weaknesses. Including a larger number of
participants would provide valuable insights in this
regard.
Future studies on the validation of this simulator
should investigate not only the drag mean force, but
other biomechanical variables such as instantaneous
force, power, and speed on both real and simulated
tracks. This comparison will establish the
simulator’s potential as a valuable tool to evaluate
the biomechanics of wheelchair racing, and
eventually as a better training tool for athletes.
5 CONCLUSION
The availability of a dependable stationary device
for racing wheelchair athletes, facilitating ecological
biomechanical measurement and training, is of
paramount importance. The simulator presented in
this work, along with the suggested dynamic model,
holds promise in serving this purpose. By adjusting
the resistance experienced by athletes according to
wind speed and their applied force, a more realistic
biomechanical assessment and training experience
can be achieved.
REFERENCES
Arlati, S., Colombo, V., Ferrigno, G., Sacchetti, R., &
Sacco, M. (2020). Virtual reality-based wheelchair
simulators: A scoping review. Assistive Technology,
32(6), 294—305. https://doi.org/10.1080/10400435.
2018.1553079
Barbosa, T. M., Forte, P., Estrela, J. E., & Coelho, E.
(2016). Analysis of the Aerodynamics by
Experimental Testing of an Elite Wheelchair Sprinter.
Procedia Engineering, 147, 2—6. https://doi.org/
10.1016/j.proeng.2016.06.180
Boninger, M. L., Souza, A. L., Cooper, R. A., Fitzgerald,
S. G., Koontz, A. M., & Fay, B. T. (2002). Propulsion
patterns and pushrim biomechanics in manual
wheelchair propulsion. Archives of Physical Medicine
and Rehabilitation, 83(5), 718–723. https://doi.org/
10.1053/apmr.2002.32455
Cavenago, F., Voli, L., & Massari, M. (2018). Adaptive
Hybrid System Framework for Unified Impedance and
Admittance Control. Journal of Intelligent & Robotic
Systems, 91(3–4), 569–581. https://doi.org/10.1007/s
10846-017-0732-1
Chenier, F., Bigras, P., & Aissaoui, R. (2014). A New
Wheelchair Ergometer Designed as an Admittance-
Controlled Haptic Robot. IEEE/ASME Transactions
on Mechatronics, 19(1), 321—328. https://doi.org/
10.1109/TMECH.2012.2235079
Chenier, F., Gagnon, D. H., Blouin, M., & Aissaoui, R.
(2016). A Simplified Upper-Body Model to Improve
the External Validity of Wheelchair Simulators.
IEEE/ASME Transactions on Mechatronics, 21(3),
1641–1649. https://doi.org/10.1109/TMECH.2016.252
7240
Chénier, F., Pelland-Leblanc, J.-P., Parrinello, A., Marquis,
E., & Rancourt, D. (2021). A high sample rate,
wireless instrumented wheel for measuring 3D
pushrim kinetics of a racing wheelchair. Medical
Engineering & Physics, 87, 30–37. https://doi.org/
10.1016/j.medengphy.2020.11.008
Finley, M. A., & Rodgers, M. M. (2004). Prevalence and
identification of shoulder pathology in athletic and
nonathletic wheelchair users with shoulder pain: A
pilot study. Journal of Rehabilitation Research and
Development, 41(3B), 395—402. https://doi.org/
10.1682/jrrd.2003.02.0022
Keemink, A. Q., van der Kooij, H., & Stienen, A. H.
(2018). Admittance control for physical human—robot
interaction. The International Journal of Robotics
Research, 37(11), 1421—1444. https://doi.org/10.117
7/0278364918768950
MacGillivray, M. K., Eng, J. J., Dean, E., & Sawatzky, B.
J. (2020). Effects of Motor Skill-Based Training on
Wheelchair Propulsion Biomechanics in Older Adults:
A Randomized Controlled Trial. Archives of Physical
Medicine and Rehabilitation, 101(1), 1–10. https://doi
.org/10.1016/j.apmr.2019.07.017
Pizarro-Chong, A. D. (2020). Development and Validation
of the Control Loops for the Haptic Interfaces of a
Standard Manual Wheelchair Simulator. 177.
icSPORTS 2023 - 11th International Conference on Sport Sciences Research and Technology Support
192

Richter, W. M., Kwarciak, A. M., Guo, L., & Turner, J. T.
(2011). Effects of Single-Variable Biofeedback on
Wheelchair Handrim Biomechanics. Archives of
Physical Medicine and Rehabilitation, 92(4), 572–
577. https://doi.org/10.1016/j.apmr.2010.11.001
Roussot, M. (2014). Upper limb injuries in athletes
participating at the London 2012 Paralympic Games
[Master Thesis, University of Cape Town].
https://open.uct.ac.za/handle/11427/13312
Slater, D., & Meade, M. A. (2004). Participation in
recreation and sports for persons with spinal cord
injury: Review and recommendations.
NeuroRehabilitation, 19(2), 121–129.
Taylor, D., & Williams, T. (1995). Sports injuries in
athletes with disabilities: Wheelchair racing.
Paraplegia, 33(5), 296—299. https://doi.org/10.1038
/sc.1995.67
van der Woude, L. H. V., Veeger, H. E. J., Dallmeijer, A.
J., Janssen, T. W. J., & Rozendaal, L. A. (2001).
Biomechanics and physiology in active manual
wheelchair propulsion. Medical Engineering & Physics,
23(10), 713–733. https://doi.org/10.1016/S 1350-
4533(01)00083-2
Vanlandewijck, Y., Theisen, D., & Daly, D. (2001).
Wheelchair Propulsion Biomechanics: Implications for
Wheelchair Sports. Sports Medicine, 31(5), 339–367.
https://doi.org/10.2165/00007256-200131050-00005
Modelling Drag Forces on a Wheelchair Racing Simulator
193
