
Exploring the Effects of Subversive Agents on Consensus-Seeking
Processes Using a Multi-Agent Simulator
Johannes S. Vorster
1 a
and Louise Leenen
1,2 b
1
Department of Computer Science, University of Western Cape, South Africa
2
CAIR, South Africa
Keywords:
Consensus, Consensus Simulation, Stochastic Simulation, Synchronization, Multi-Agent Simulation,
Subversive Agents.
Abstract:
In this paper we explore the effects of subversive agents on the effectiveness of consensus-seeking processes.
A subversive agent can try and commit industrial espionage, or, could be a disgruntled employee. The ability
of an organisation to effectively execute projects, especially projects within large and complex organisation
such as those found in large corporates, governments and military institutions, depend on team members
reaching consensus on everything from the project vision through various design phases and eventually project
implementation and realisation. What could the effect be of agents trying to subvert such a process in a way
that does not raise suspicions? Such an agent cannot openly sabotage the project, but rather tries to influence
others in a way that increases the time it takes to reach consensus, thus delaying projects in subtle ways. Here
we explore the effect such agents could have on the time and effort to reach consensus though the use of a
stochastic Multi-Agent-Simulation (MAS).
1 INTRODUCTION
Project complexity, the ability of project team mem-
bers to reach consensus on the relevant topics or mov-
ing to next phases before reaching consensus have re-
peatedly been quoted as reasons for project delays and
failure (Al-Ahmad et al., 2009; Whitney and Daniels,
2013; Kian et al., 2016; Waheeb and Andersen, 2022).
In this paper we investigate the effect that sub-
versive agents (SAs) could have on project time-
lines and work effort. Our approach uses Multi-
Agent-Simulation (MAS) wherein we model agent
behaviour and in particular the behaviour of SAs. In
the text below we use the terms team members or
members to refer to the conventional members of the
team and the term agents refer to the subversive mem-
bers of the team that has as goal to delay project de-
livery by sowing discord within the team.
We regard the delivery of a project as a series of
consensus seeking processes wherein team members
have views that are debated and discussed in meet-
ings. A particular phase of a project, say the require-
ments gathering phase, can only conclude if all par-
a
https://orcid.org/0000-0001-6452-4186
b
https://orcid.org/0000-0002-9212-550X
ticipating parties agree on particular topics. Members
of the project team reach this consensus through re-
peated discussions where opinions are shared and dis-
cussed.
SAs have two goals; firstly, to promote views and
opinions that would create more debate, thus delay-
ing the project; and secondly, to not have such radical
views that they are regarded as outliers and thus ig-
nored.
We investigate, though simulation, the effect that
a small number of SAs could have on project time-
lines. First, we define and discuss our approach to
modelling this interesting problem. Then we simulate
the behaviour of team members during consensus-
seeking discussions. We investigate the ranges of
views (using statistics) that promote faster consen-
sus and which ranges delay consensus, first theoret-
ically and then through simulation. Next, we inves-
tigate the effect of the level of subversion, from mild
to severe. Finally, we investigate the effects of a very
small number (one to four) of SAs on project delivery
if they are coordinated in their efforts.
The delivery of a project can be seen as a se-
ries of consensus-seeking processes. For example,
the project vision is discussed, reviewed, debated and
eventually agreed upon. This is a process where the
104
Vorster, J. and Leenen, L.
Exploring the Effects of Subversive Agents on Consensus-Seeking Processes Using a Multi-Agent Simulator.
DOI: 10.5220/0012123400003546
In Proceedings of the 13th International Conference on Simulation and Modeling Methodologies, Technologies and Applications (SIMULTECH 2023), pages 104-114
ISBN: 978-989-758-668-2; ISSN: 2184-2841
Copyright
c
2023 by SCITEPRESS – Science and Technology Publications, Lda. Under CC license (CC BY-NC-ND 4.0)

stakeholders gravitate towards a shared single vision,
consisting of many topics, for the project.
Next, perhaps, follows an architectural design
phase. This phase will follow a similar pattern where
initial stakeholders may have widely different views
of how the design should look to fulfil the project vi-
sion. This phase of the project concludes when all
members agree on what the architecture should look
like.
That may be followed by systems and sub-systems
design phases, again, starting with disagreements and
various opinions that, though a process of lots of
meetings, eventually settling on a position of consen-
sus between the various stakeholders.
The use of MAS and in particular the achievement
of consensus and synchronization in these systems
have seen extensive research in the past decade, as
is evidenced by the depth of research, see Bao et al.
(2022) and Yang et al. (2022) for overviews of coop-
erative control and distributed coordination of MAS.
That line of research focus on high-speed consensus
algorithms for use in UAV and autonomous vehicles
under variations of network topology, error-rates, and
cyberattacks.
Consensus in MAS is a challenging problem
which in the literature has mostly been social sci-
ences research, economical model simulations, or
MAS consensus algorithms. Social Sciences research
focussing on crowd and voter behaviour which as a
three decade deep research history starting with Dun-
bar (1998)’s ’social brain’, Stocker et al. (2001)’s so-
cial information exchange, and the formation of con-
sensus groups discussed by Leishman et al. (2008)
also see Gilbert and Gilbert (2010). On the other
hand, MAS consensus algorithmic solutions focus al-
most exclusively on high-speed applications already
mentioned, see Amirkhani and Barshooi (2022).
This work is perhaps closest to MAS in Computa-
tional Economics discussed for example in Tesfatsion
and Judd (2006) at least in terms of project synchro-
nization as an impact factor for project economics.
Chang and Harrington (2004) described a scheme
for modelling organisations using multi-agent sys-
tems (MAS) with specific focus to answer economic
questions. Later Will et al. (2019) investigated the
role of organisational structure in innovation project
selection wherein they point out the effect of organisa-
tional structure as an enabler (or blocker) of decision-
making. In particular, they describe three organisa-
tional forms (polyarchy, hierarchical and hybrids of
the two). In a polyarchy members of the team are fully
connected and allowed to talk to each other across hi-
erarchical boundaries. We use fully connected pol-
yarchies in all the simulations discussed in this paper.
For a more detailed discussion of the three hierarchies
in terms of this simulator and simulations, see Vorster
and Leenen (2023).
The study of subversive agent behaviour and im-
pact has focused on many domains ranging from psy-
chological (McDowell, 2002), business (Manky and
Dolores, 2022), political (Barnes and Prior, 2009),
and obviously espionage (Evans and Romerstein,
2012).
The study of the impact that SAs could have on
project delivery seems, to the best of our knowledge
to not have been studied before. Furthermore, our ap-
proach to study this effect through the use of models
for consensus also seems to be novel.
In our previous paper (Vorster and Leenen, 2023)
the model and simulation implementation using MAS
for the investigation of consensus-seeking processes
such as project delivery within various organisational
architectures and project delivery methodologies has
already been reported. This paper describes the ef-
fects that a subversive agent, or a group of such agents
could have on the time and effort to reach consensus
if they try and delay the achievement of consensus
by promoting views that cause more debate and thus
longer times to reach consensus.
The approach is to simulate the consensus process
by way of team members setting up meetings with
other members on topics they do not have agreement
on and through the meeting try to resolve their differ-
ences in one of three ways. Let us say members m
and n meet. Then for every topic (k) discussed, one
of three outcomes are possible: (a) m and n reach a
consensus, a middle-ground between their two views,
(b) m convinces n or (c) m is convinced by n.
Through such a process of repeated meetings,
each issue gets resolved for all members of the team
so that at the end of the process all members agree on
all topics. Only when this state of agreement has been
reached can it be said that consensus has been reached
and can that part of the project conclude.
The SAs in these simulations have two goals (a)
to increase discord within the group thus increasing
the time it takes to reach consensus, and (b) to not
be identified as subversive, which can happen if the
SAs promote radical views or consistently promote
extreme views.
Team members initially have stochastically (sta-
tistical) chosen views and through iterative meetings
resolve differences in views while the SAs will pro-
mote the views of other team members or their own
views where those views are further away from the
mean views of the group, yet, not so far away from
the current consensus view that it creates suspicions.
The document has the following section layout:
Exploring the Effects of Subversive Agents on Consensus-Seeking Processes Using a Multi-Agent Simulator
105

• Modelling Consensus, §2, introduces the concept
of consensus as a measurable quantity as well as
how topics and each member’s view on a topic is
modelled;
• Subversive Agent Behaviour, §2.1, gives an intro-
duction to subversive agent behaviour within the
group;
• Evolution of Views, §2.2, reports on the initial re-
sults of how SAs influence the consensus process
in terms of the consensus measures and the distri-
bution of views;
• Yes-agents, §2.3, discusses the effects of agents
that constantly promote the group view and the
effect they have on the time to reach consensus;
• Subversive Agent’s Impact on Project Delivery,
§3, reports on the effectiveness of SAs to delay
projects;
• Coordinated Agents, §3.1, discusses the ways in
which SAs can cooperate to delay projects within
this narrow application;
• Level of Control, §3.2, investigates the conditions
under which SAs have such control that they can
dictate the outcome of decisions;
• Group delay & control, §3.3, discusses the over-
all effect of SAs in larger groups and the critical
number of SAs to control both outcomes and de-
lays; and
• Discussion, §4, wherein a brief overall discussion
of the results and consequences from the data pre-
sented in the various sections are discussed.
Some remarks are needed on subversive agents versus
conventional disagreement on topics between peers
trying to find satisfactory solutions. In many projects
the issues are complex and people have justifiable rea-
sons for arguing positions that others may consider
unimportant. This is normal and part of finding good
solutions, the fact that there are debates imply that
topics are not simple. These debated indeed do lead
to longer times to reach consensus, but the balance
of that is that better decisions are reached, more op-
tions are considered, and more variables are investi-
gated and brought into the discussion. However, we
are using the term subversive agent to mean someone
that is pro-actively trying to find arguments, trying to
convince others of potions that they themselves do not
believe. In short, they may be disgruntled employees
or any other range of possibilities.
(a) Normal (a) Double Normal
(b) Exponential
(c) Uniform (d) Skew
Figure 1: Distributions of views on a topic can take many
forms.
2 MODELLING CONSENSUS
In our model a number of members, N, try to reach
consensus through a process of repeated meetings
wherein a number of topics are discussed. Consider
a given problem under discussion, say the project vi-
sion, or the requirements specification, or any other
aspect of the project. This problem consists of a num-
ber of topics and members of the project team will dis-
cuss these topics in a series of meetings. Each mem-
ber has a view (opinion/belief) about each topic and
as members meet, they discuss these topics and are
swayed by the presented arguments.
Let us denote two members by i and j, the spe-
cific topic they want to discuss is denoted k. Member
i has her own view of topic k, denoted by b
k
i
. Simi-
larly member j may have a different view on the same
topic, denoted b
k
j
. The mean view of all the members
on topic k are denoted
ˆ
b
k
.
The two members may differ in opinion on topic k,
and that can abstractly be denoted by u
k
i j
= |b
k
i
−b
k
j
|.
When considering these differences in views for many
members, the expected value (or mean value) for the
difference in views on topic k can be denoted ˆu
k
.
Through meetings, members will consider each
other’s views on every topic discussed. For a dis-
cussed topic there can be one of three outcomes, (a)
they reach some agreement somewhere in the mid-
dle of the two initial views; or (b) i is convinced by j,
b
k
i
←b
k
j
; or (c) i convinces j, b
k
i
→b
k
j
. After the meet-
ing, no matter which one of these options occurred,
u
k
i j
= 0, meaning they resolve their differences and
agree on what they believe to be the correct answer.
Throughout the process members meet each other
to discuss topics and this continues until all topics are
resolved. The total time it takes for all members to
reach consensus on all topics are denoted t
max
.
1
The distribution of real-life views could have
many forms depending on the topic and people in-
volved and has been found to have Normal, Uni-
form, Skew (Den Boon and Van Meurs, 1991), and
even Exponential (Lang et al., 2018) distributions, see
Figure 1. In our simulation members are initiated
1
A detailed mathematical description of this process
can be found in Vorster and Leenen (2023).
SIMULTECH 2023 - 13th International Conference on Simulation and Modeling Methodologies, Technologies and Applications
106
0
1
2
·10
5
Consensus (u)
Consensus for 20 simulations
Averaged Consensus
1-σ
Final consensus 1-σ
6
8
10
12
Consensus Entropy (S
u
)
Ln(Consensus) for 20 simulations
Ln(Consensus) averaged
1-σ
Final consensus 1-σ
0 20 40
60
80 100 120
0
1
2
3
4
5
6
7
8
9
Time (t
max
)
Count [%]
Histogram of t
max
LN (4.33, 0.0823)
N (76.2, 6.28)
0 10 20 30 40
50 60
70 80 90 100 110 120
1
2
3
4
5
6
7
8
9
Average topics discussed
per meeting
Topics per meeting (
¯
d)
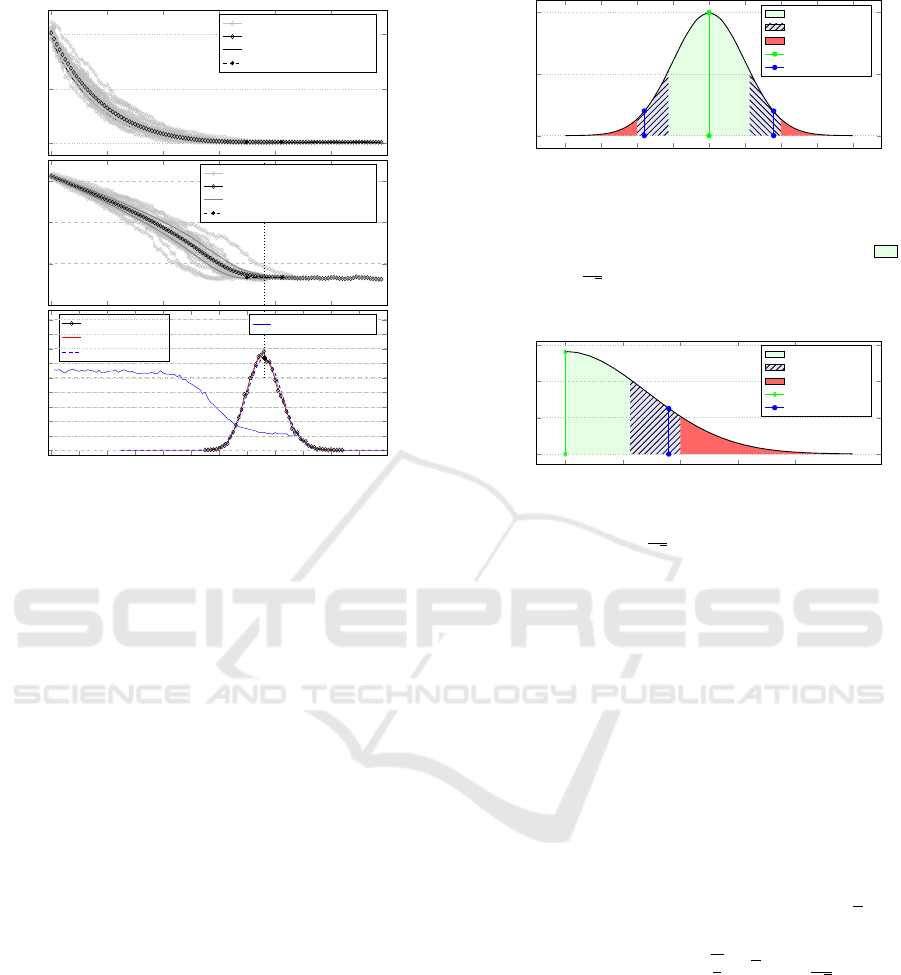
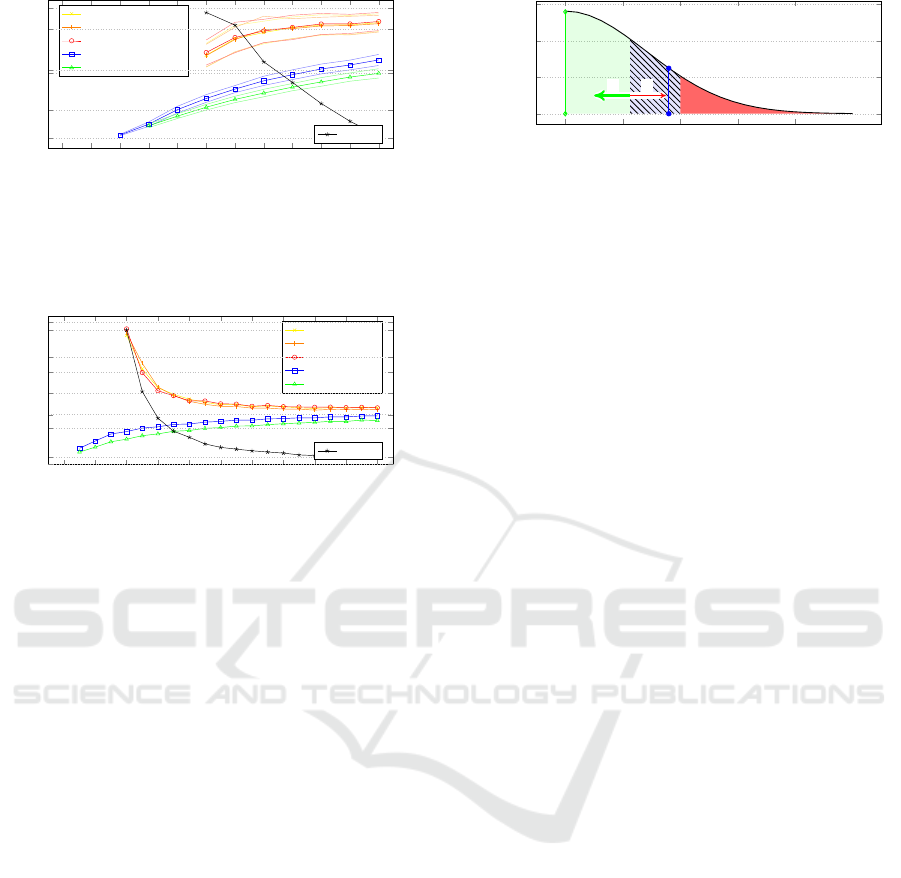
Figure 2: (Top) Various simulations of the 10-group show-
ing the consensus measure over time. (Middle) The same
data as in top graph, but now using log
e
(consensus). (Bot-
tom) Histogram of the time it takes to reach consensus over
many such runs (µ = 76.2, σ = 6.28, n=10000) and Normal
and Lognormal fits to the histogram data.
with random views from a Normal distribution, that
is b
k
i
∼ N (σ).
At any time during the simulation, the overall level
of consensus can be measured by summing over the
differences in view between all members on all topics.
If there are k
max
topics we can define
u
t
=
N
∑
i=1
N
∑
j=1
k
max
∑
k=1
u
k
i j
(1)
As example, consider Figure 2 that shows the
measurement of consensus over time for many simu-
lations of a group of a ten member group. Consensus
measure, as defined by (1), decreases exponentially
(top diagram in Figure). The same data is presented
using a log scale (middle), and the final time to reach
consensus is plotted in histogram form for many such
runs (bottom).
The average time to reach consensus was
ˆ
t
max
=
76.2 (σ = 6.28, n = 10000). This is an abstract num-
ber representing the real time it would take to resolve
the topics and could present any time measure (hours,
days) depending on the complexity of the topics. We
are not interested in the absolute times but rather in
the relative differences in times. For example, we will
shortly compare the time it takes to reach consensus
when a subversive agent is present with the time when
−4σ −3σ −2σ −1σ 0 1σ 2σ 3σ 4σ
0
0.2
0.4
a
b
Members views (b
k
i
) on topic k.
Probability
Faster consensus
Slower consensus
Radical views
Yes-agent
Subversive agents
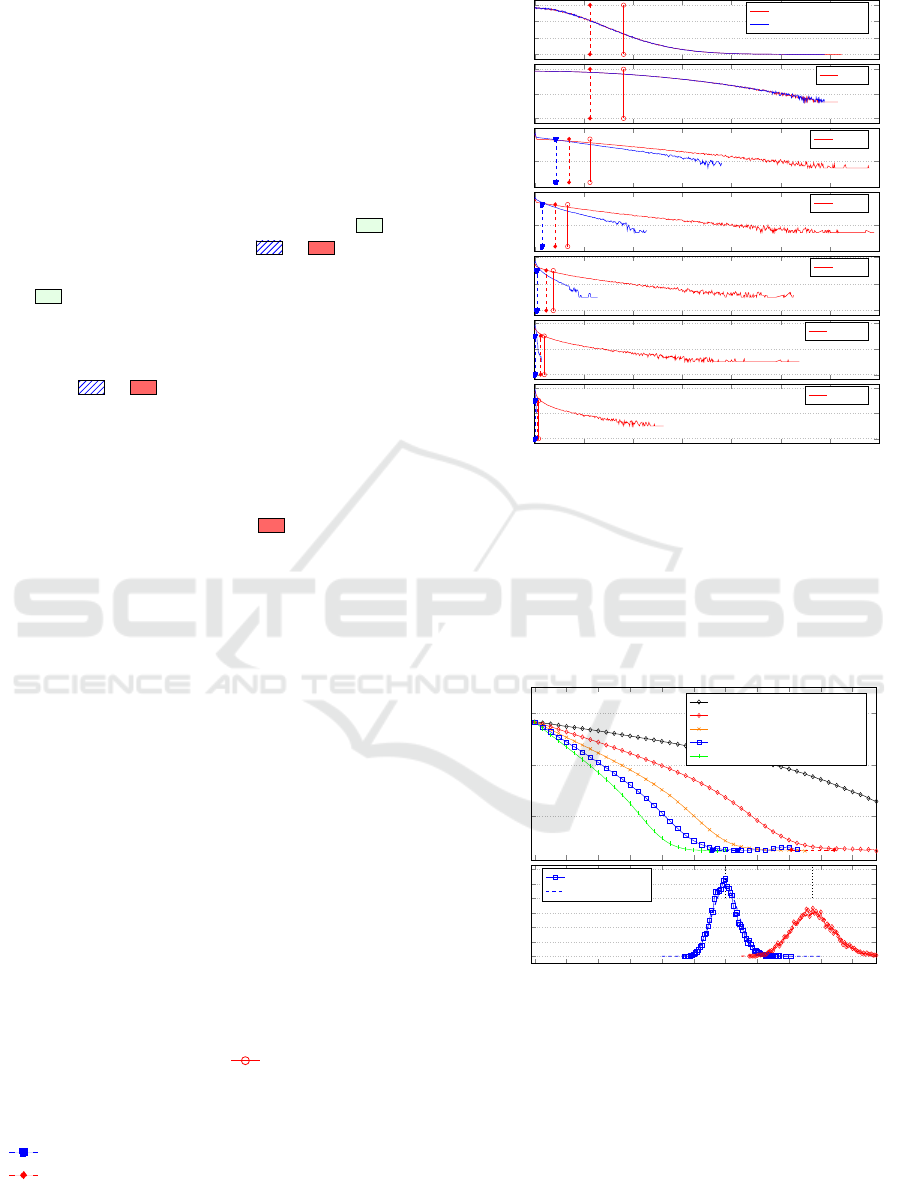
Figure 3: Distribution of views, b
k
i
∼N (σ). The opinion of
a Yes-agent (always at b
k
y
= 0) and a subversive agent in this
case with views |b
k
s
| = 1.8σ. Agents with view in the
region, |b
k
i
| <
2
√
π
σ, reduces the time to reach consensus,
otherwise it leads to longer time to reach consensus.
0 1σ 2σ 3σ 4σ
0
0.2
0.4
0.6
ˆu
k
Differences in views (u
k
)
Probability
Faster consensus
Slower consensus
Radical views
Yes-agent
Subversive agents
Figure 4: Distribution of differences in views, u
k
= |b
k
i
−
b
k
j
|, with average ˆu
k
=
2
√
π
σ. The opinion of a Yes-agent
(always at b
k
= 0 and a subversive agent in this case with
views |b
k
| = 1.8σ are shown in green and red respectively.
such an agent is not present.
Each member has a view (opinion, belief) on a
specific topic, which we model as a numeric value.
The views of team members have a Normal distribu-
tion, d
k
∼ N (σ), see Figure 3. The figure also shows
the view of an agent that always aligns its view to that
of the majority, we call such an agent a yes-agent,
always saying yes, and always agreeing with the ma-
jority. Also shown are the average positions of SAs
(at −1.8 ·σ and 1.8 ·σ).
The difference in views between members (i, j) on
a topic k is given by u
k
i j
= |b
k
i
−b
k
j
| and has a Folded
Normal (F N ) distribution, where N (σ
i−j
=
√
2 ·σ).
Then the expected value, denoted with a hat, of the
difference in views is ˆu
k
=
q
2
π
·
√
2 ·σ =
2
√
π
σ as per
the statistics of an F N distribution, see Figure 4.
An interesting aspect, key to the results discussed
later, is that if an agent, i, maintains a view b
k
i
on topic
k in the range |b
k
i
| < ˆu
k
then the result is shorter time
to reach consensus for the project. On the other hand,
if an agent maintains a view |b
k
i
| > ˆu
k
the result is
longer time to reach consensus for the project. These
theoretical results are verified by simulation later in
section §3.
Exploring the Effects of Subversive Agents on Consensus-Seeking Processes Using a Multi-Agent Simulator
107
2.1 Subversive Agent Behaviour
We are interested in SAs and how they affect the pro-
cess of the group to reach consensus. SAs do not
actively sabotage projects, they are more subtle and
rather opt for creating project delays by promoting
views that will cause the group to take longer to reach
consensus. However, SAs also do not want to take
such radical positions that they are discovered.
The u
k
= ˆu
k
boundary line in Figure 4 is such that
half the view differences (u
k
) are to the left ( , with
u
k
< ˆu
k
) and half to the right ( + , with u
k
>
ˆu
k
). That means that an member, i, with view |b
k
i
| <
ˆu
k
( in Figure 3) will, through interactions with
other members, improve the overall consensus, and
thus lead to faster times to reach consensus.
Importantly, members that express views such that
u
k
> ˆu
k
( + ) will, through their actions, lead
to longer time to reach consensus. These are ideal
positions for SAs to promote.
However, such SAs do not want to constantly take
up controversial or fringe positions since that could
lead to their detection or labelling as subversive. We
select 2σ as the cut-off point ( in Figure 4) and
SAs will avoid expressing opinions on topics in that
range (u
k
> 2σ), even though other team members are
likely to have such opinions from time-to-time.
This leaves the blue hatched area in Figure 3 and
Figure 4 as the ideal ideas for SAs to promote.
The SAs change the view they project to other
members based on the overall group view. That is,
as the group as a whole moves towards consensus, so
does the SAs. They maintain their views such that
they stay in the hatched blue region, ˆu
k
< b
k
< 2, but
obviously the distribution of views contracts as the
meetings and negotiations continue.
2.2 Evolution of Views
The initial distribution of view b
k
i
∼ N (σ), as dis-
cussed in §2 and shown in Figure 4. In this subsec-
tion we discuss the evolution of this distribution as the
consensus process continue.
To illustrate the evolution of member views we
show the distribution of u
k
over time in Figure 5 for
a scenario with no SAs (blue) and when two SAs are
present (red, with b
k
= 1.8σ, ) in a group of twenty
members trying to reach consensus on twenty topics.
The top graph shows the initial distribution at
t = 0, as well as the mean values, blue solid diamond
( ) for the mean without SAs and red solid diamond
( ) when SAs are present. The graph is directly
comparable to Figure 4. The graph second from top
is the same data (at t = 0) but using a log-y scale. The
0
2
4
6
·10
−3
%
t = 0, 2 SAs
t = 0, no subversives
10
−8
10
−5
10
−2
%
t = 0
10
−5
%
t = 25
10
−5
%
t = 50
10
−8
10
−4
10
0
%
t = 75
10
−8
10
−4
10
0
%
t = 100
0σ 1σ 2σ 3σ 4σ
5σ 6σ
10
−8
10
−4
10
0
u
k
i j
= |b
k
i
−b
k
j
|
%
t = 125
Figure 5: As the consensus process continues, the distri-
bution of differences in opinions, u
k
i j
= |b
k
i
−b
k
j
|, changes.
The blue graph represent the u
k
values of a 20-group with
no SAs, and the red graph represent the u
k
values for a 20-
group with two SAs. The dashed vertical lines show the
mean values ˆu
k
for the two distributions, and the solid verti-
cal line shows the positions that the SAs took, at b
k
= 1.8σ,
where σ is the standard deviation for the group at that time.
10
12
14
Consensus Entropy (S
u
)
20-Group, three subversive agents
20-Group, two subversive agents
20-Group, one subversive agent
20-Group, no Subversive agents
20-Group, one Yes-agent
0 20 40
60
80 100 120 140
160
180 200
0
1
2
3
4
5
6
Time
Average topics discussed
per meeting
Histogram of t
max
N (175, 13.5)
Figure 6: Consensus measures over time (top) for vari-
ous numbers of subversive agents with a fixed group size
(20). (Bottom) two histograms for zero subversive agents
(µ = 120, σ = 8.22) and two subversive agents (µ = 175, σ =
13.5) of time to reach consensus for n = 10000 simulations
each.
remainder of the graphs show the distribution of u
k
as
time progresses (t = 0, 25, 50, 75, 100, and 125) on a
log-y scale.
The difference in views, u
k
contracts until, to-
SIMULTECH 2023 - 13th International Conference on Simulation and Modeling Methodologies, Technologies and Applications
108
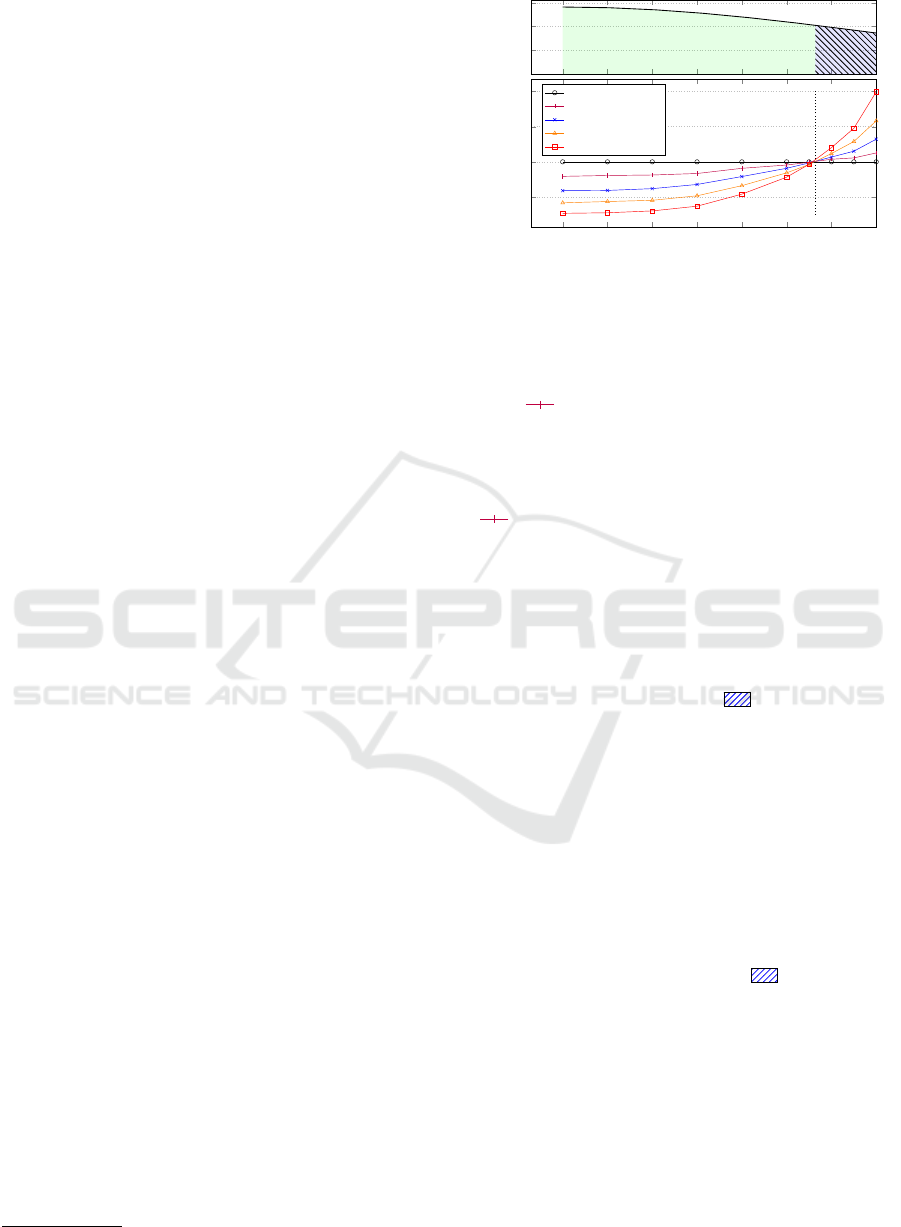
wards later time-steps, the members reach consensus
(blue graph). Here the influence of the SAs is ob-
vious, in that the distribution of views when there are
SAs present (red graphs) significantly lag in their evo-
lution towards consensus as can be seen by visual in-
spection of the graph.
Each graph in Figure 5 is related to the data points
in Figure 6 for the same time step. Over time the
views on a topic will converge as members start to
agree on the correct position on a topic. Figure 6
shows how the sum of opinions (u) changes over time
and eventually converges. The slope of the graphs in
Figure 6 is interesting and a comparison of the graph
for a normal group with no SAs with a that of a group
with two SAs show that towards the end of the con-
sensus process the SAs have little effect (the graphs
have the same slopes). That is because the distribu-
tion of opinions is small, and thus the ability of SAs
to influence the process is also limited. In this specific
example, the dramatic difference in slope only lasts to
about t = 120 after which the slopes become similar.
The overall time to reach consensus with two SAs
has mean t = 177, so that one can postulate that SAs
do most of their damage in the first 60% of the project,
after which group views have contracted sufficiently
so that the agents cannot continue being subversive
without risking being revealed.
2.3 Yes-Agents
An interesting category of non-normal agents are
those that tend towards agreeing with the majority
view on all topics, all the time. The extreme Yes-
agents
2
, who only take up positions that are non-
controversial, in the middle of the distribution of the
views of other members, see Figure 4, has the most
significant impact on the time to reach consensus.
To investigate this phenomenon we simulate a
group consisting of twenty members working on a
problem with twenty topics. We vary two parameters,
firstly the number of Yes-agents in the group, and, for
every such Yes-agent configuration we vary the posi-
tion, b
k
, that those Yes-agents take within the distribu-
tion of views (the x-axis of Figure 3). We measure the
time it takes for the group to reach consensus (t
max
).
The results are depicted graphically in Figure 7,
where the zero-SAs are used as reference and scaled
to 100. The Yes-agents has a positive impact on time
to reach consensus; the more Yes-agents the greater
the impact; and the more extreme their centerredness
the bigger the impact of improving t
max
.
A single (1 of 20) extreme Yes-agent (b
k
= 0, the
green line in Figure 3) improves the overall project
2
A sycophant in late Latin or a ’Jabroer’ in Afrikaans
0
0.2
0.4
0.6
ˆu
k
Probability
0 0.2 0.4
0.6
0.8 1 1.2 1.4
80
100
120
140
Subversive agent position in σ units
Time to reach Consensus
Zero SAs
One subversive agent
Two SAs
Three SAs
Four SAs
Figure 7: Simulation of various subversion factors ranging
from 0 (no subversion) up to 1.4σ. The graph shows the
effect that zero to four SAs have on the time to reach con-
sensus.
delivery from 100 time-units to 92 time-units, point
(0,92) in the Figure. That is, an 8% improvement.
However, this obviously comes at the risk of mak-
ing the wrong decision. If that agent’s views was not
needed, the agent should not have been in the group
in the first place, some may argue. Consider the graph
( ) of a single Yes-agent as a function of the sub-
versiveness of its views b
k
. At b
k
= ˆu
k
this agent’s
impact is the same as if it were a conventional coop-
erative agent with its own independent views.
For b
k
> ˆu
k
the impact of the SAs causes the time
to reach consensus to increase dramatically, as can be
seen from the data, shown in the Figure. The remain-
der of this paper focuses on the impact of SAs with
views in the range ˆu
k
< b
k
< 2 ( ). In particular, the
extension of Figure 7 to that region is discussed in §3
and shown in Figure 8.
3 SUBVERSIVE AGENT’S
IMPACT ON PROJECT
DELIVERY
We now turn to the impact of SAs on the time to reach
consensus when the agents take up subversive views
on topics in the range ˆu
k
< b
k
< 2, ( in Figure 3) on
purpose. It may be that they do not even believe such
a position is correct, they may be promoting other
group-member’s views, or they try to be controver-
sial, or, even that they are pro-actively trying to find
ways to sow disarray.
Whatever the reasoning for their actions, here we
explore the potential impact that such agents could
have on the time to reach consensus, and thus on the
time to delivery that phase of the project.
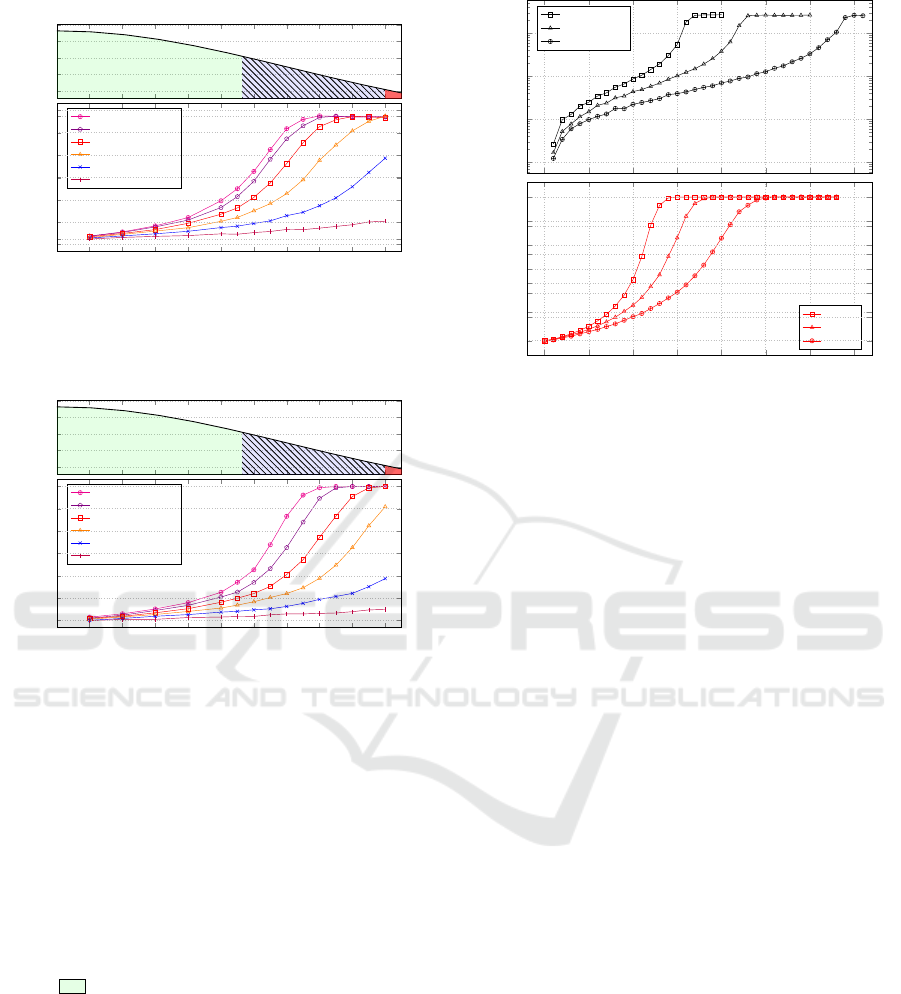
Figure 8 extends the positions taken by the SAs
from that shown in Figure 7. The results from the
Exploring the Effects of Subversive Agents on Consensus-Seeking Processes Using a Multi-Agent Simulator
109
0
0.2
0.4
ˆu
k
Probability of View
0.8 1 1.2 1.4
1.6
1.8 2
100
200
300
400
Subversive factor
Time to reach Consensus
Three SAs
Two SAs
One subversive agent
Zero SAs
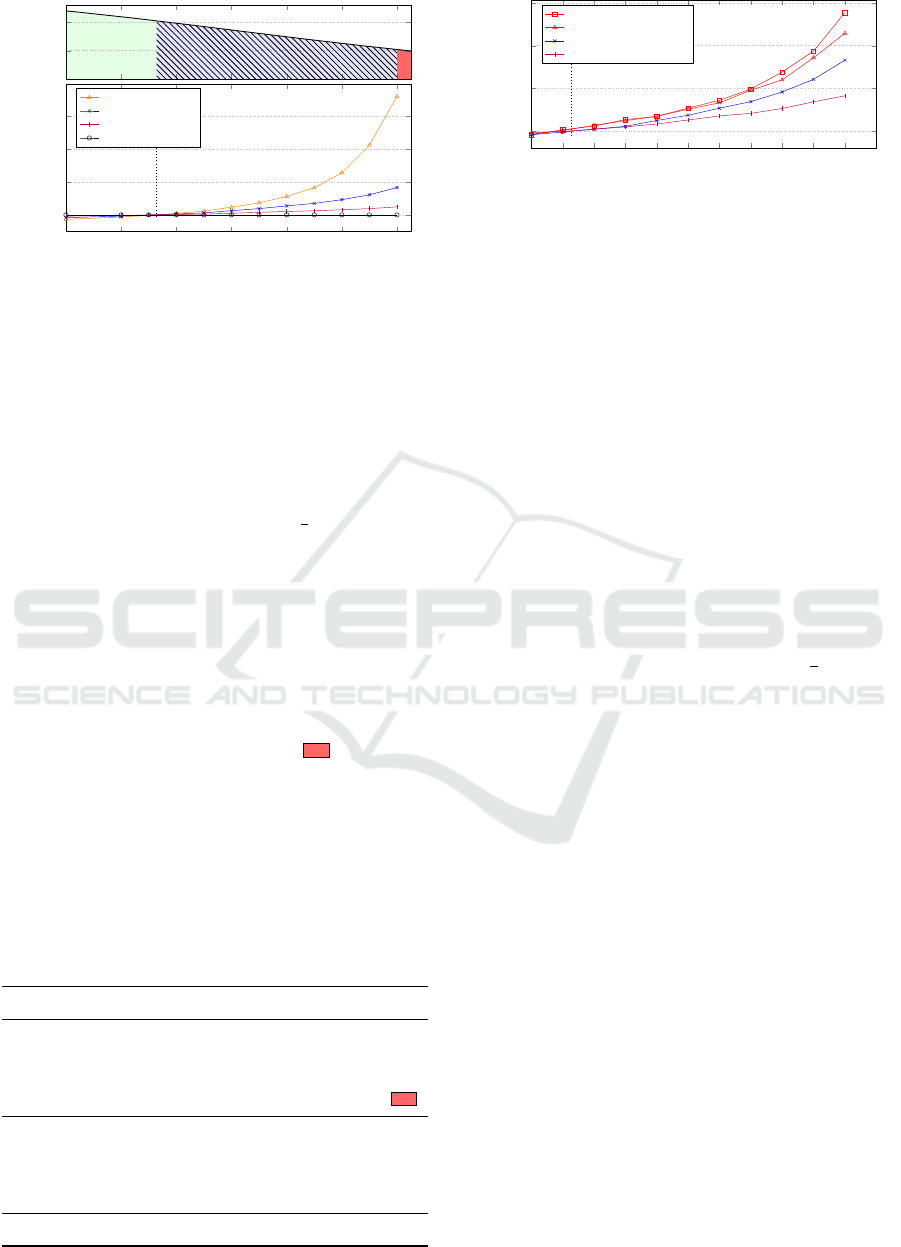
Figure 8: Simulation of various subversion factors ranging
from 0.8σ up to 2σ. The graph shows the effect that zero to
three SAs have on the time to reach consensus.
simulations show that SAs can create significant in-
creases in project times by delaying the consensus
process. The values in Figure 8 have been normal-
ized so that the consensus-time for processes with
zero SAs are scaled to 100 time-units. Recall that an
agent taking a position at ˆu
k
has the same effect as a
normal agent.
If SAs take up positions at ˆu
k
+
1
2
σ ≈ 1.6σ then
the simulations show that a single agent in a 20-group
can delay a project by 10.5%, two SAs can delay the
project by 27.2%, and three agents can cause 55.9%
delays, see Table 1.
If the SAs take up position at 2σ, which is only
0.9σ bigger than ˆu
k
, then the impact on project de-
lays are even more significant and for one, two and
three SAs the delays are 24.3%, 83.1%, and 359.5%
respectively, see Table 1. The missing number in Ta-
ble 1 for a 4/20 ratio and b
k
= 2σ ( ) is because
for that configuration the SAs have the ability to de-
lay the consensus process indefinitely. The ability of
Table 1: The data for the delay in time to reach consensus
for different ratios of SAs to total members and different
relative positions of SAs. The ’R > b
k
’ row indicates for
each subversive position (b
k
) what percentage of the total
members have an even more radical view (statistically). All
numbers are percentages. The red bar indicate that 4 SAs at
b
k
= 2σ can indefinitely delay consensus.
Ratio b
k
= 0 b
k
= 1.6σ b
k
= 1.8σ b
k
= 2σ
1/20 -8.3 10.5 15.7 24.3
2/20 -16.4 27.2 46.1 83.1
3/20 -23.3 55.9 127.3 359.5
4/20 -29.3 119.9 385.3
1/10 -10.8 18.2 26.8 41.6
2/20 -16.4 27.2 46.1 83.1
3/30 -18.8 30.3 58.2 115.4
4/40 -20.1 32.2 67.3 144.6
R > b
k
100 10.1 7.2 4.6
1 1.1 1.2 1.3 1.4
1.5 1.6
1.7 1.8 1.9 2 2.1
0
50
100
150
Subversive factor
% Delay
Four in forty SAs
Three in thirty SAs
Two in twenty SAs
One in ten subversive agent
Figure 9: Each simulation line keeps the ratio of SAs to
total members constant at 10%. The results show increase
in project delivery time as measured relative to groups with
zero SAs.
agents to control the outcome of decisions is briefly
discussed in the next section.
The argument can be made that the reason for
these increases in delays are because a greater per-
centage of the overall number of agent are subversive.
That is, one, two, and three SAs make up 1/20, 2/20
and 3/20 of the total number of project team mem-
bers, and so, perhaps this increase percentage SAs are
creating the delays, rather than the actions that these
agents take to delay the project. To address this crit-
icism a series of simulations was conduction where
that ratio of SAs to normal members are kept static
at 10%. That is, simulations were generated with one
subversive agent in a 10-group, two in a 20-group,
three in a 30-group, and four in a 40-group.
The results are shown in Figure 9 and Table 1.
One, two, three, and four SAs at ˆu
k
+
1
2
σ ≈ 1.6σ
caused delays of 18.2%, 27.2%, 30.3%, and 32.2%
respectively and at 2σ they can create project delays
of 41.6%, 83.1%, 115.4%, and 144.6% respectively.
3.1 Coordinated Agents
A single agent is a lone wolf, however, two or more
SAs can form a pack and launch coordinated attacks,
or, in this case, coordinate in the disruption of the
project, increasing delays.
In this section we investigate the patterns of co-
operation and coordination of multiple SAs. We con-
sider the following modus operandi; they can act un-
coordinated, they can push the same side of an issue,
and they can take up opposite sides of an issue thus
trying to split the other members into two groups.
There can be other ways to coordinate, for ex-
ample targeting specific members of the team trying
to influence them rather than trying to influence all
members. These and other such strategies are not in-
vestigated and left as future research.
Consider again Figure 3 and the two marked po-
sitions of a SAs, labelled (a) and (b) in the figure.
The three patterns of cooperation we investigate are
then firstly that each agent selects a position either (a)
SIMULTECH 2023 - 13th International Conference on Simulation and Modeling Methodologies, Technologies and Applications
110
−2 0 2 4
6
8 10 12 14
16
18 20
0
100
200
Group size
Time to reach Consensus
Uncoordinated actions
Similar views
Opposing views
No subversion
Yes-agents
60
80
100
% delay
% Delay
Figure 10: The graphs show the impact on time to reach
consensus for three types of cooperation between two SAs,
uncoordinated, promotion of similar views, and promotion
of opposing views. This is plotted for various group sizes.
The bands indicate a 1 −σ spread (n=200 pp).
0 10 20 30 40
50 60
70 80 90 100
0
200
400
600
Group-size
Time to reach consensus
Uncoordinated
Similar views
Opposing views
Normal Agents
Yes-agent
0
100
200
300
400
% delay
% Delay
Figure 11: Time to reach consensus for different group sizes
and cooperation types (n=100 pp).
or (b) independent of other SAs. This pattern is the
safest in that there are no correlation between the po-
sitions that SAs take, and thus no way to link them
based on their views. The second approach, calls for
all SAs to take up the same position, either left or right
of an issue, but they are coordinated in that decision.
This is less desirable from an attempt to stay hidden.
The third method of coordination is that the SAs form
two groups, one group promoting views close to (a)
on the left of an issue and the other group promoting
position (b) on the right of an issue.
To investigate the impact of the type of coopera-
tion between SAs could have on the consensus pro-
cesses we ask the question; are some types of coop-
eration more destructive than others, if measured by
time and effort to reach consensus? To answer this
question simulations were constructed to investigate
the type of cooperation and its impact on the con-
sensus processes as a function of the group size, fix-
ing the number of subversive agent and their position
(rσ, r = 1.8).
For each configuration point (group-size and num-
ber of SAs), simulations were run, n = 100 per con-
figuration, to achieve statistical significance. Figure
10 shows the results for the simulations when two
SAs are present. Figure 11 shows results with four
SAs. For the graphs where two SAs are present, the
smallest group size shown is eight; this is because
for smaller groups, the SAs assert enough control that
0 1σ 2σ 3σ 4σ
0
0.2
0.4
0.6
ˆu
k
p
k
q
k
Differences in views (u
k
)
Probability
Figure 12: Conventional consensus processes (meetings
and discussions) acts like a force (p
k
) that narrows the con-
sensus distribution. SAs within that process acts like a force
(q
k
) trying to widen the consensus distribution. If p
k
< q
k
then SAs control the process.
they can delay consensus indefinitely. The same limit
exists for when four SAs are present but for even
larger groups.
What is surprising and interesting about the re-
sults, shown in Figure 10 and repeated in Figure 11,
is how similar, in fact indistinguishable, the three co-
operative models are from each other in terms of time
to reach consensus.
This warrants some reflection. The conclusion we
reached, was that in order to affect the time to reach
consensus SAs must widen the distribution of views.
It does not matter what view they put forward (left
or right of an issue); what matters is that the overall
distribution of views widen. That is, the actual po-
sition that is taken (left or right) does not matter in
terms of the time to reach consensus, since both these
views will widen the overall distribution of views. If
the agents are coordinated to the extent that they take
position on the same side of a topic (say right) then
they will widen the distribution of views and shift the
consensus view, see Figure 12.
3.2 Level of Control
In this subsection we investigate the ability of SAs to
control the outcome of a decision. We define a goal,
one that is sufficiently far away from the starting con-
ditions that achieving it is a clear indication of control
over the group by the SAs. We are interested in what
the boundary conditions are for allowing such control
and to what extent the SAs can achieve these goals.
We define a target for each topic, k, that is 6σ away
from the initial group mean view on that topic. SAs
still have to stay within the boundaries of ˆu
k
< b
k
< 2
to prevent detection. We vary the number of agents
and the relative subversive positions they take.
This is a theoretical exercise to test control (hence
pushing decisions in only one direction). Such a sit-
uation is not realistic in the real world, however, in
the real world SAs can use their influence to not only
delay decisions but also strive to achieve a specific
Exploring the Effects of Subversive Agents on Consensus-Seeking Processes Using a Multi-Agent Simulator
111
10-groups
0.2
0.3
0.4
0.5
0.6
ˆu
k
Probability
0 0.2 0.4
0.6
0.8 1 1.2 1.4
1.6
1.8 2
0
50
100
Subversive agent position in σ units
% to goal (6σ)
Six SAs
Five SAs
Four SAs
Three SAs
Two SAs
One subversive agent
0σ
1σ
2σ
3σ
4σ
5σ
6σ
Figure 13: Graphs of the % that SAs can move the outcome
of a consensus process relative to a goal of 6σ. The group
size is ten members.
20-groups
0.2
0.3
0.4
0.5
0.6
ˆu
k
Probability
0 0.2 0.4
0.6
0.8 1 1.2 1.4
1.6
1.8 2
0
50
100
Subversive agent position in σ units
% to goal (6σ)
Six SAs
Five SAs
Four SAs
Three SAs
Two SAs
One subversive agent
0σ
1σ
2σ
3σ
4σ
5σ
6σ
Figure 14: Graphs of the % that SAs can move the outcome
of a consensus process relative to a goal of 6σ. The group
size is twenty members.
outcome.
The main point is that SAs will often strive for a
specific outcome, and if that outcome is reasonably
within the scope of the original set of views, then it
will be easy for them to achieve while still delaying
the project.
The first set of simulations that was constructed
focused on the effects that SAs can have when work-
ing together in controlling the outcome of the con-
sensus process when they operate within the b
k
s
<
ˆ
h
k
range ( in Figure 3, 4, 12, and of interest here 13
and 14).
For these simulations, the delays in reaching con-
sensus are not of interest.
We believe there is a definite theoretical boundary
where the SAs can fully control the consensus pro-
cess, which means they can both control the time to
reach consensus, stretching it out as long as they want
and control the final outcome of the process.
In a conventional consensus process through
meetings and discussion, the distribution of views
contract over time and this contraction can be seen
10
0
10
1
10
2
10
3
% Time Increase
r = 1.8 agents
r = 1.6 agents
r = 1.4 agents
0
5
10
15
20
25
30
35
0
20
40
60
80
100
% SAs (100-group)
% to goal (6σ)
r = 1.8
r = 1.6
r = 1.4
0σ
1σ
2σ
3σ
4σ
5σ
6σ
Figure 15: Subversive agents as percentage of total team
members. The top graphs show how much they can delay
the consensus process and bottom graphs show how much
they can influence the outcome.
as a force closing the distribution of views, p
k
in Fig-
ure 12. Similarly the SAs, during the same process,
acts like a force pushing the distribution wider, q
k
in
the Figure. Therefore, as long as the p
k
, the clos-
ing force from all the conventional team members is
greater than q
k
, the force from the SAs, the process
will reach consensus, though taking longer than with-
out SAs. In a scenario where p
k
< q
k
the SAs have
great control over the outcome, both in terms of time
to reach consensus and also the overall outcome.
3.3 Group Control and Delays
In this sub-section the ability of SAs to delay the pro-
cess but also control the outcome is investigated. Here
we will are interested in the effects as a function of the
% of SAs in the group.
Since it should be clear by now that if there are
sufficient SAs present then they can delay the consen-
sus process indefinitely. To constrain the simulation
we curtail the SAs to stop their antics once a project
had been delayed by 2500%, that is, by a factor of
more than 20.
The group-size is kept at 100, and the number of
SAs are increased from 0. Also, the positions that the
SAs occupy are varied (r = 1.4, 1.6, 1.8).
The questions we then want to answer here are
how much control does the SAs have, as a function
of the group make-up, over the (a) outcomes and (b)
total project times.
The results from these experiments are shown in
Figure 15. The top graphs show that for r = 1.8 the
SAs gain full time-control when there are more than
SIMULTECH 2023 - 13th International Conference on Simulation and Modeling Methodologies, Technologies and Applications
112

16% SAs. For r = 1.6 and 1.4 full control is gained at
23% and 34% respectively.
This should however be seen in context since these
measures are for a more than 20 times delay. If the
benchmark is a more reasonable 100% delay in time
to reach consensus, then for r = 1.8, 1.6, and1.4 the
resulting number of SAs needed are 10%, 15%, and
23% respectively.
The bottom graphs in Figure 15 shows the level of
control that the SAs can exert on the final outcome,
similar to the measurements from the previous sec-
tion. Again, shifts in position are capped at 6σ. SAs
can reach this benchmark when 14% SAs are present
for r = 1.8. This changes to 17% and 25% for r = 1.6
and 1.4, respectively.
4 DISCUSSION
We started off with the simple assumption that the
delivery of a project is fundamentally a series of
consensus-seeking processes. We assumed all team
members are cooperative and work under assump-
tions of good-faith on the part of other members.
However, the introduction of a subversive agent
that pro-actively tries to influence other members to-
wards views that are plausible yet create more debate
has a significant impact on the time and effort to reach
consensus. This was surprising.
The initial distribution of views has the effect that
SAs have a much wider range of views to promote
and thus we see that the influence of SAs are strong
initially but as the consensus distributions contracts
the SAs also loose their ability to influence. The in-
fluence of SAs are stronger in the earlier parts of the
consensus process, Figure 6.
Yes-agents can significantly improve consensus
times, however, since they are actively lobbying for
the group mean view (or any other specific view), they
can also cause the group to abandon valid views thus
increasing the probability that the wrong decisions are
reached. This is obviously not a new discovery; yes-
agents have been used to sway decisions for all of
recorded history (Browning, 2010).
However, when SAs operate to increase the range
of options or act to polarize the group then the impact
on the time to reach consensus can be significant, Fig-
ures 8 and 9.
An interesting result from this study was that
the level of cooperation and synchronization between
SAs do not have a significant impact on the time to
reach consensus. That is, SAs acting as a group, or
acting in isolation have the same effect as measured
by consensus time. However, SAs acting in a coordi-
nated way can significantly influence the outcome of
a decisions, even if the SAs form a small minority in
the group, Figures 14 and 15.
Under the right conditions a small minority of SAs
(say 10%) can have a significant impact on the time
to reach consensus, extending it by as much as 100%
(doubling the time it would have taken), Figure 15
(top). Surprisingly, a small number of SAs (20%) can
indefinitely stall the consensus process. A slightly
bigger SAs group of 20% of the group membership
can have effects ranging from a doubling of the time
to reach consensus (r = 1.4) to indefinitely delaying
consensus (r = 1.8).
5 LIMITATIONS
We would like to point out some limitations to this ap-
proach and results. Firstly, this is a theoretical model
showing what is possible with consistently operating
subversive agents. Reality may be vastly different and
more complex. Secondly, we see a specific topic, say
k, as a single atomic topic with a single outcome. In
reality this topic may consist of many sub-topics, and
the actual complexity of a project is much greater than
what we model. The sub-topics issue is less of a prob-
lem since that strengthen the Gaussian distribution
assumptions we made. We do not think the results
will differ if the problem size is increased, as we have
demonstrated in an earlier paper (Vorster and Leenen,
2023), however, other researchers should verify this.
Lastly and perhaps the most important limitation
is that it will be difficult to verify these results in real-
world projects, since subversive agents are by defini-
tion hidden. Any team member may act as a subver-
sive agent due to being disgruntled or a host of other
reasons. One way to verify these results would be to
insert such an agent into ’play’ projects, an interesting
topic for Social Psychology research.
6 CONCLUSION AND FUTURE
WORK
In this paper we investigated the effects that subver-
sive agents may have on consensus processes and in
particular the speed of project delivery if a project is
seen as a series of consensus-seeking processes.
The important results are that even small numbers
of SAs can have a significant effect on the time it take
a group to reach consensus. The delay effects of SAs
are most significant during the earlier parts of the con-
sensus process. SAs need not coordinate to achieve
Exploring the Effects of Subversive Agents on Consensus-Seeking Processes Using a Multi-Agent Simulator
113

significant delays but, if they do coordinate, they can
both delay the process significantly and also have a
significant influence on the decision outcomes (con-
trolling which decisions are finally made).
A small number of SAs, as little as 10% can, under
the right conditions, double the time to reach consen-
sus (and thus also doubling the cost, as a measure of
effort).
A group of well coordinated SAs that make up
more than 20% of the group can cause delays ranging
from about doubling the time for project completion
to completely stall projects.
As future work we propose Social Psychology re-
search experiments to covertly observe the behaviour
of a planted agent within a mock project and the ef-
fect this could have. For one, can such an agent stay
hidden, what would be good strategies for subverting
team members, and, when to give up being subver-
sive, since our research suggest most of the damage
had been done about halfway through the project, and
thus that seems to be a good point in time to stop be-
ing subversive, or at least reduce risk of detection by
being more cooperative.
From a computational intelligence perspective,
extending a multi-agent system with AI-based sub-
versive behaviour could yield more complex strate-
gies; and, ways to address such behaviour, both form
a detection as well as a mitigation perspective.
REFERENCES
Al-Ahmad, W., Al-Fagih, K., Khanfar, K., Alsamara, K.,
Abuleil, S., and Abu-Salem, H. (2009). A taxonomy
of an it project failure: root causes. International
Management Review, 5(1):93.
Amirkhani, A. and Barshooi, A. H. (2022). Consensus in
multi-agent systems: a review. Artificial Intelligence
Review, 55(5):3897–3935.
Bao, G., Ma, L., and Yi, X. (2022). Recent advances on
cooperative control of heterogeneous multi-agent sys-
tems subject to constraints: A survey. Systems Science
& Control Engineering, 10(1):539–551.
Barnes, M. and Prior, D. (2009). Subversive citizens: Power,
agency and resistance in public services. Policy Press.
Browning, G. (2010). Agency and influence in the his-
tory of political thought: The agency of influence and
the influence of agency. History of Political Thought,
31(2):345–366.
Chang, M.-h. and Harrington, J. E. (2004). Agent-based
models of organizations working paper, no. 515.
Den Boon, A. K. and Van Meurs, A. (1991). Measuring
opinion distributions: An instrument for the measure-
ment of perceived opinion distributions. Quality and
Quantity, 25(4):359–379.
Dunbar, R. I. (1998). The social brain hypothesis. Evo-
lutionary Anthropology: Issues, News, and Reviews:
Issues, News, and Reviews, 6(5):178–190.
Evans, M. S. and Romerstein, H. (2012). Stalin’s secret
agents: the subversion of Roosevelt’s government. Si-
mon and Schuster.
Gilbert, N. and Gilbert, G. N. (2010). Computational social
science. null.
Kian, M. E., Sun, M., and Bosch
´
e, F. (2016). A consistency-
checking consensus-building method to assess com-
plexity of energy megaprojects. Procedia-social and
behavioral sciences, 226:43–50.
Lang, J. W., Bliese, P. D., and de Voogt, A. (2018). Mod-
eling consensus emergence in groups using longi-
tudinal multilevel methods. Personnel Psychology,
71(2):255–281.
Leishman, T. G., Green, D. G., and Driver, S. (2008). Self-
organization in simulated social networks. null.
Manky, O. and Dolores, J. (2022). Subversive en-
trepreneurs: Business agency and commodification of
peruvian higher education (1992–2012). Latin Amer-
ican Perspectives, 49(3):162–180.
McDowell, K. (2002). Roll of thunder, hear my cry: A
culturally specific, subversive concept of child agency.
Children’s Literature in Education, 33:213–225.
Stocker, R., Green, D. G., and Newth, D. (2001). Consensus
and cohesion in simulated social networks. Journal of
Artificial Societies and Social Simulation, 4(4).
Tesfatsion, L. and Judd, K. L. (2006). Handbook of compu-
tational economics: agent-based computational eco-
nomics. Elsevier.
Vorster, J. S. and Leenen, L. (2023). Consensus simulator
for organisational structures. Proceedings of the 13th
International Conference on Simulation and Modeling
Methodologies, Technologies and Applications.
Waheeb, R. A. and Andersen, B. S. (2022). Causes of
problems in post-disaster emergency re-construction
projects—iraq as a case study. Public Works Manage-
ment & Policy, 27(1):61–97.
Whitney, K. M. and Daniels, C. B. (2013). The root cause
of failure in complex it projects: Complexity itself.
Procedia Computer Science, 20:325–330.
Will, M. G., Al-Kfairy, M., and Mellor, R. B. (2019). How
organizational structure transforms risky innovations
into performance–a computer simulation. Simulation
Modelling Practice and Theory, 94:264–285.
Yang, R., Liu, L., and Feng, G. (2022). An overview of
recent advances in distributed coordination of multi-
agent systems. Unmanned Systems, 10(03):307–325.
SIMULTECH 2023 - 13th International Conference on Simulation and Modeling Methodologies, Technologies and Applications
114
