
Hawkes Processes on Social and Mass Media: A Causal Study of the
#BlackLivesMatter Movement in the Summer of 2020
Alfred Lindstr
¨
om
1,2 a
, Simon Lindgren
3 b
and Raazesh Sainudiin
1,2 c
1
Department of Mathematics, Uppsala University, Uppsala, Sweden
2
Combient Competence Centre for Data Engineering Sciences, Uppsala University, Uppsala, Sweden
3
Department of Sociology, Ume
˚
a University, Ume
˚
a, Sweden
Keywords:
Hawkes Process, Community Detection, Granger Causality, Hypothesis Test, Social & Mass Media Modelling.
Abstract:
In this work we study interactions in social media and the reports in mass media during the Black Lives
Matter (BLM) protests following the death of George Floyd. We implement open-source pipelines to process
the data at scale and employ the self-exciting counting process known as Hawkes process to address our
main question: is there a causal relation between interactions in social media and reports of street protests in
mass media? Specifically, we use distributed label propagation to identify such interactions in Twitter, that
supported the BLM movement, and compared the timing of these interaction to those of news reports of street
protests mentioning George Floyd, via the Global Database of Events, Language, and Tone (GDELT) Project.
The comparison was made through a Bivariate Hawkes process model for a formal hypothesis test of Granger-
causality. We show that interactions in social media that supported the BLM movement, at the beginning of
nationwide protests, caused the global mass media reports of street protests in solidarity with the movement.
This suggests that BLM activists have harnessed social media to mobilise street protests across the planet.
1 INTRODUCTION
On 25th of May 2020, George Floyd, a 46 year old
African-American man, is arrested in Minneapolis,
Minnesota for allegedly using a counterfeit $20 bill
to buy cigarettes. The arrest is caught on film by
passersby, showing how police officer Derek Chauvin
pins the handcuffed Floyd to the ground with his knee
on Floyd’s neck, while his three colleagues prevent
anyone from intervening. Floyd repeatedly utters the
words “I can’t breathe” before he goes unconscious.
He later dies at the hospital, and the video of the arrest
goes viral on Facebook (Deliso, 2021). The next day
protests in support of the Black Lives Matter (BLM)
movement, and against police brutality, start in Min-
neapolis, which during the following days will spread
both nationally and internationally to over 60 coun-
tries, and become what may be the largest protests in
U.S. history to date, with polls estimating attendances
in the range of 15-26 million people (Buchanan et al.,
2020).
BLM is a decentralised grassroots movement that
began on social media, using the hashtag #Black-
a
https://orcid.org/0009-0009-2300-4366
b
https://orcid.org/0000-0001-6289-9427
c
https://orcid.org/0000-0003-3265-5565
LivesMatter in the wake of the shooting of Trayvon
Martin in July 2013. The movement has since then
gained attention for demonstrations following the
deaths of Michael Brown and Eric Garner in 2014,
and George Floyd in 2020, with its main issues be-
ing that of advocating against police brutality toward
African-Americans, and policy issues related to racial
injustices (Jackson et al., 2020).
As reactions and critiques of the BLM movement,
the phrase “All lives matter” was coined, as well as the
phrase “Blue lives matter”, after the shooting of two
police officers during protests in Ferguson, Missouri
in 2015. Both of these slogans are associated with
conservative views, and rejects the BLM-movement’s
idea of a need to focus on the racial injustice towards
African Americans.
The decentralised nature of all three of these
movements, and the way social media has played a
key part in their development, leading to real life
events such as mass protests, motivates our choice to
analyse data from social media and from mass media
to try to get a better understanding of the mobilisation
in social media into real-world action.
In this work we study the landscape in mass and
social media during the first month of protests that fol-
lowed after the murder of George Floyd. Our primary
question is whether there is a statistically significant
LindstrÃ˝um, A., Lindgren, S. and Sainudiin, R.
Hawkes Processes on Social and Mass Media: A Causal Study of the BlackLivesMatter Movement in the Summer of 2020.
DOI: 10.5220/0012089500003541
In Proceedings of the 12th International Conference on Data Science, Technology and Applications (DATA 2023), pages 77-88
ISBN: 978-989-758-664-4; ISSN: 2184-285X
Copyright
c
2023 by SCITEPRESS – Science and Technology Publications, Lda. Under CC license (CC BY-NC-ND 4.0)
77

interaction between communications in socially net-
worked communities and street protests as measured
by published reports in mass media. We attempt to
answer this question by devising a data processing
framework to mathematically model the interactions
between social and mass media via the family of point
processes known as Hawkes processes and conduct
statistical hypothesis tests of Granger causality, sub-
sequent to identifying influential social media com-
munities using network models.
The paper’s outline is as follows. We describe
Models in Section 2, Data Handling in Section 3,
Analysis of Twitter Data in Section 4, Joint Media
Modeling in Section 5 and conclude in Section 6.
2 MODELS
2.1 Hawkes Processes
We will now introduce a family of point processes
known as Hawkes processes, assuming the reader is
familiar with point processes. These processes were
introduced by Hawkes (Hawkes, 1971), and due to
their self-exciting nature they are used in fields such
as epidemiology, seismology, and finance (Daley and
Vere-Jones, 2003; Bacry et al., 2015).
Suppose we observe events in continuous time,
i.e., points on the positive real line as timestamps,
where for each i, t
i
is the exact time where some sort
of event occurs for the i-th time. Define the history of
a point process up to time t, as the set H
t
containing
all timestamps {t
i
} up to time t. A Hawkes process
allows us to model the occurrence of future events af-
ter time t based on the entire history H
t
up to time t
as follows:
Definition 2.1. Let N(t) be a point process that
counts the number of events up to time t with history
H
t
. If the intensity λ(t) of N(t) is of the form
λ(t) = µ +
∑
t
i
∈H
t
φ(t −t
i
) , (1)
we define N(t) as a Hawkes process, where µ is the
baseline intensity and φ(t) is the kernel.
We will now introduce a particular choice of ker-
nel.
Definition 2.2. We define
φ(t) = αβe
−βt
, (2)
as an exponential kernel where parameter α ≥ 0 is the
self-excitation parameter, and parameter β > 0 is the
decay rate.
Parameter α thus decides how much an occurred
event will influence the rate of new events, while β
will decide how long into the future this influence will
last as φ(t) → 0, when t → ∞.
A natural extension of the Hawkes process is the
multivariate Hawkes process.
Definition 2.3. Let d ∈ N be the number of dimen-
sions, and H
t,i
for i = 1, .., d be the history of events in
dimension i. The multivariate point-process induced
by the intensities
λ
i
(t) = µ
i
+
d
∑
j=1
∑
t
k
∈H
t,j
φ
i j
(t −t
k
) i = 1,...,d (3)
is then defined as a multivariate Hawkes process.
If the kernel φ
i j
(t) takes the form of the following
multivariate exponential kernel,
φ
i j
(t) = α
i j
β
i j
e
−β
i j
t
i, j = 1,...,d , (4)
where α
i j
≥ 0 is the excitation parameter, and β
i j
>
0 is the decay rate, then we have the multivariate
Hawkes process with exponential kernel.
The excitation parameter α
i j
can be interpreted
similarly as α in the one-dimensional case with the
exponential kernel, with the exception that this influ-
ence on new events in dimension i now may come
from previous events in any dimension j ∈ {1,...,d}.
Analogously, β
i j
is interpreted as the rate of decay
that specifies how past events in dimension j can in-
fluence the arrival of new events in dimension i. In
Section 5 we use a multivariate Hawkes process to
model Twitter events in dimension 1 and mass media
reports of protests in dimension 2.
2.2 Granger Causality
How to rigorously define causality has been a topic of
discussion in western philosophy for over 2000 years,
starting with Plato and Aristotle (Falcon, 2019), and
continuing on with Hume and Kant’s disagreement
being one of the fundamental discussions in modern
philosophy. The problem is still open, (Pierris and
Friedman, 2018).
In light of this, and in some sense to get around the
metaphysical complications of proper causality, Clive
Granger introduced the concept of Granger Causality
relating to stochastic processes. The basic idea is if a
variable X
t
Granger-causes variable Y
t
, then the past
values of X
t
contain information that helps predict fu-
ture values of Y
t+1
better than doing prediction based
only on past values of Y
t
(Granger, 1980).
Using the following Theorem from Eichler (Eich-
ler et al., 2012), we will test the null hypothesis of the
non-existence of Granger causality between events in
social and mass media, and vice versa, in the sequel.
DATA 2023 - 12th International Conference on Data Science, Technology and Applications
78

Theorem 2.1. Let N(t) be a multivariate Hawkes
process in d dimensions, with kernels φ
i j
(t), i, j ∈
{1,...,d}. Then the j-th component N
j
does not
Granger-cause the i-th component N
i
if and only if
φ
i j
= 0, ∀t ∈ R.
Thus, when N(t) is a multivariate Hawkes pro-
cess with exponential kernel, by Theorem 2.1 the j-th
component N
j
does not Granger-cause the i-th com-
ponent N
i
if and only if α
i j
= 0, ∀t ∈ R.
3 DATA HANDLING
3.1 Apache SPARK
The data was handled using Apache Spark
1
which is
an open-source engine designed for data engineering,
data science, and machine learning on clusters of mul-
tiple computers, by implicit data parallelism. Spark
is multi-language and supports Scala, Python,
R, SQL, Java, C# and F#. While most of the
code for this article was written in Scala, the ease
of switching between languages in the same environ-
ment proved quite useful, as we would use libraries
written in both R and Python .
On top of Spark core, Spark SQL (Armbrust
et al., 2015), which introduces the data abstrac-
tion of DataFrames, allows manipulation in Scala,
Python, and R using the standard SQL language,
and the graph-processing framework GraphX (Gon-
zalez et al., 2014), allows for network-analysis. To
run Spark, the cloud data platform Databricks was
used, which provided cloud storage, computing clus-
ters, and a notebook-environment to write and run the
code after loading the two main libraries developed
for this study, MEP
2
and SPARK-GDELT
3
.
3.2 Twitter
Twitter is a micro-blog and social media service,
founded in 2006, where users post and interact via
tweets – a short message restricted to 280 characters,
which may also contain pictures, short videos and
URLs. Tweets can be original posts, replies to other
tweets, or retweets, i.e., sharing of another user’s
tweet. As long as a user does not actively chose to be
private, anyone is able to read the tweets of the user.
To help a tweet gain attraction, and make it easier for
other users to find tweets on a specific topic, the user
can tag their posts by including keywords prefaced
1
https://github.com/apache/spark
2
https://github.com/lamastex/mep
3
https://github.com/lamastex/spark-gdelt
with ‘#’, the hash symbol. These tagged keywords are
called hashtags and they have been used by activists
in global social movements such as #BlackLivesMat-
ter and #MeToo (Jackson et al., 2020).
Users may also follow other users on Twitter. The
relationship of following is asymmetrical, meaning
that if user A follows user B, user B does not have
to follow user A. Compare this to Facebook, where
users mutually have to accept each other as friends
to be able to interact. To simplify things, if Face-
book is about keeping in touch and networking with
your friends, Twitter is about sharing and receiving
information the user finds interesting; according to
a study done in 2014, 44% of Twitter’s users have
never tweeted which seems to suggest that a large
part of the user base only uses Twitter for receiving
information (Muphy, 2014). Due to this asymmetri-
cal following relationship, which encourages a more
open discourse between users, along with its magni-
tude of users, choosing Twitter as the social media to
analyse becomes the natural choice. Furthermore, un-
like Twitter, other prominent social media platforms
including Facebook and Instagram do not allow re-
searchers open access to their data. We developed
MEP to be able to design experiments, collect and
analyse data from different Twitter APIs at scale in
public cloud infrastructure.
3.2.1 Application Programming Interface
To work with and be able to analyse Twitter data
efficiently on an arbitrarily large scale, access to
Twitter’s Application Programming Interface (API)
is needed, and requires Twitter developer credentials,
which anyone can apply for. With access to the cre-
dentials, one may request and download tweets which
can be represented as JSON-files. At the time of writ-
ing, two versions of the Twitter API exists. This work
was done in the older version 1.
To get a sense of how the data was handled, a brief
overview of the relevant fields from the schema of the
JSON for a tweet will be presented. For full details,
we refer to Twitter’s data dictionary
4 5
. The two most
basic objects for a tweet are the User object and the
Tweet object shown in Tables 1 and 2, respectively.
From the User object, as the name suggests, we
get access to the metadata of a user. However, note
that no direct information about which users follow
the user, or which users the user follows, beyond the
counts, is accessible from the user object.
4
https://developer.twitter.com/en/docs/twitter-api/v1/
data-dictionary/object-model/tweet
5
https://developer.twitter.com/en/docs/twitter-api/v1/
data-dictionary/object-model/user
Hawkes Processes on Social and Mass Media: A Causal Study of the BlackLivesMatter Movement in the Summer of 2020
79

Table 1: Some attributes, with their types and description,
for the User object.
User object
Attribute Type Description
id Int64 The unique integer
representation of the user.
screen String The screen name, also
name known as handle of the user.
followers Int The number of followers
count the user has.
friends Int The number of users
count the user follows.
From the Tweet object, we get access to the meta-
data of a tweet. Via the field “user”, we also get
the information of the user behind the tweet, since
this is a User object. Moreover, since the fields
“quoted status” and “retweeted status” are Tweet ob-
jects, we get the full information of the original post
that has been retweeted or quoted.
Note that the Tweet Object in “retweeted status”
points to the original tweet that has been retweeted,
if the post is a retweet. It is possible for a user to
retweet another user’s retweet, but information on this
chain of events is thus not accessible. For example, let
user A write a tweet T that gets retweeted by user B.
Later, user C sees this retweet on user B’s timeline and
then retweets T. Twitter’s API will then only tell us
that user B and C have retweeted user A, but not the
fact that user C accessed this tweet via user B. This
limitation also motivates the use of retweet network
in Section 4.2.
Along with these two objects, there is another ob-
ject named entities, which contains all the metadata
of a tweet’s content, including any URLs, hashtags,
twitter handles of users mentioned, and media content
(pictures and short video clips).
3.2.2 Data Set
The data set that was used (Giorgi et al., 2020)
has 41.8 million collected tweets from 10.1 million
unique users regarding the Black Lives Matter move-
ment, along with the smaller counter movements of
Blue Lives Matter (pro-police movement) and All
Lives Matter. These tweets were collected by filtering
on the keywords: BlackLivesMatter, BlueLivesMatter
and AllLivesMatter. The data contains tweets from
the beginning of the movement in 2013 to 30 June
2020. In this work, we focus on the events occurring
during the aftermath of the death of George Floyd on
25 May 2020, and discard all tweets before this date.
3.2.3 Collecting Data
Due to Twitter’s policy, collecting and sharing tweets
publicly is not allowed. To share a set of tweets, in-
stead one shares the IDs of each tweet, and to get the
full metadata of the tweets, access to Twitter’s API is
needed. There is also a limit on how many tweets one
may collect per hour, which initially was a problem.
To get around this, the python library twarc
6
was
used. twarc allowed us to collect tweets from the
IDs (a process known as hydrating), in an optimised
way with respect to the hourly collection limit.
To be able to work with the data in Databricks and
Spark, a Docker-container with python and twarc
was set up on a remote machine, that ran the hydration
script on small batches of the IDs, collected them as
‘.json’-files, and then compressed and stored them in
our Databricks cloud storage. This procedure took
roughly five days.
A consequence of retroactively collecting tweets
from their IDs is that all tweets that have been re-
moved due to various reasons (such as the users of
these tweets getting banned, removing their accounts,
or going private) at the time of hydrating, are not ac-
cessible and were therefore not collected.
After hydrating the IDs from the data set, and
discarding tweets posted earlier than 24 May 2020,
23.3 million tweets from 7.1 million unique users
were left. These were cleaned to be easier to work
with using Spark’s Dataframes. We also categorised
each tweet as an original tweet, retweet, quoted tweet,
etc., and then stored them in the column-based data-
storage format parquet on a delta lake (Armbrust
et al., 2020). See MEP for details of the collector, pre-
processor and categoriser behind the delta lake.
3.3 GDELT
The Global Database of Events, Language, and
Tone (GDELT) project, founded in 2013, is an open
database supported by Google Jigsaw, that monitors
news media in print, broadcast, and web formats from
all over the world in over 100 languages. It is updated
every fifteen minutes and stretches back to the 1st Jan-
uary of 1979, containing meta-data such as the people
and organisations being mentioned, events and their
locations, counts of key-words along with the tone
and emotions of the parsed news sources
7
. We used
the GDELT database to get a high level understanding
of the mass media landscape during the given time
span, by reducing the records of reported events of
protests, to data points in time. We accomplish this
6
https://twarc-project.readthedocs.io/en/latest/
7
https://www.gdeltproject.org/
DATA 2023 - 12th International Conference on Data Science, Technology and Applications
80

Table 2: Some attributes, with their types and description, for the Tweet object.
Tweet object
Attribute Type Description
created at String UTC-time when the tweet was created.
id Int64 The unique integer representation of the tweet.
text String The textual content of the tweet.
in reply to status id Int64 If the tweet is a reply to another tweet, the field will
contain the tweet-ID of that tweet. Otherwise null.
in reply to user id Int64 If the tweet is a reply to another tweet, the field will
contain the user-ID of that tweet. Otherwise null.
user User Object All information of the user of the tweet.
quoted status Tweet Object If the tweet is a quote tweet, all information
of the original tweet will be contained in this field. Otherwise null
retweeted status Tweet Object If the tweet is a retweet, all information
of the original tweet will be contained in this field. Otherwise null
by building an analytics-ready Delta Lake (Armbrust
et al., 2020). A brief overview of GDELT to appreci-
ate how we handled the data for this work follows. For
a more thorough overview, we refer to the documen-
tation
8
and SPARK-GDELT, our open-source library
developed for this study.
3.3.1 Coding
The idea behind GDELT is that of coding, which is
fundamentally fairly simple. Given a record – for ex-
ample a written news article – go through the text and
identify the real world events that are being reported
in the record, and identify the actors who are involved
in the event. During the Cold war, two coding frame-
works dominated: WEIS and the Conflict and Peace
Data Bank, COPDAB. Both of these frameworks,
being developed and used in a 20th century post-
World War II context, were focused on codifying how
sovereign states (the actors) interacted through offi-
cial diplomacy and military threats (Schrodt, 2012).
For example, in the following sentence:
“President Reagan has threatened further action
against the Soviet Union in an international televi-
sion program beamed by satellite to more than 50
countries”,
one would identify the act of threatening as the event,
and assign it some integer (decided by the code frame-
work), with the actors being President Reagan (or
the United States if the coder is only interested in
sovereign states), and the Soviet Union.
This process of coding would historically be done
by hand. However, the combination of psychological
studies showing that the kind of sustained decision-
making involved in coding leads to fatigue, inatten-
8
http://data.gdeltproject.org/documentation/
GDELT-Global Knowledge Graph Codebook-V2.1.pdf
tion, and heuristic shortcuts, and the technological ad-
vancement in computing software and hardware, cod-
ing is nowadays automated. The frameworks for cod-
ifying has also developed since the cold war, with
GDELT using the framework of Conflict and Me-
diation Event Observations (CAMEO) (Leetaru and
Schrodt, 2013). Some notable changes being that ac-
tors are no longer limited to sovereign states, and in-
clude persons, organisations, and companies.
In practice, GDELT is essentially two separate
but interlinked databases: The Global Knowledge
Graph (GKG), which consists of records and the
Event Database, which as the name suggests stores
events that are being reported.
3.3.2 GKG
The Global Knowledge Graph (GKG) consists of all
records from multiple news sources in the world. As
of version 2 of GDELT, new records get added ev-
ery fifteen minutes. Whenever a record is added, the
source text is parsed via natural language processing
to identify the events (using coding), locations, per-
sons and organisations, as well as themes mentioned
in the text. Moreover, keywords such as “protest” that
are mentioned multiple times gets counted. Sentiment
analysis is also incorporated to get a value of the tone
of the source text (whether the text is positive, neu-
tral or negative). Many other metadata extracts are in
each GKG record.
3.3.3 Event Database
The Event database attempts to record all unique
events that are being identified in the parsing pro-
cess of the GKG database. Each data point is given
a unique ID for the event, and contains the date, the
actors along with the code of the type of event be-
Hawkes Processes on Social and Mass Media: A Causal Study of the BlackLivesMatter Movement in the Summer of 2020
81
ing identified. The coded event also gets mapped to
the Goldstein-scale (Goldstein, 1992), which seeks
to measure the potential impact the event could have
on the stability of the country. Moreover, the Event
database has metadata on how often the event has
been mentioned by records in GKG and the average
tone of these records.
3.3.4 Handling of the GDELT Data
Due to the sheer magnitude of data contained in the
GDELT database, working with data proved quite a
challenge. Our goal was to filter out the events about
the protests relating to the Black Lives Matter move-
ment and the counter movements between 25 May
2020 and 30 June 2020. Although the parsing of news
records into the GKG database identifies organisa-
tions, it did not identify the Black Lives Matter move-
ment as one, probably due to its lack of centralisation.
What we did instead was to filter out all data relat-
ing to protests happening in the world. This naturally
led to noisy data, since we got reports of protest un-
related to the BLM movement, but we justify this by
the fact that no other major protests were happening in
the world at the same time. To check this, we filtered
the Event database by events with CAMEO root-code
14, i.e., those events coded as protests, over a three
months timeline.
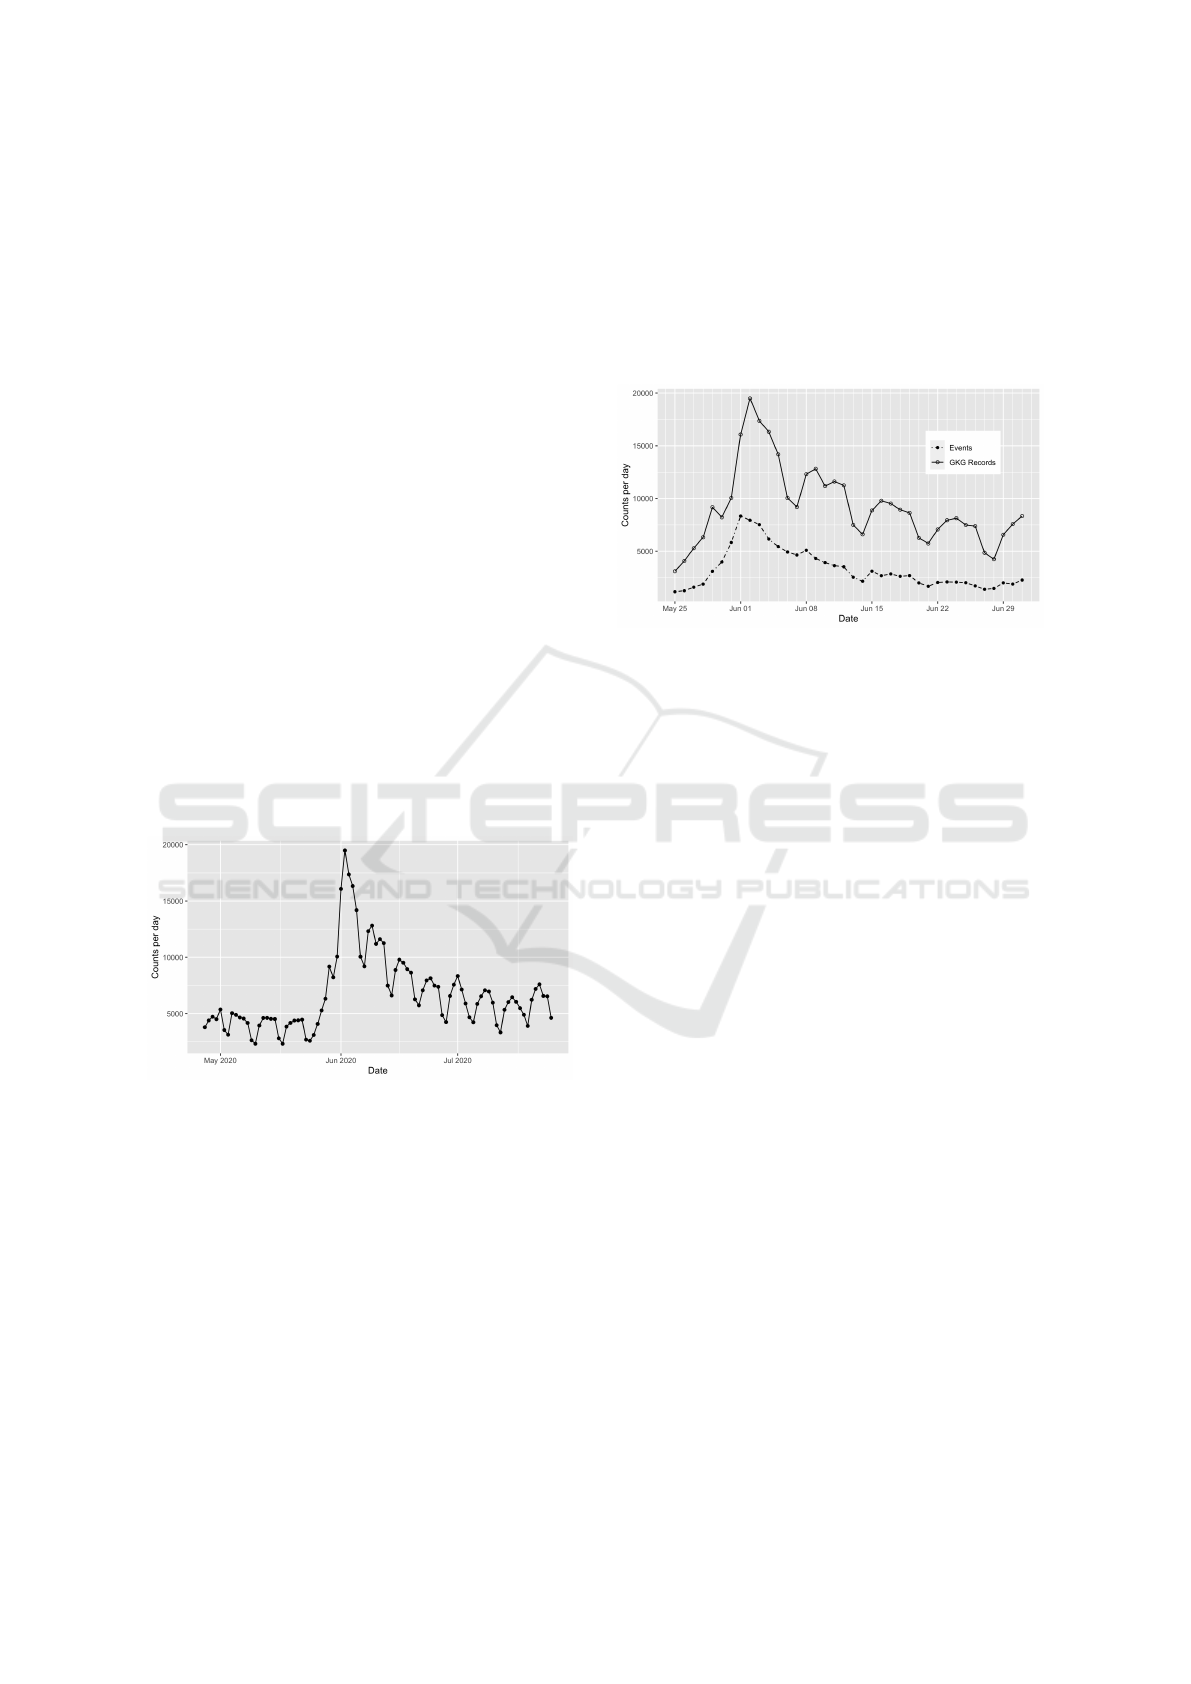
Figure 1: Events coded as protests in the GDELT Event
database.
As we see in Figure 1, there is a baseline of
roughly 5,000 events per day coded as protests be-
fore 25 May. This number then explodes, and there is
nothing that suggests that the sudden increase in mag-
nitude of protests are not related to the BLM protests.
It is worth pointing out that there is no bijection be-
tween the real world protest and the protest data from
the Event database. For example, if in one city dur-
ing one day, large protests are taking place and one
group of people are protesting peacefully while an-
other group is rioting, then the coding framework
should identify the act of the peaceful and rioting
protesters as two different events (Schrodt, 2012), al-
though they are near each other in time and space.
Thus, saying that more than 8,000 protests happened
on the 1 June 2020, would be incorrect.
In Section 5 we will look at news reports in
mass media, and therefore use data from the GKG
database. We did this by filtering by the themes of
the records. All records in the GKG database with
theme “PROTEST” were filtered out.
Figure 2: Comparison of records from the GKG database
with theme ”PROTEST”, and events coded as protests from
the Event database.
Ignoring the periodic dips in the GKG plot in Fig-
ure 2 (which are due to less reporting being done
on weekends), the two plots follow a similar pattern.
Naturally, there are more records than events, since
multiple news sources may report the same event.
4 ANALYSIS OF TWITTER DATA
In this Section, we explore the Twitter data, first via
simple querying on the data set, and then by doing
network analysis on the induced retweet network. The
results from this exploratory data analysis then moti-
vated the choice of using Hawkes processes to model
and perform hypothesis tests to shed light on the phe-
nomena of interest in this study – occurrence of tweets
in support of the BLM movement and that of mass
media reports of street protests.
4.1 Data Observations
4.1.1 Timeline
We started by examining the data over the relevant
time-span from 24 May 2020 to 30 June 2020. During
this period, 23,346,745 tweets by 7,111,140 unique
users were collected using twarc on the BLM data
set (Giorgi et al., 2020).
From Figures 3 and 4, we can see that activity first
starts on Twitter, and the reports of protests start to
drastically increase on 27 May. We also see a dip in
DATA 2023 - 12th International Conference on Data Science, Technology and Applications
82
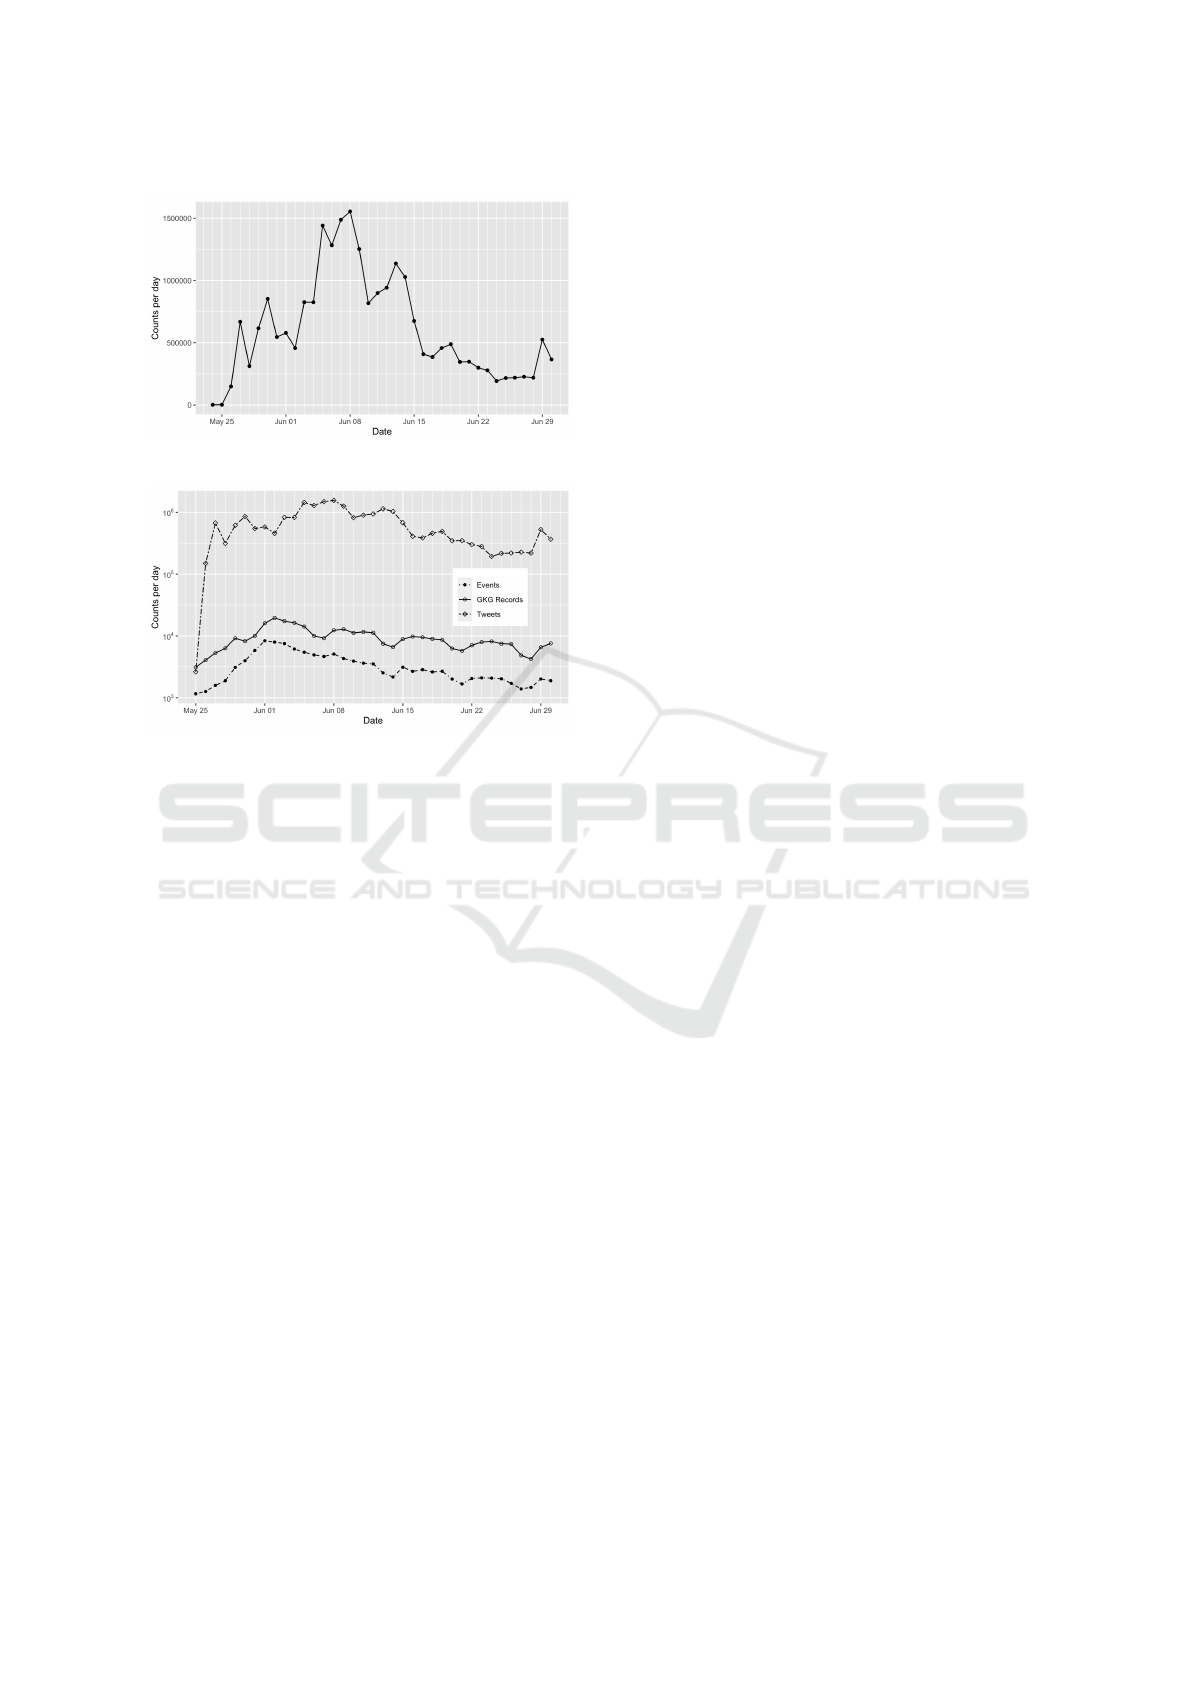
Figure 3: Number of tweets per day.
Figure 4: Log-scaled plot of the number of tweets, records
and events
Twitter activity between 31 May and 2 June, while
the GDELT data on the number of reports of protests
spikes during these days. The explanation of this is
simply that the data set lacks tweets on these days.
This was found while exploring the data, and noticing
that the data set contained retweets of a tweet from
this time period, but not the original tweet. Whether
these missing tweets disappeared during the collect-
ing of data, or if they are missing in the original data
set (Giorgi et al., 2020) of the Tweet IDs, remains un-
clear. To deal with this, we refrained from doing any
modelling with tweets from this time period.
4.1.2 Type & Media Content of Tweets
Next, we examined TweetTypes, i.e., the types of sta-
tus update or interactions in our Twitter data. The
most to least frequent TweetTypes (% of data) were
Retweets (55%), Retweets of Quoted Tweets (27%),
Original Tweets (7%), Quoted Tweets (7%), Reply
Tweets (3%), Original Tweets (1%). Thus, only 18%
of the tweets in the BLM-data set were original tweets
(either original, or replies to other tweets), with the
remaining 82% being some sort of retweeted content.
This suggests that the re-sharing of other users’ origi-
nal content is fundamental for how users interact with
each other on Twitter, and motivated our choice of ex-
amining the retweet network.
One initial idea was to focus on URLs to news
articles shared by Twitter users, and then link them
to the GDELT database. However, we soon discov-
ered that users in general did not share news sources
from mass media. Instead highly retweeted tweets
often contained original media (i.e., videos and pic-
tures), which were often taken from the protests. For
instance, 53% of tweets with over 1000 retweets, as
opposed to only 17% of all tweets, shared original
media.
4.2 Network Analysis
Section 4.1.2 showed the importance of retweets in
the Twitterverse. In this Section we will formalise
this by introducing a retweet network structure on our
data set.
4.2.1 Retweet Network
Definition 4.1. Let G
I
= (V, E) be a directed
weighted graph in time interval I ⊂ R
+
, where every
vertex v ∈ V is a unique Twitter user, and every edge
e ⊂ {(u, v) | (u,v) ∈ E ⊂ V
2
} is interpreted as user v
having retweeted u during time interval I. The weight
W (e) = W ((u,v)) ∈ N is the number of times user v
has retweeted user u. We then define G
I
as a retweet
network.
Furthermore, we define G
′
I
as an undirected
retweet network if (u,v) ∈ E ⇔ (v,u) ∈ E. Thus G
′
I
ignores whether u retweeted v or vice versa but pre-
serves the information that there is a retweet relation
between the two users.
We chose to look at retweets since a retweet
by user u of an original tweet by user v is highly
likely to mean that user u agrees with user v. Di-
rect retweets are generally recognized to indicate trust
in the communicator and endorsement (Jansen et al.,
2009; Metaxas et al., 2015; Boyd et al., 2010). The
number of times a user has been retweeted also gives
a probabilistic interpretation, using the random geo-
metric graph interpretation in (Sainudiin et al., 2019),
that measures how influential a user is on another in
terms of the lengths of their most retweeted paths.
By looking at our retweet network we can already
get some information from the Twitter data set; sim-
ply by summing the outgoing edges and their weights
for every user, we get the most retweeted users in our
time interval between 24 May 2020 and 31 June 2020.
One noteworthy user is the sixth most retweeted
user @MrAndyNgo. Andy Ngo is an American con-
servative journalist and a prominent opponent of the
Black Lives Matter movement, who in February 2021
published Unmasked: Inside Antifa’s Radical Plan to
Hawkes Processes on Social and Mass Media: A Causal Study of the BlackLivesMatter Movement in the Summer of 2020
83

Table 3: Ten most retweeted users, sorted by number
of retweets. Usernames for non-public users have been
anonymized. The communities were identifed using the la-
bel propagation algorithm.
Username | followers | | retweets | Community
@JoshuaPotash 142,833 759,572 Pro-BLM
@YourAnonCentral 5,862,927 529,431 Pro-BLM
- 1,584 187,065 Pro-BLM
@elijahdaniel 760,935 161,337 Pro-BLM
- 22,983 135,698 Pro-BLM
@MrAndyNgo 799,291 125,898 Anti-BLM
- 1,232 125,826 Pro-BLM
@BTS twt 34,107,446 125,534 K-pop
@shawnwasabi 140,788 106,731 Pro-BLM
@Drebae 141,613 103,594 Pro-BLM
Destroy Democracy (Ngo, 2021), where he among
other things writes about his experiences from the
BLM protests of 2020. His presence amongst the
most retweeted users will serve as a gateway into
the counter-movements of All Lives Matter and Blue
Lives Matter. Thus, we need to detect different com-
munities within the observed retweet network, such
that each community has more edges or retweets
within it when compared to the number of edges be-
tween it and another community.
4.2.2 Connected Components
The motivation behind the definition of an undirected
retweet network follows in the next step, when we
look at the connected components of our graph.
Definition 4.2. Let G be a graph. A sequence of
edges (e
1
,...,e
n−1
) is called path if it corresponds to
a sequence of distinct vertices (v
1
,..,v
n
), such that
e
i
= (v
i
,v
i+1
). Two vertices u,v are connected if there
exists a path between them, and if G is undirected, we
call the sub-graph H of G a connected component if
and only if there exists a path between every pair of
vertices in H which contains a subset of the vertices
in G.
The reasoning behind invoking the notion of con-
nected components of the undirected retweet network
is to, on a high level, make sure that a meaningful
discourse between users, in terms of being influenced
by and influencing others, exists within the connected
component. In practice, we could have a very dis-
connected network with lots of unconnected compo-
nents, which would mean that most users only inter-
act and retweet a few selected users. Another inter-
esting case would be if the network would have a
few significantly large components; this would sug-
gest the existence of a set of discourses, where the
users in their respective component do not interact –
perhaps because of political differences reflected in
large “echo chambers”. To find all connected com-
ponents in the retweet network, the GraphFrames
framework in Spark was used. The result showed that
6,083,687 i.e., 85.6% of the 7,111,140 users were in
the same connected component. The remaining users
were scattered around in smaller connected compo-
nents, with the largest being 74 users. These users
were therefore discarded from further analysis.
4.2.3 Community Detection
While the data set contains tweets using the hash-
tags of the counter movements #AllLivesMatter and
#BlueLivesMatter, in practice, users associated with
these movement did not necessarily use these hash-
tags, but often used the hashtag #BlackLivesMatter
either ironically or to get more attention. Thus, just
using simple querying on the hashtags in the data set,
did not suffice to get a sample of users from these
movements. To get a better sense of the relationship
between users, we instead therefore used the commu-
nity detection algorithm known as Label propagation
algorithm (LPA). LPA is a semi-supervised machine
learning algorithm, which seeks to assign labels to
nodes in a network, where each label maps to a spe-
cific community inside the network (Raghavan et al.,
2007). In Spark’s GraphX framework, the algorithm
is implemented using Pregel API (Malewicz et al.,
2010), which allows for parallel computation when
processing graphs. On a high level, Pregel computa-
tions are a sequence of iterations, defined as super-
steps, where for every superstep, each vertex in the
graph runs a user defined function. This local vertex-
centric approach where each vertex is processed inde-
pendently in parallel, in contrast to the more classical
iterative graph algorithms where each vertex is visited
one by one, naturally induces distributed implemen-
tations that can computationally scale to arbitrarily
large networks. In distributed LPA, implemented as
a Pregel program , each vertex in the graph is initially
assigned its own distinct vertex label to represent its
initial community label. At every superstep, vertices
send their community label to all out-neighbours and
update their label to be the mode community label
of incoming messages from their in-neighbours. Al-
though the algorithm can have trivial or oscillating so-
lutions without guarantees on convergence, it works
well in practice on real data as we found by running
LPA on the largest connected component with 10 su-
persteps and investigating at least the most influential
set of users within each community manually.
4.2.4 Exploring Ideological Diversity
By looking at the twenty most retweeted users, we
see that eighteen of these fall into the same pro-BLM
DATA 2023 - 12th International Conference on Data Science, Technology and Applications
84

community, with 155,229 users. Andy Ngo is in a
community with 26,624 users. This is interesting
when we remind ourselves from Table 3 that he is the
sixth most retweeted user, and if we assume that most
of his retweets come from his relatively small com-
munity, it suggests that he has a very loyal set of core
followers. The questions that arises then are if we can
identify this core set of followers, and moreover if we
also can identify a similar core followings in the pro-
BLM community. In the same community where we
find Andy Ngo, we also have prominent conservative
commentators such as Candance Owens, Glenn Beck,
Steven Crowder, Paul Joseph Watson, Dave Rubin,
and also Republican senator Ted Cruz, and Raheem
Kassam from the Reform UK-party (formerly known
as The Brexit-Party), along with others. It is worth
mentioning that all of the twenty most retweeted users
in this community are users with largest followings
(over 25,000 followers). Thus, the phenomena of
users with small followings reaching a larger audience
does not exist to the same extent in this community
when compared to the pro-BLM community.
The last of the twenty most retweeted users is
the official account of the South Korean pop (K-pop)
group BTS, who has their own community. The com-
munities for the top ten most retweeted users are pre-
sented in Table 3 and a sample of tweets from the
pro-BLM and anti-BLM communities are presented
in Table 4.
Note how the textual content of the tweets from
the two communities differ. By going through the la-
bel propagation algorithm we seem to have identified
the two different political camps. Moreover, we note
that usage of the hashtag #BlackLivesMatter is promi-
nent in the anti-BLM community. Thus, we can con-
clude that just filtering by the anti-BLM #AllLives-
Matter and #BlueLivesMatter would not have sufficed
to identify these communities.
Thus, through the use of (1) retweet network,
which encodes retweets, one of the clearest signals of
directional ideological concurrence of the retweeter
with the tweeter, (2) distributed label propagation
on such a retweet network to detect communities of
users who are in ideological concurrence within each
community, and finally (3) listing the top K most
retweeted tweets within each such community, we
have a simple yet effective mechanism to explore the
ideological diversity that is representative of the com-
munities, independent of their sizes and activity lev-
els, i.e., the number of users and intensity of inter-
actions in Twitter. We found this simple three-step
process to be an effective approach to identifying the
pro/anti-BLM tweets before further analysis.
5 JOINT MEDIA MODELING
In this Section we examined the interplay between
the Twitter and GDELT data sets by looking at
the Granger causality between them. For this we
proposed simple two-dimensional Hawkes processes
with an exponential kernel. The timeline for this joint
modeling was three days after the death of George
Floyd over the 24-hours-long period between mid-
night of 28 May and midnight of 29 May, which is
when the protests had just started to spread nation-
wide across the US, and also become violent.
5.1 Model and Data
In dimension one we had the Twitter data. To control
the magnitude of the data we only considered original
tweets, i.e. all retweets were filtered out, that had at
least one retweet, to filter out tweets made by users
with a negligible following. Moreover, we examined
the 20 largest communities and identified one anti-
BLM (the same community identified in the previ-
ous section), and filtered out all tweets made by users
from that community, so that we only considered pro-
BLM tweets. This left us with 10,774 tweets.
In the second dimension we had records from
the GKG-database from GDELT. The records were
first filtered on mentioned themes, and only those re-
porting events of protests were selected. This natu-
rally lead to some noise in the data, due to not be-
ing able to precisely filter out only the events men-
tioning protests relating to the Black Lives Matter-
movement. To reduce this noise, we also filtered on
records that mentioned George Floyd. While in the-
ory a record could report a BLM related protest with-
out mentioning George Floyd, we reasoned that since
our timeline of interest was three days after his pass-
ing, most records should mention George Floyd to
give the reader some context for the reported protest.
To handle that the GKG-database updates in inter-
vals every 15 minutes, every record got a randomised
timestamp in the fifteen minute interval prior to it be-
ing added into the database, to get the records in con-
tinuous time. With this query in the selected time in-
terval, 3,341 records were found.
Given this data, we jointly model events in social
and mass media by fitting the multivariate Hawkes
process in Definition 2.3. We want to test whether
or not Granger causation exists between dimensions
1 and 2 representing events in Twitter and events in
mass media from the GDELT project, respectively.
As per Theorem 2.1, parameter α
12
= 0 if and only
if mass media events do not Granger cause Twitter
events, and vice versa for α
21
= 0.
Hawkes Processes on Social and Mass Media: A Causal Study of the BlackLivesMatter Movement in the Summer of 2020
85

Table 4: Sample tweets from the pro-BLM and anti-BLM communities.
Pro-BLM community
i can’t stand by and continue to live in a world where the color of your skin is an automatic target on my family, friends, and neighbors backs.
tri-city we must come together to support our communities. THIS. IS. AMERICA. BE THE CHANGE YOU WANT TO SEE. #blacklivesmatter
https://t.co/XIDSNqgx6Q
Thread of people who took it upon themselves to trivialise the current situation going on and #BlackLivesMatter
#BlackLivesMatter Houston is hosting a protest march this FRIDAY at 2PM starting at Discovery Green demanding justice for #GeorgeFloyd White
allies, y’all gotta do better and this is a place to start. Everyone who’s able should be there. https://t.co /EbWeBrZneP
Aiyana Jones a 7 YEAR OLD CHILD who was shot in the head by an officer, when the officer raided the wrong house. A 7 year old girl didn’t deserve
to be killed because of disgusting reckless officers. Acab and BLM, never forget this girls name! #BlackLivesMatter https://t.co/HCWzabkFv4
So protest in Huntsville, TX was small, but that was no surprise. We’re a small town and most things just caught up to the present on the outside...at the
end of the protest on my way home, I saw something I never noticed. This is why we do what we do. #BlackLivesMatter https://t.co/gTuCilB7mi
Anti-BLM community
Black people are 80 times more likely to kill white people in England/Wales than the reverse! And yet, #BlackLivesMatter more than others? EXPLAIN...
Check the stats: https://t.co/DmPDVVGbSo https://t.co/qxXmuNIh2X
#BlackLivesMatter should now be classified as an extreme political hate group.. Simple.. https://t.co/mFh56qCpo9
#DontTakeTheKnee #DontTakeTheKnee please get this trending Sick & tired of the #ScumMedia telling us what we should do! Well I say #Dont-
TakeTheKnee #BLM is a terrorist organisation. Do your homework! #AllLivesMatter #WhiteLivesMatter #ISTANDwithDominic Raab @SkyNews
Then someone gets stabbed and they want the police back after running them out of town. Ha you couldn’t make it up #BlackLivesMatter #blm #thugs
#brixton https://t.co/1uVXQ63UT2
Just saw a video of #BlackLivesMatter protest in #Reading - looks like 3 white people have been stabbed and in a bad way! Now if this turns out to be a
race attack, I’m going to blame the #Media. They’ve been stoking up tensions between blacks and whites for weeks now!
5.2 Results
The data was fitted using python library tick
9
.
tick requires that the decay parameters β
i j
are given
as constants beforehand, which then allows highly ef-
ficient fitting of the remaining parameters µ
i
and α
i j
,
using accelerated gradient descent (Bacry and Muzy,
2016). The problem of fitting the decay parameter β
in the exponential kernel is well-known (Santos et al.,
2021), and is due to the fact that while the baseline
parameter µ and excitation parameter α can be effi-
ciently computed via convex optimisation, this is not
always true for β. With this in mind, we proposed
three different models where the decay parameters β
i j
were handled differently:
• M
0
: β
i j
= 1, ∀(i, j) ∈ {1,2} × {1,2} =: {1,2}
2
• M
1
: β
i j
= β ∈ (0,∞), ∀(i, j) ∈ {1,2}
2
• M
2
: β
i j
∈ (0,∞), ∀(i, j) ∈ {1,2}
2
To compare the different models, we looked at (i)
the Akaike information criterion AIC = 2k − 2ln(
ˆ
L),
where k is the number of estimated parameters, and
ˆ
L is the maximum likelihood of the model, (ii) the
relative likelihood exp((AIC
p
− AIC
q
)/2), where the
AIC values for models p and q satisfy AIC
p
<
AIC
q
, and (iii) the likelihood-ratio test statistic λ
LR
=
−2ln(
ˆ
L
p
/
ˆ
L
q
).
5.2.1 Comparison Between M
0
and M
1
Setting β
i j
= 1 for all i, j in model M
0
gave us the log-
likelihood value of 372.981, and AIC = −733.963
9
https://x-datainitiative.github.io/tick/
(where k = 6 for the two estimated baseline param-
eters µ
i
and the four excitation parameters α
i j
. For
model M
1
, we did a sequential grid-search over β’s,
by using the convex optimiser in ticks to quickly
obtain the most likely µ
i
and α
i, j
’s for each fixed
β
i, j
= β, to find the most likely parameter
ˆ
β = 6.17,
with the maximum log-likelihood value of 384.771
and AIC = −755.542 (where k = 7 since we now also
estimate β).
The relative likelihood of the models was
2.0624 × 10
−5
, i.e., model M
0
was 2.0624 × 10
−5
times as probable as model M
1
to minimize the in-
formation loss. Since M
0
is nested in M
1
, i.e., the pa-
rameter space of M
0
is a proper subset of that of M
1
,
we do a likelihood ratio test and reject M
0
in favour
of M
1
(λ
LR
= 23.5781,p-value < 10
−7
).
5.2.2 Comparison Between M
1
and M
2
Model M
1
and M
0
assume that the decay parameters
β
i j
’s are identically β ∈ (0,∞), i.e., the decay param-
eter within each dimension and between every pair
of dimensions is given by the same value. The real-
world interpretation of this is that tweets and mass
media reports stay relevant for the same amount of
time into the future, which seems like a major as-
sumption as mass media dissemination and social me-
dia communication are fundamentally different in na-
ture. To account for this, we introduced model M
2
,
where each β
i j
can vary freely in (0,∞).
We did a sequential grid search over the 4-
simplex, similar to the one-dimensional case of M
1
.
We found the most likely values to be
ˆ
β
11
=
ˆ
β
22
=
DATA 2023 - 12th International Conference on Data Science, Technology and Applications
86

16.170,
ˆ
β
12
= 3.702, and
ˆ
β
21
= 8.638, at the max-
imum log-likelihood value of 384.772, with k = 10
and AIC = −749.544. Note that despite having three
additional parameters, the maximum log-likelihood
of M
2
is close to that of M
1
, with the relative likeli-
hood of the models, likelihood-ratio test statistic, and
p-value being 0.04984, 0.002121, and 0.9971, respec-
tively. We therefore do not reject M
1
in favour of M
2
and choose M
1
for further analysis.
5.2.3 Fitting the Data Using M
1
To find whether Granger causality between the two
dimensions exists, we were interested in whether pa-
rameters
ˆ
α
12
,
ˆ
α
21
are equal to 0 or not. Fitting the data
using model M
1
with estimated decay parameter
ˆ
β =
6.1700 gave us the following estimated parameters
ˆµ
1
= 1.000, ˆµ
2
= 0.998,
ˆ
α
11
= 0.986,
ˆ
α
12
= 0.0327,
ˆ
α
21
= 0.0216,
ˆ
α
22
= 0.921. Note that the point esti-
mates satisfying:
ˆ
α
12
>
ˆ
α
21
> 0, implies that there ex-
ists Granger causality between reported protests and
tweets regarding the BLM-movement, provided we
account for the errors in their estimation, i.e., their
confidence intervals. We address this next using non-
parametric bootstraps.
5.2.4 Hypothesis Testing
The following null hypotheses were proposed:
• H
0,12
: α
12
= 0, i.e., reports of protests in mass me-
dia do not Granger-cause communication events
in Twitter related to the BLM-movement.
• H
0,21
: α
21
= 0, i.e., communication events in
Twitter related to the BLM-movement do not
Granger-cause reports of protests in mass media.
• H
0
: α
12
= α
21
= 0.
To get the confidence intervals for α
12
,α
21
we did a
non-parametric bootstrap by sampling the observed
data with replacement, and then estimating the param-
eters on the bootstrapped data under model M
1
. This
was repeated 1000 times.
For α
12
, i.e., the influence of mass media on Twit-
ter, the 99-th percentile bootstrapped confidence in-
terval is (0.000, 0.09405), and therefore we cannot re-
ject the null hypothesis H
0,12
that α
12
= 0 by the Wald
test. Thus, the reports of street protests in mass me-
dia do not Granger-cause the pro-BLM interactions in
Twitter.
On the other hand, the 99-th percentile boot-
strap confidence interval for the parameter α
21
that models Twitter’s influence on mass media is
(0.01479,0.02949), and therefore we reject the null
hypothesis H
0,21
that α
21
= 0 by the Wald test. Thus,
the pro-BLM interactions in Twitter Granger-cause
the reports of street protests in mass media. We there-
fore also reject the common null hypothesis that there
is no Granger causality whatsoever between social
and mass media events around the BLM-movement,
i.e., H
0
: α
12
= α
21
= 0.
To estimate type I error, i.e., the probability of
rejecting the null hypothesis H
0
, when it is true, we
simulated data from the null hypothesis H
0
, i.e., from
the most likely parameters in M
1
, while restricting
α
12
= α
21
= 0. For each such simulated data, we then
performed the Wald test using non-parametric boot-
straps by sampling the data with replacement 1,000
times. Only one out of 100 such simulations from H
0
was rejected giving 0.01 as the Monte Carlo estimate
of the Type I error.
6 CONCLUSION
We jointly model and test hypotheses about causal
relationships between interactions in social media
and the reports in mass media during the Black
Lives Matter (BLM) protests following the death
of George Floyd, by implementing open-source
pipelines through MEP and SPARK-GDELT to pro-
cess the data, i.e., extract, load, transform, explore,
from scratch and at scale, on cloud infrastructure,
and by employing self-exciting Hawkes processes and
their Granger causal inference machinery.
We reject the null hypothesis that there is no
causal relationship, and show that communication
events in Twitter, surrounding tweets that supported
the BLM movement, Granger-caused the reports
of street protests in mass media from the GDELT
project. However, we cannot show that the reporting
of street protests in mass media Granger-caused the
corresponding communication events in Twitter. We
identified such pro-BLM tweets thorough a network
analysis of the Twitter data to identify communities
of users who have a shared ideology among an ideo-
logically diverse set of communities.
We thus establish a verifiable causal relationship
between social media interactions in Twitter that are
supportive of the global BLM social movement on
one hand, and global mass media reports of street
protests in solidarity with the movement on the other.
This suggests that activists have harnessed social me-
dia to raise awareness and mobilise street protests.
ACKNOWLEDGEMENTS
We thank three anonymous reviewers for their in-
sightful comments. AL was supported by a sum-
Hawkes Processes on Social and Mass Media: A Causal Study of the BlackLivesMatter Movement in the Summer of 2020
87

mer internship at Combient Competence Centre for
Data Engineering Sciences. SL and RS were par-
tially supported by Swedish Research Council project
no. 2019-03351 and RS was partially supported by
the Wallenberg AI, Autonomous Systems and Soft-
ware Program funded by Knut and Alice Wallenberg
Foundation. Computing infrastructure was supported
by Databricks University Alliance and AWS, and this
publication’s cost was sponsored by VakeWorks AB.
REFERENCES
Armbrust, M., Das, T., Sun, L., Yavuz, B., Zhu, S.,
Murthy, M., Torres, J., van Hovell, H., Ionescu, A.,
Łuszczak, A., Witakowski, M., Szafra
´
nski, M., Li,
X., Ueshin, T., Mokhtar, M., Boncz, P., Ghodsi, A.,
Paranjpye, S., Senster, P., Xin, R., and Zaharia, M.
(2020). Delta lake: High-performance acid table stor-
age over cloud object stores. Proc. VLDB Endow.,
13(12):3411–3424.
Armbrust, M., Xin, R. S., Lian, C., Huai, Y., Liu, D.,
Bradley, J. K., Meng, X., Kaftan, T., Franklin, M. J.,
Ghodsi, A., and Zaharia, M. (2015). Spark sql: Re-
lational data processing in spark. In Proceedings
of the 2015 ACM SIGMOD International Confer-
ence on Management of Data, SIGMOD ’15, page
1383–1394, New York, NY, USA. Association for
Computing Machinery.
Bacry, E., Mastromatteo, I., and Muzy, J.-F. (2015).
Hawkes processes in finance. arXiv.org.
Bacry, E. and Muzy, J.-F. (2016). First- and Second-Order
Statistics Characterization of Hawkes Processes and
Non-Parametric Estimation. IEEE TRANSACTIONS
ON INFORMATION THEORY, VOL. 62.
Boyd, D., Golder, S., and Lotan, G. (2010). Tweet, tweet,
retweet: Conversational aspects of retweeting on twit-
ter. In Proceedings of the 2010 43rd Hawaii Inter-
national Conference on System Sciences, HICSS ’10,
pages 1–10, Washington, DC, USA. IEEE Computer
Society.
Buchanan, L., Bui, Q., and Patel, J. K. (3 July 2020). Black
Lives Matter May Be the Largest Movement in U.S.
History. New York Times.
Daley, D. and Vere-Jones, D. (2003). An Introduction to the
Theory of Point Processes: Volume I: Elementary The-
ory and Methods, Second Edition. Springer-Verlag.
Deliso, M. (21 April 2021). ABC News - Timeline: The
impact of George Floyd’s death in Minneapolis and
beyond. ABC News.
Eichler, M., Dahlhaus, R., and Dueck, J. (2012). Graphi-
cal Modeling for Multivariate Hawkes Processes with
Nonparametric Link Functions. Probability Theory
and Related Fields.
Falcon, A. (2019). Aristotle on Causality. The Stanford
Encyclopedia of Philosophy (Spring 2019 Edition).
Giorgi, S., Guntuku, S. C., Rahman, M., Himelein-
Wachowiak, M., Kwarteng, A., and Curtis, B. (2020).
Twitter Corpus of the #BlackLivesMatter Movement
And Counter Protests: 2013 to 2020.
Goldstein, J. S. (1992). A conflict-cooperation scale for
weis events data. Journal of Conflict Resolution,
36(2):369–385.
Gonzalez, J. E., Xin, R. S., Dave, A., Crankshaw, D.,
Franklin, M. J., and Stoica, I. (2014). Graphx: Graph
processing in a distributed dataflow framework. In
Proceedings of the 11th USENIX Conference on Oper-
ating Systems Design and Implementation, OSDI’14,
page 599–613, USA. USENIX Association.
Granger, C. (1980). Testing for Causality - A Personal
Viewpoint. Journal of Economic Dynamics and Con-
trol 2.
Hawkes, A. G. (1971). Spectra of Some Self-Exciting
and Mutually Exciting Point Processes. Biometrika,
58:83–90.
Jackson, S. J., Bailey, M., and Foucault Welles, B. (2020).
#HashtagActivism: Networks of Race and Gender
Justice. The MIT Press.
Jansen, B. J., Zhang, M., Sobel, K., and Chowdury, A.
(2009). Twitter power: Tweets as electronic word of
mouth. J Amer Soc Info Science Tech, 60(11):2169–
2188.
Leetaru, K. and Schrodt, P. A. (2013). Gdelt: Global data
on events, location, and tone. ISA Annual Convention.
Malewicz, G., Austern, M. H., Bik, A. J., Dehnert, J. C.,
Horn, I., Leiser, N., and Czajkowski, G. (2010).
Pregel: a system for large-scale graph processing. In
Proceedings of the 2010 ACM SIGMOD International
Conference on Management of data, pages 135–146.
Metaxas, P., Mustafaraj, E., Wong, K., Zeng, L., O’Keefe,
M., and Finn, S. (2015). What do retweets indicate?
results from user survey and meta-review of research.
In International AAAI Conference on Web and Social
Media. ACM.
Muphy, D. (13 April 2014). 44 Percent of Twitter Accounts
Have Never Tweeted. PCMag UK.
Ngo, A. (2021). Unmasked: Inside Antifa’s Radical Plan to
Destroy Democracy. Center Street.
Pierris, G. D. and Friedman, M. (2018). Kant and Hume on
Causality. The Stanford Encyclopedia of Philosophy
(Winter 2018 Edition).
Raghavan, U. N., Albert, R., and Kumara, S. (2007). Near
linear time algorithm to detect community structures
in large-scale networks. Physical Review E, 76.
Sainudiin, R., Yogeeswaran, K., Nash, K., and Sahioun, R.
(2019). Characterizing the twitter networks of promi-
nent politicians and splc-defined hate groups in the
2016 us presidential election. Social Network Anal-
ysis and Mining, 9(34).
Santos, T., Lemmerich, F., and Helic, D. (2021). Surfac-
ing Estimation Uncertainty in the Decay Parameters
of Hawkes Processes with Exponential Kernels.
Schrodt, P. A. (2012). CAMEO - Conflict and Mediation
Event Observations Event and Actor Codebook.
DATA 2023 - 12th International Conference on Data Science, Technology and Applications
88
