
A Convolutional Neural Network Model for Prediction of ICU
Performance Metrics: Time Series and Image Transformation
Approaches
Ömer Kaan Karahan
1
, Yasin Ulukuş
2
and Çiğdem Eroğlu Erdem
1
1
Department of Computer Engineering, Marmara University, Istanbul, Turkey
2
Department of Industrial Engineering, Istanbul Technical University, Istanbul, Turkey
Keywords: SOFA, ICU, CNN, Multivariate Timeseries, Readmission, Mortality in ICU, Mortality after Discharge from
ICU, Length of Stay in ICU.
Abstract: In our study we used Convolutional Neural Network (CNN) to predict Intensive Care Unit (ICU)
performances of patients via images generated from patients’ Sequential Organ Failure Assessment (SOFA)
scores which are used to assess the acute morbidity of intensive care unit patients. In our study we propose a
novel method to predict ICU performances; mortality during the stay in ICU, mortality in one year after
discharge from ICU, readmission and length of stay of ICU patients. We trained CNN models with images
generated from multivariate time series data. Our model development process consists of two steps;
converting SOFA scores of patients into an image and training the CNN with generated images to predict
patients’ ICU performances. We search for the best performing image generation algorithm which has the
highest AUROC value for each prediction. Our model gives us AUROC values for mortality in ICU,
readmission after discharge from ICU and length of stay of patients in ICU as 0.83, 0.84, 0.87, 0.56
respectively. We compare our methods’ performance with random forest, support vector machine, Logistic
regression and ensemble of these algorithms. The proposed image-based method in which we use the first day
SOFA scores outperform the random forest, support vector machine and logistic regression algorithms. Our
method performed similar to the studies in literature in terms of predicting mortality in ICU using first day
data with an AUROC value of 0.83. Our model’s performance would be improved with further feature
engineering.
1 INTRODUCTION
Throughout all stages of the COVID-19 pandemic,
ministries of health, hospital administrations and
medical institutions noticed the importance of
management of Intensive Care Units (ICU). Both
administrative and medical departments of medical
institutions are in search of an insight about patients’
length of stay, mortality rates and readmission rates
after they are discharged from the ICU. Management
of medical facilities and medical resources appears as
the key factors for fighting the COVID-19 pandemic.
Even though importance of efficient utilization of
intensive care units became apparent during the
COVID-19 pandemic, there have already been
studies carried out since 1970s on predicting
mortality rates via medical records. Hospital
managers need reliable information for planning
utilization of facilities and resources. As Roehrig et
al. (Roehrig, 2015) stated that time of discharge as
early as possible from ICU may play an important
role for developing strategies of resource
consumption optimization; however, unplanned
readmission of hospitalized patients to an ICU can
cause unwanted outcomes. Patients who are
discharged from the ICU may need to be readmitted
to the ICU after a short period of time. The high
number of unplanned readmissions leads to
unnecessary expenses in healthcare, lowers the
patients’ quality of life, and increases the risk of
hospital-acquired infections and/or complications
(Goldfrad, 2000).
In addition to managerial and administrative
needs of hospitals, medical doctors need to know the
severity of the patients’ cases to make decisions on
treatment methods and inform both patients and their
relatives about the possible outcomes of the treatment
Karahan, Ö., Uluku¸s, Y. and Erdem, Ç.
A Convolutional Neural Network Model for Prediction of ICU Performance Metrics: Time Series and Image Transformation Approaches.
DOI: 10.5220/0011925500003414
In Proceedings of the 16th International Joint Conference on Biomedical Engineering Systems and Technologies (BIOSTEC 2023) - Volume 5: HEALTHINF, pages 671-679
ISBN: 978-989-758-631-6; ISSN: 2184-4305
Copyright
c
2023 by SCITEPRESS – Science and Technology Publications, Lda. Under CC license (CC BY-NC-ND 4.0)
671

process. Therefore, monitoring the wellbeing of
intensive care unit patients and/or severity of the
cases of the patients are used as a predictor for ICU
performances of patients in concern (Woldhek,
2017). These studies also provided us feedback about
the performance of measurements on predicting the
conditions of the patients.
Predicting the length of stay, mortality, and
readmission is critical in efficiently managing the
ICUs (Garrison, 2017). Studies discussed the
necessity of utilizing different variables and more
sophisticated machine learning techniques to improve
the models’ prediction performance (Low, 2015). In
this study we investigate the CNN model which uses
the recorded time series of an ICU patient as input.
We convert the time series data to images and train
the CNN model with these images. Recorded data can
be classified under three segments; universal
categorical segmentation features such as age, gender
etc., domain based categorical segmentation features
such as ICU type, comorbidity etc., and domain-
based measurements such as clinical and laboratory
data recorded in certain time intervals. Domain-based
measurements are the data collected during the stay
in ICU.
Domain-based measured features can also be used
to create scoring systems such as Acute Physiology
and Chronic Health Disease Classification System II
(APACHE II), Simplified Acute Physiology Score 3
(SAPS 3) and Sepsis Sequential Organ Failure
Assessment (SOFA). These scoring systems are built
from clinical and laboratory measurements aimed to
be used for building prognostic models for in hospital
mortality (Moreno, 2006).
SOFA scores which would take a value between
one and four, are used as measures for severity of the
case of a patient in six categories; cardio, nervous,
renal, liver, coagulation, and respiratory (Vincent,
1996). Such scoring systems produced from clinical
measurements are used as predictors for the length of
stay and mortality rate after discharge. After 1990s
SOFA score gained importance for scoring severity
of cases of ICU patients (Seymour, 2016). We
produce SOFA scores from clinical values measured
for each patient by medical personnel. There is a
reference chart to calculate SOFA scores (Singer,
2016).
In our study we use SOFA scores of the patients
as principal features to create prognostic machine
learning models built to predict length of stay in ICU,
mortality rates during and after discharge and
predicting whether an ICU patient is going to be
readmitted or not in one year after discharge. In
addition to machine learning models, our distinct
focus is on employing 2D Convolutional Neural
Networks (CNN) to predict ICU performances of
patients. First, we generate images to train the CNN
using first day SOFA scores and investigate the best
performing image generation algorithm. After finding
out the best performing image generation algorithm
we evaluate various epoch and batch size
combinations to improve the performance of the
CNN. We predicted mortality in ICU with an
AUROC value of 0.83 which is better than the
findings of the Brito et al. They predicted the
mortality in ICU with an AUROC value of 0.82 via
using admission SOFA scores (Brito, 2017).
2 LITERATURE REVIEW
There are various studies in Literature to predict the
mortality in ICU, readmission to ICU within one year
after discharge from ICU, and length of stay in ICU.
Holder et al. concluded the importance of SOFA
scores of the first 5 days for predicting in hospital
mortality rate in a study done on a dataset of 1290
patients. However, additional SOFA scores do not
improve the performance of the integrated
discriminatory index (IDI) model. They have used the
worst SOFA scores which means that the maximum
SOFA score is used as input for multi variate analysis
(Holder, 2017).
In 2017 de Brito et al conducted a study and
arrived at the following results: SOFA’s predictive
power for binary classification of mortality in the ICU
was good in all time points. Area Under the Receiver
Operator Characteristics curves (AUROC) were 0.82
(95% CI (Confidence interval): 0.795 to 0.844) for
admission SOFA, 0.827 (95% CI: 0.795 to 0.856) for
third day SOFA and 0.827 (95% CI: 0.779 to 0.869)
for fifth day SOFA (Brito, 2017).
In 2017 Gupta et al carried out a study on 84
elderly patients who were admitted to a medical ICU.
They have used a statistical analysis with initial
SOFA values and SOFA values after admission to
ICU and concluded that there is a positive correlation
between SOFA values and mortality rates. They have
used logistic regression and their results are as
follows: for every 2 points of increase in SOFA
values the mortality rate increases 10% (Gupta,
2017). However, this study is limited to a very tiny
population of ICU patients (Medical ICU and age is
larger than 60).
Aperstein et al. have used 36 machine learning
models and the best performing model is achieved by
an ensemble of linear and logistic regression. They
have used SOFA scores and increased the robustness
CCH 2023 - Special Session on Machine Learning and Deep Learning for Preventive Healthcare and Clinical Decision Support
672

of the models by using? gastointestinal data. Most of
the models’ performances are measured with AUC
values varying between 0.8645 and 0.9146
(Aperstein, 2019).
Meyer et al. have used 44 features to predict
mortality within 90 days after discharge. They have
developed an RNN model to predict the results and
the performances of the models are measured with
AUC values and MCC (Matthew’s correlation
coefficient) values of the models. Predictive power of
the models are as follows: MCC (Matthew's
correlation coefficient) 0⋅29 (95% CI 0⋅27–0⋅32) and
AUROC 0⋅75 (0⋅73–0⋅76) at admission, 0⋅41 (0⋅39–
0⋅44) and 0⋅80 (0⋅79–0⋅81) after 24 h, 0⋅46 (0⋅43–
0⋅48) and 0⋅82 (0⋅81–0⋅83) after 72 h, and 0⋅47 (0⋅44–
0⋅49) and 0⋅83 (0⋅82–0⋅84) at the time of discharge
(Thorsen-Meyer, 2020).
In 2015 Roehrig et al. carried out a study on
comparison of effectiveness of three scoring systems;
the stability and workload index for transfer score
(SWIFT), SOFA score, therapeutic intervention
scoring system (TISS-28). They have calculated
SWIFT, SOFA and TISS values on the day of
discharge from ICU. They have used these values in
addition to length of stay and cirrhosis. They have
built stepwise logistic regression models to predict
mortality in 48 hours after discharge from ICU and
unplanned readmission. SWIFT, SOFA and TISS-28
scores are as follows: AUC 0.65, 0.65 and 0.67,
respectively, P = 0.58. All scores showed similar
predictive accuracies. They have used a dataset for
1277 patients, discharged from ICU (Roehrig, 2015).
One of the early studies on predictive power of
SOFA scores for length of stay of ICU patients is
carried out by Antonelli et al, In 1999. They have
used a dataset for 181 trauma patients. They have run
a statistical analysis using SOFA values at admission
and found out that a higher SOFA score and the
presence of infection during the admission is
correlated to higher length of stay with the following
measures: additive regression coefficients: 0.85 days
for each SOFA point, 4.4 for admission from the same
hospital, 7.26 for infection on admission (Antonelli,
1999).
In 2016 Jain et al. conducted research on
predictive power of SOFA for length of stay and
mortality rates. They have used SOFA scores 24
hours after admission and SOFA scores for every 48
hours during 10 days of stay in ICU to calculate initial
SOFA score, highest and mean SOFA scores which
are later on used as inputs for the statistical analysis.
They have found out that maximum score non-
survivors is significantly lower than the number of the
non-survivor population. ((3.92 ± 2.17) and (8.9 ±
3.45) respectively.) They didn’t share any findings
correlated to any measure of length of stay. However,
they just found out that length of stay is not correlated
to mortality (P= 0.461). Besides that, they didn’t
mention about the data size (Jain, 2016).
Converting data to images and feeding CNN
algorithms with these images has been used in various
fields. Kapanga et al. converted program behaviours
into images and built a CNN model which is fed by
these images to predict malwares (Kapanga, 2018).
Sezer et al. created images from trading data and built
an algorithmic trading model CNN-TA using a 2-D
convolutional neural network based on image
processing properties (Sezer, 2018). Yue et al
conducted a study in malware binary detection via
image classification (Yue, 2022). What makes our
study different from these conversion methods is we
search for the best conversion methodology.
3 METHODS
Following the approval of the ethical review board of
University of Pittsburgh Medical Centre, which
waived informed consent on the basis that this was an
epidemiological study without intervention SOFA
scores of 51368 patients are included in this study.
Number of total data points is 2,500,000. We
computed SOFA scores across six organ systems
using a standard definition every eight hours
throughout the ICU stays. Patients for whom there
was no data to generate SOFA scores for a particular
organ system are excluded. Where data to generate a
score exist, but are missing at a specific time point,
we linearly interpolate missing SOFA scores.
Whenever the missing data is at the end of a series,
we use the latest observation for the sake of refraining
from extrapolation. In case of multiple entries
relevant to a system score over an eight-hour interval,
we choose the value generating the highest score,
corresponding to the worse physiology.
One of the findings in the literature emphasizes
the importance of the very early changes in organ
function responses (within 1 day) in predictive model
development (Levy, 2005). Therefore, we focus on
first day SOFA scores to build predictive models.
3.1 Data Sources
We use the EHR-derived High Density Intensive Care
(HIDENIC) database of all patients admitted to one
of 12 ICUs within the University of Pittsburgh
Medical Centre Health System between 2001 and
2014. HIDENIC is a HIPAA compliant, limited
A Convolutional Neural Network Model for Prediction of ICU Performance Metrics: Time Series and Image Transformation Approaches
673
dataset that contains detailed demographic,
diagnostic, physiologic, laboratory, and drug
administration and outcome information on a source
population of ICU admissions (Sileanu, 2005),
(Kellum, 2015), (Sen, 2017), (Liang, 2016), linked to
Social Security Death Master File (SSDMF) to 2014.
The study was conducted under proper approval of
the University of Pittsburgh Institutional Review
Board.
3.2 Exploratory Analysis
In the data set 55% of the patients are male and 45%
of the patients are female. There are 7 types of ICU
admissions; 27% of patients are admitted to medical
ICU, 14.5% of the patients are admitted to surgical
ICU, 31% of patients are admitted to cardiac and
cardiac-T units, 6.2% of patients are admitted to
neurological unit, 5.5% of patients are admitted to
trauma unit, 9.7% of patients are admitted to
Transplant unit, and 6.1% of patients are admitted to
mixed intensive care unit. Percentage of mortalities
independent of which department the patients are
admitted to ICU is 8.5 %, mortalities in one year after
discharge from ICU is 25.8%, readmission in one
year after discharge from ICU is 16.5% and length of
stays for more than three days is 75.9%.
3.3 Data Preparation
We merge patients’ data and the SOFA score data
which we obtain from clinical measurements before
admission to the ICU, during the stay in ICU, and
after discharge from ICU. In our study we take into
account the SOFA scores obtained from
measurements after admission to the ICU and during
stay in the ICU. While building the predictor models
we consider the SOFA scores generated from the
clinical measurements during the stay in ICU, we do
not include the data before admission to ICU and after
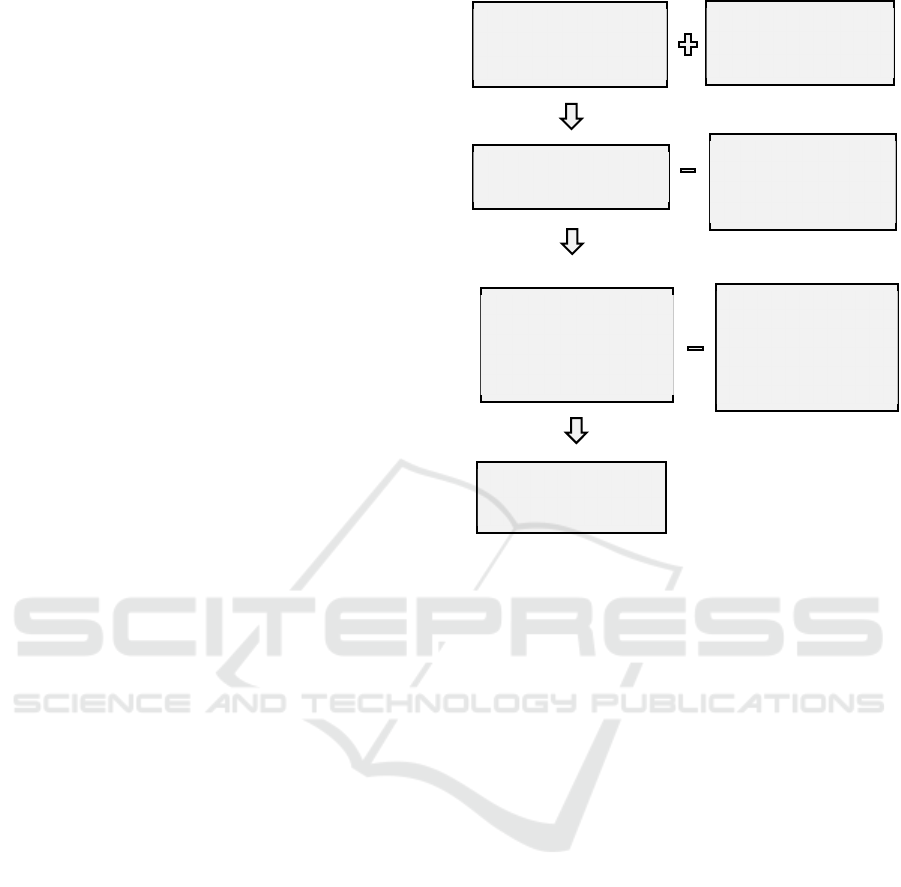
discharge from ICU. Figure 1. depicts how we
prepared the data. Since the measurements are
collected before ICU admission and we don’t want to
use the data collected before ICU admission we just
take three measurement data recorded after admission
to the ICU.
We approach the problem as a binary
classification problem. In the exploratory analysis we
noticed that the distribution of the positive (True) and
negative (False) results is not balanced. Since the
DATA is imbalanced, we balance data during training
via oversampling for training sets of each predictive
algorithm. We do not balance test data.
Figure 1: Data preparation process.
3.4 Machine Learning Algorithms
We use three machine learning algorithms and an
ensemble of these algorithms. In addition to first three
SOFA values of each category, we add an extra slope
feature for each category for the predictor data set;
twenty four predictors for each prediction. The
number at the end of each measurement category
indicates the measurement order of the relevant
category; Coagulation1 is the first measurement to
derive the coagulation SOFA value after admission to
the ICU, Coagulation2 is the second measurement to
derive the SOFA score after admission. We presume
that the time span between each measurement is every
eight hours. Predictor set for machine learning
algorithms is as follows:
Input = {Liver1, Coagulation1, Nerve1, Renal1,
Respiratory1, Cardio1, Liver2, Coagulation2,
Nerve2, Renal2, Respiratory2, Cardio2, Liver3,
Coagulation3, Nerve3, Renal3, Respiratory3,
Cardio3, Change_in_Liver,
Change_in_Coagulation, Change_in_Nerve,
Change_in_Renal, Change_in_Respiratory,
Change_in_ Cardio}
We use the random forest algorithm implemented
in the Scikit-learn library. For validation and
hyperparameter fine tuning we try four different
DATA Ready to feed
algorithms
Clinical
Measurements for
each patient
ADD Clinical
Records for each
patient
SOFA scores assigned
for each patient
EXCLUDE missing
and overlapping
records
SOFA scores assigned
for each patient with
extracted missing and
overlapping data
EXCLUDE records
before admission to
ICU and records
more than 1 day
after admission to
CCH 2023 - Special Session on Machine Learning and Deep Learning for Preventive Healthcare and Clinical Decision Support
674
hyperparameters to change: n_estimators = [10, 150,
300], max_depth= [3, None], max_features= [1, 5,
10], min_samples_leaf = [1, 25], criterion= ["gini",
"entropy"]. In addition to random forest algorithm,
we use Logistic Regression. We validate our model
with six different set of variables keeping rest of the
hyperparameters as default values. For C values we
use 10
-4
, 1, 10
20
and for penalty function we use l1
and l2. In Support Vector Machine Algorithm, we use
combinations of four different hyperparameters in the
validation process: C = [1], kernel = ['linear', 'rbf'],
gamma = [ 'scale', 'auto']. We ensembled the three
previous algorithms with a hard voting classifier with
best performing hyperparameters for each algorithm
with their best performing hyperparameters.
3.5 CNN
The data we have is a multivariate time series data
which has six dimensions spread to points in a time
line that are eight hours apart from each other. We
propose various methods to convert these data into an
image and train the CNN with these predictor images
to find out a well performing predictive model in a
binary classification problem.
We try 12 different image generation algorithms
with various canvas sizes to get the best performing
image data set generated from time series data.
Iteratively we followed these steps till we get the best
performing image set:
• Convert the time series data which has 6
variables to an identifiable image. In Figure 3.
and Figure 4. Four images are displayed.
These sample images represent input data for
negative and positive outputs. Labels of the
input images are written below the images.
• Split data to 3 sets: Train, test, validation using
the proportion (0.8, 0.1, 0.1)
• Balance the training data.
• Run CNN for the training and validation data.
• Modify the training data to find out conditions
which make the images more identifiable for
human and which give a better CNN model
performance. It is a kind of hyper-parameter
fine tuning.
As seen in Figure 2. we try 69-pixel by 129-pixel
images. As the SOFA score values increase the image
generation algorithm brings snowflake shape at the
top forefront and fades out the hexagonal shape at the
bottom. As the SOFA score values decrease
hexagonal shape becomes more apparent and
snowflake shape fades out. The images labelled as
positive usually have higher SOFA scores therefore
the snowflake shape at the top becomes more
apparent. The images labelled as negative usually
have lower SOFA scores therefore hexagonal shapes
at the bottom becomes more apparent. Since AUROC
values of CNN models created using these images is
less than 0.65, we keep looking for new image
generation methodologies.
Figure 2: Various image generation methods are used to
find out the best performing image.
In Figure 3. we represent another trial we create
concentric square frames on a 69-pixel by 69-pixel
canvas each frame represents total SOFA score of the
patient calculated for every category in every eight
hours. Whiteness of the frames decreases as the
SOFA score of the organ increases and greys out as
the SOFA score increases. This image generation
algorithm is not helpful on creatin a CNN model with
high AUROC values we discarded this image
generation approach.
Figure 3: Image generation with concentric square frames.
After twelve trials we find out that the best
performing predictor image sets can be created by
following these steps:
● Create a black canvas of 69-pixel by 69-pixel
● Get the highest total score of SOFA values of
six categories (Cardio, Nerve, Renal, Liver,
Coagulation, Respiratory) for one day of
measurements.
● Place each measurement on the -x axis of the
coordinate system as a 4-pixel by 4-pixel
squares, one after another in an increasing
order of measurement time.
A Convolutional Neural Network Model for Prediction of ICU Performance Metrics: Time Series and Image Transformation Approaches
675
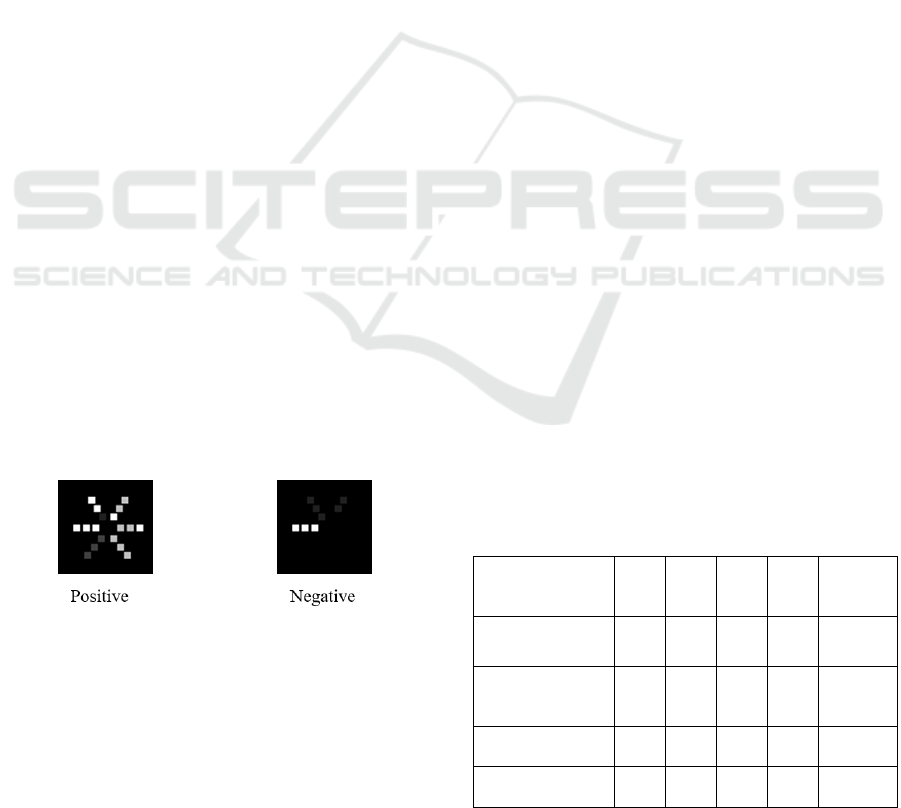
● Brightness of the squares are non-linearly
proportional to the value of the SOFA scores.
where m is the SOFA value and the result
derived from the operation dividing m by 8 or
4 is rounded to the nearest integer value. In
Yeh et al. findings patients who has qSOFA
(quick SOFA) values greater than 2 has a
length of stay significantly longer than
patients who has qSOFA values less than or
equal to 2 (Yeh, 2019). Therefore, we increase
brightness of 4-pixel by 4-pixel squares which
has SOFA scores greater than 2. The formula
for brightness of the squares is as follows:
ℎ𝑢𝑒 =
255∗𝑚/8, 𝑚 ≤ 2
255∗𝑚/4, 𝑚 > 2
(1)
● Get the second highest total score of SOFA
values out of the remaining five scores for one
day of data.
● Place the second measurement on an axis
which is sixty degrees turned from -x axis of
the coordinate system in clockwise direction.
Place 4-pixel by 4-pixel squares one after
another in an increasing order of measurement
time.
● Follow the same steps followed for the second
highest total SOFA scores as well as for the
third, fourth, fifth and sixth highest total
SOFA scores.
As a result, in the image we get three squares
placed on six axes ordered with an increasing SOFA
score on each axis with an increasing order of date of
measurement. In this method we take into account
how many of the organs are severely damaged. You
can find a typical positive and negative value image
in Figure 4. One can easily notice that as the SOFA
scores increase for a patient snowflake shape
becomes more apparent.
Figure 4: Best performing images generated for positive
and negative values.
We used various batch sizes and epochs to
determine the best parameters. Out of 12 different
shapes best predictions are obtained by generating 69-
pixel by 69-pixel images where six features are
placed on six axes as apart from each other as
possible. We try various CNN architectures best
performance is accomplished by 4-layer CNN model.
First layer has 32x3x3, second layer has 64x3x3, third
layer has a 128x3x3, and fourth layer has 256x3x3
structure with each layer having (2,2) maximum
pooling. We use a dense layer of 512x1 for flattening.
We fine tune the hyperparameters such as epoch
number, optimizer, etc. via cross validation.
4 RESULTS
We used Intel(R) Core (TM) i5-7200U CPU @
2.50GHz 2.71 GHz with 8 GB RAM to create the
models both for machine learning algorithms and
CNNs. In the case of developing machine learning
models computation time took between 50-200
seconds however in the case of creating CNN models
computation time took between 6000-7000 seconds.
Once the model is developed prediction takes less
than 1 second.
The data we used was collected from 51368
patients. Out of 51368 patients 50913 patients has
SOFA values recorded at least for the first day after
admission to ICU. We run the five algorithms
mentioned in the methods section for predicting the
four predictable.
Data was imbalanced therefore we used
oversampling via duplicating samples in the minority
class till we get an almost even number of samples for
each class. We have done the oversampling process
for all the predictions and prediction algorithms.
Confusion matrixes and F1 scores for all
predictions can be found in Table 1. Patients who
survived ICU stay, patients who are not readmitted,
patients who survived one year after discharge from
ICU and patients who stayed more than 3 days in ICU
are labelled as positive and patients who did not
survive
Table 1: Confusion matrixes and F1 score performances of
CNN models for each prediction type. TP: True Positive,
FP: False positive, FN: False negative, TN: True negative.
TP FP FN TN F1
SCORE
Mortality in ICU 3512 1150 290 142 0.83
Mortality in one
year
3485 290 989 329 0.84
Readmission 4190 59 343 500 0.95
Length of Stay 2194 1674 337 888 0.68
CCH 2023 - Special Session on Machine Learning and Deep Learning for Preventive Healthcare and Clinical Decision Support
676

4.1 Prediction of Mortality in ICU
Out of 50913 patients 37744, that is 91.5 % of
patients survived the ICU stay. 4307, which makes
8.5 %, of them died during their ICU stay. After
running the five algorithms defined in the methods
section best performance is obtained by the CNN with
a 0.83 AUROC (Area Under Receiver Operator
Characteristics) value. Random Forest algorithm with
an AUROC value of 0.72 performed slightly better
than support vector machine, logistic regression and
ensemble of these algorithms which has AUROC
values of 0.71.
4.2 Prediction of Mortality in One
Year
Out of 50913 patients 46606, which makes 74.2 % of
patients, survived the first year after discharge from
the ICU unit. 13169, which makes 25.8 %, of them
survived the first year after discharged from the ICU
unit. Best performance is obtained by the CNN
algorithm with a 0.84 AUROC value. Support Vector
Machine and Ensemble of Support Vector Machine,
Logistic Regression and Random Forest algorithm
with an AUROC value of 0.66 performed slightly
better than logistic regression and Random Forest
which has AUROC values of 0.64 and 0.62,
respectively.
4.3 Prediction of Readmission
Out of 50913 patients 42483 which makes 83.4 % of
patients readmitted in the first year after discharge
from the ICU unit. 8430, which makes 25.8 %, of
them are readmitted in the first year after discharged
from the ICU unit. Best performance is obtained by
the CNN algorithm with a 0.87 AUROC value.
Support Vector Machine has an AUROC value of
0.60, Ensemble of Support Vector Machine, Logistic
Regression and Random Forest has an AUROC value
of 0.59, logistic regression has an AUROC value of
0.58 and Random Forest has an AUROC value of
0.55 while predicting whether patients who are
discharged from ICU will be readmitted or not.
4.4 Length of Stay
We convert the problem into a binary classification
problem such that whether an ICU patient would stay
more than three days or less than or equal to three
days. Out of 50913 patients 38672 which makes 75.9
% of patients stayed more than three days in the ICU
unit. 12241, which makes 24.1 %, of them stayed less
than or equal to three days in the ICU. After running
five algorithms defined in the methods section best
performance is obtained by the SVM algorithm with
a 0.61 AUROC value. Support Vector Machine and
Ensemble of Support Vector Machine, Logistic
Regression and Random Forest algorithm with an
AUROC value of 0.63 performed slightly better than
logistic regression and Random Forest which has
AUROC values of 0.58 and 0.59, respectively.
5 CONCLUSIONS
We investigated four machine learning algorithms
and a CNN algorithm for predicting four features of
ICU patients. The CNN model for predicting
mortality in ICU, death in one year and readmission
after discharge from ICU performs better than
machine learning algorithms. However, ensemble of
Random Forest, Logistic Regression and support
vector machine classifiers performed better compared
to CNN algorithm on predicting length of stay to be
more than three days or less than or equal to three
days.
When we compare our results with previous
studies which has high predictive performances, we
notice that our method performs close enough to the
well performing models in the literature. For instance,
we found an AUROC value of 0.83 for predicting
mortality in ICU and Brito et al. predicted the
mortality in ICU with an AUROC value of 0.82 via
using admission SOFA scores (Brito, 2017).
Aperstein et al. tried various methods with additional
data such as gastrointestinal data and developed a
model for predicting mortality in ICU which has a
performance with AUROC values between 0.86 and
0.91 (Aperstein, 2019). Their study encourages us to
generate images with additional features to improve
performance of our method.
For further development and performance
increase we can incorporate other features such as
comorbidity and previous number of stays in the ICU
units. More research can be done adding other
features to calculate the hue of the squares for further
research In the CNN method we use.
One of the shortfalls of our approach is generating
images from temporal data which results in as a
computational burden on the system. However, the
images created can convey the message directly to the
hospital administration. To be able to overcome this
computational cost we recommend to create a well-
designed data pre-processing pipeline.
In our study, best performing model is achieved
after doubling the intensity of the squares for the
A Convolutional Neural Network Model for Prediction of ICU Performance Metrics: Time Series and Image Transformation Approaches
677

SOFA values higher than two as compared to SOFA
values less than or equal to two. SOFA values do not
have a linear proportionality in terms of severity of
the patients. This finding is in accordance with the
findings of Yeh et al. who found out that patients who
has qSOFA values greater than 2 has a length of stay
significantly longer than patients who has qSOFA
values less than or equal to 2 (Yeh, 2019)
Results show that our approach could be applied
to multi variate short time series problems. It can be
considered as a kind of feature engineering. Number
of squares in an image and the intensity of the hue in
the squares can be adjusted after taking into account
the domain information.
After each iteration of generating algorithm, the
images are reconsidered by humans for a better
performing image generation process. Therefore, it
has a subjective aspect. This subjective aspect would
result in both short falls and better performances in
prediction.
ACKNOWLEDGEMENTS
This study has been supported by the Istanbul
Technical University Research Coordination and
Support Office under grant ID MAB-2021-42828.
REFERENCES
Roehrig C., Rosa R. G., Ascoli A. M., Madeira L., Rutzen
W., Maccari J., Balzano P., Antonio A.C., Castro P.,
Oliveira R. P., Teixeira C., (2015), Comparison of
unplanned intensive care unit readmission scores: a
prospective cohort study, Intensive Care Medicine
Experimental, Volume 3, suppl. 1, October 2015
Goldfrad C, Rowan K. (2000), Consequences of discharges
from intensive care at night. Lancet (London, England).
2000;355:1138–42. doi:10.1016/S0140-
6736(00)02062-6.
Woldhek AL, Rijkenberg S, Bosman RJ, van der Voort
PHJ. (2017), Readmission of ICU patients: A quality
indicator? J Crit Care, 2017;38:328–34.
doi:10.1016/j.jcrc.2016.12.001
Garrison, G. M., Robelia, P. M., Pecina, J. L., & Dawson,
N. L. (2017). Comparing performance of 30‐day
readmission risk classifiers among hospitalized primary
care patients. Journal of evaluation in clinical practice,
23(3), 524-529.
Low, L. L., Lee, K. H., Ong, H., et al. (2015). Predicting
30-day readmissions: performance of the LACE index
compared with a regression model among general
medicine patients in Singapore. BioMed research
international, 2015.
Moreno R. P., Metnitz P. G. H., Almeida E., Jordan B.,
Bauer P., Campos R. A., et al. (2006 ). SAPS 3—from
evaluation of the patient to evaluation of the intensive
care unit. Part 2: development of a prognostic model
for hospital mortality at ICU admission., Intensive Care
Med, Volume 31, May 2006.
Vincent J.L., Moreno R., Takala J., et al, (1996). Working
Group on Sepsis-Related Problems of the European
Society of Intensive Care Medicine. The SOFA (Sepsis-
related Organ Failure Assessment) score to describe
organ dysfunction/failure. Intensive Care Med.,
Volume 22, pp.707-710, July 1996
Seymour C. W., Liu V. X., Iwashyna T. J., Brunkhorst F.
M., Rea T. D., Scherag A., Rubenfeld G., Kahn J. M.,
Shankar-Hari M., Singer M., Deutschman C. S.,
Escobar G. J., Angus D. C., (2016). Assessment of
Clinical Criteria for Sepsis For the Third International
Consensus Definitions for Sepsis and Septic Shock
(Sepsis-3). JAMA Volume 315, Number 8, pp. 763-
773, February 23, 2016
Singer M., Deutschman C.S., Seymour C.W., Shankar-Hari
M., Annane D., Bauer M., Bellomo R., Bernard G. R..,
Chiche J. D., Coopersmith C. M., Hotchkiss R. S.,
Levy M. M., Marshall J. C., Martin G. S., Opal S. M.,
Rubenfeld G. D., der Poll T., Vincent J. L., Angus D.
C., (2016) The Third International Consensus
Definitions for Sepsis and Septic Shock (Sepsis-3).
JAMA Volume 315, Number 8, pp. 801-810, February
23, 2016.
Holder A. L., Overton E., Lyu P., Kempker J. A., Nemati
S., Razmi F., Martin G. S., Buchman T. G., Murphy D.
J., (2017). Serial daily organ failure assessment beyond
ICU day 5 does not independently add precision to ICU
risk-of-death prediction. Crit Care Med., vol. 45, pp.,
December 2017.
Brito M. R., de Barros A.G., Valler L., Cardoso F. B.,
Gasparotto A.P.D.C., Silva L.T., Coelho C. B. T.,
Dragosavac D., Falcão A. E., (2017). Evaluation of
Sequential Organ Failure Assessment (SOFA)
Performance in Neurocritical Care Patients Overtime:
A Retrospective Cohort Study. Journal of Brain
Disorders, Volume 1, pp. 38-41, January 2017
Gupta V., Karnik N. D., Agrawal D., (2017). SOFA Score
and Critically Ill Elderly Patients. Journal of The
Association of Physicians of India Volume. 65, pp. 47-
50, July 2017
Aperstein Y., Cohen L., Bendavid I., Cohen J., Grozovsky
E., Rotem T., Singer P., (2019). Improved ICU
mortality prediction based on SOFA scores and
gastrointestinal parameters. PLoS ONE, Volume 14
(9), September 30 2019
Thorsen-Meyer H.-C., Nielsen A. B., Nielsen A. P., Kaas-
Hansen B. K., Toft P., Schierbeck J., Strøm T., Chmura
P. J., Heimann M., Dybdahl L., Spangsege L., Hulsen
P., Belling K., Brunak S., A. Perner, (2020). Dynamic
and explainable machine learning prediction of
mortality in patients in the intensive care unit: a
retrospective study of high-frequency data in electronic
patient records. Lancet Digit Health, Volume 2, pp.
179-191, April 2020
CCH 2023 - Special Session on Machine Learning and Deep Learning for Preventive Healthcare and Clinical Decision Support
678

Antonelli M., Moreno R., Vincent J. L., Sprung C. L.,
Mendoça A., Passariello M., Riccioni L., Osborn J.,
(1999). Application of SOFA score to trauma patients.
Intensive Care Med., Volume 25, pp. 389-394, 1999
Jain A., Palta S., Saroa R., Palta A., Sama S., Gombar S.,
(2016). Sequential organ failure assessment scoring
and prediction of patient's outcome in Intensive Care
Unit of a tertiary care hospital. J Anaesthesiol Clin
Pharmacol, Volume 32(3), pp. 364–368, July-
September 2016
Kapanga E. K., Kim C. H., (2018)., Malware Images
Classification Using Convolutional Neural Network.,
Journal of Computer and Communications, June 2018.
Sezer O. B., Ozbayoglu A. M., (2018)., Algorithmic
financial trading with deep convolutional neural
networks: Time series to image conversion approach.,
Applied Soft Computing, April 13 2018
Yue S., Wang T., (2022). Imbalanced Malware Images
Classification: a CNN based Approach. Arxive.org,
February 20 2022
Levy M. M., et al., (2005). Early changes in organ function
predict eventual survival in severe sepsis. Crit Care
Med., Volume 33(10), pp. 2194–201., October 2005
Sileanu FE, Murugan R, Lucko N, Clermont G, Kane-Gill
SL, Handler SM, et al. (2014). AKI in Low-Risk versus
High-Risk Patients in Intensive Care. Clin J Am Soc
Nephrol 2014. doi:10.2215/CJN.03200314.
Kellum JA, Sileanu FE, Murugan R, Lucko N, Shaw AD,
Clermont G. (2015). Classifying AKI by Urine Output
versus Serum Creatinine Level. J Am Soc Nephrol
2015;26:2231–8. doi:10.1681/ASN.2014070724.
Sen A, Keener CM, Sileanu FE, Foldes E, Clermont G,
Murugan R, et al. (2017). Chloride Content of Fluids
Used for Large-Volume Resuscitation Is Associated
With Reduced Survival. Crit Care Med 2017;45:e146–
53. doi:10.1097/CCM.0000000000002063.
Liang K V, Sileanu FE, Clermont G, Murugan R, Pike F,
Palevsky PM, et al. (2016). Modality of RRT and
Recovery of Kidney Function after AKI in Patients
Surviving to Hospital Discharge. Clin J Am Soc
Nephrol 2016;11:30–8. doi:10.2215/CJN.01290215.
Yeh C. C., Chen Y. A., Hsu C. C., Chen J. H., Chen W. L.,
Huang C. C., Chung J. Y., (2019). Quick-SOFA score ≥
2 predicts prolonged hospital stay in geriatric patients
with influenza infection. American Journal of
Emergency Medicine, June 23, 2019
Yue S., Wang T., (2022). Imbalanced Malware Images
Classification: a CNN based Approach. Arxive.org,
February 20 2022
A Convolutional Neural Network Model for Prediction of ICU Performance Metrics: Time Series and Image Transformation Approaches
679
