
Integration of a Deep Learning-Based Module for the Quantification of
Imaging Features into the Filling-in Process of the Radiological
Structured Report
Camilla Scapicchio
1,2 a
, Elena Ballante
3,4
, Francesca Brero
4
, Raffaella Fiamma Cabini
4,5
,
Andrea Chincarini
6
, Maria Evelina Fantacci
1,2
, Silvia Figini
3,4
, Alessandro Lascialfari
4
,
Francesca Lizzi
2
, Ian Postuma
4
and Alessandra Retico
2 b
1
Department of Physics, University of Pisa, Pisa, Italy
2
National Institute for Nuclear Physics (INFN), Pisa, Italy
3
Department of Political and Social Sciences, University of Pavia, Pavia, Italy
4
National Institute for Nuclear Physics (INFN), Pavia, Italy
5
Department of Mathematics, University of Pavia, Pavia, Italy
6
National Institute for Nuclear Physics (INFN), Genova, Italy
Keywords:
COVID-19, Computed Tomography, Deep Learning, Quantification Software, Structured Report.
Abstract:
The role of Computed Tomography (CT) in the characterization of COVID-19 pneumonia has been widely
recognized. The aim of this work is to present the idea of integrating a Deep Learning (DL)-based software,
able to automatically quantify qualitative information typically describing COVID-19 lesions on chest CT
scans, into a structured report-filling pipeline. Different studies have highlighted the value of introducing the
use of structured reports in clinical practice, as a reproducible instrument for diagnosis and follow-up rather
than the commonly used free-text radiological report. Structured data are fundamental to helping clinical de-
cision support systems and fostering precision medicine. We developed a Deep Learning based software that
segments both the lungs and the lesions associated with COVID-19 pneumonia on chest CT scans and quan-
tifies some indexes describing qualitative characteristics used to assess COVID-19 lesions clinically. Once
assessed the robustness of the system by means of a multicenter clinical evaluation made by clinical experts, it
can be used for the first stratification of patients, supporting radiologists with a computer-aided quantification,
and the derived quantities, immediately intelligible for the clinicians, are suitable to be inserted in a structured
report in COVID-19 pneumonia and then exploited as explainable features to build predictive models.
ABBREVIATIONS
AI, Artificial Intelligence; AUC, Area Under the
ROC-Curve; CNN, Convolutional Neural Network;
CT, Computed Tomography; CTSS, CT Severity
Score; DL, Deep Learning; ESR, European Soci-
ety of Radiology; GG, Ground Glass; P, Percentage;
RT-PCR, Reverse Transcription Polymerase Chain
Reaction; sDSC, surface Dice similarity coefficient;
SIRM, Italian Society of Medical Radiology; TCIA,
The Cancer Imaging Archive; vDSC, volumetric Dice
similarity coefficient.
a
https://orcid.org/0000-0001-5984-0408
b
https://orcid.org/0000-0001-5135-4472
1 INTRODUCTION
Medical imaging has been proven to have a role in
the characterization of COVID-19 pneumonia and in
the assessment of the severity of the disease (Kol-
lias et al., 2022). In particular, chest Computed To-
mography (CT) is typically used for the management
of COVID-19 patients (Rubin et al., 2020). Both
qualitative and quantitative chest CT indicators can
be used to assess the severity of COVID-19 pneu-
monia (Lyu et al., 2020). The main typical features
have been summarized in different reports (Carotti
et al., 2020). Different software tools based on Deep
Learning (DL) have been developed to automate the
segmentation of the COVID-19 lesions (Zhao et al.,
2021), (Mergen et al., 2020), from which the quanti-
Scapicchio, C., Ballante, E., Brero, F., Cabini, R., Chincarini, A., Fantacci, M., Figini, S., Lascialfari, A., Lizzi, F., Postuma, I. and Retico, A.
Integration of a Deep Learning-Based Module for the Quantification of Imaging Features into the Filling-in Process of the Radiological Structured Report.
DOI: 10.5220/0011921900003414
In Proceedings of the 16th International Joint Conference on Biomedical Engineering Systems and Technologies (BIOSTEC 2023) - Volume 5: HEALTHINF, pages 663-670
ISBN: 978-989-758-631-6; ISSN: 2184-4305
Copyright
c
2023 by SCITEPRESS – Science and Technology Publications, Lda. Under CC license (CC BY-NC-ND 4.0)
663

tative indicators can be extracted. However, there are
very few studies that explore the ability of automated
DL software to quantify intelligible qualitative infor-
mation from the segmented regions.
The Italian Society of Medical Radiology (SIRM)
has shown its interest in the standardization of the ra-
diological report to reduce the variability of free-text
radiological reports and improve the workflow in clin-
ical routine (Faggioni et al., 2017). A structured re-
port is a standardized template with predefined fields
describing different kinds of information related to di-
agnostic imaging. The European Society of Radiol-
ogy (ESR) recognized also the potential of structured
reports, especially in facilitating data sharing and data
mining thanks to the use of key data elements and
quantified parameters (of Radiology (ESR) commu-
nications@ myesr. org, 2018). This new trend for the
integration of structured reports in radiology has been
widely reviewed in its advantages and potentialities
(Rocha et al., 2020). The need for this standardized
reporting scheme has been given a new emphasis with
the spreading of the COVID-19 pandemic (Neri et al.,
2020), (
¨
Ozer et al., 2021), (Salvatore et al., 2021).
The aim of this work is to develop an automated
tool able to provide qualitative descriptive metrics
characterizing COVID-19 lesions and include these
metrics in a structured report of chest CT in COVID-
19 pneumonia, to support clinicians in the manage-
ment of patients. We selected 4 qualitative parame-
ters describing COVID-19 lesions that were automat-
ically quantified by the software starting from the seg-
mentations: the CT severity score (CTSS), the lesion
type, the bilateral involvement, and the basal predom-
inance. These metrics have been chosen because they
are the ones commonly visually assessed by radiolo-
gists in the routine clinical practice of chest CT visual
evaluation.
The possibility to obtain from a DL-based seg-
mentation software qualitative intelligible features,
immediately understandable by clinicians, makes the
system more explainable and trustworthy. Moreover,
these quantified qualitative features could be directly
included in a structured report, giving the clinicians
support in the assessment of the characterization of
the pathology.
There are other related works in literature focused
on DL systems applied to chest CT scans in COVID-
19 pneumonia (Colombi et al., 2020), (Fervers et al.,
2022), (Caruso et al., 2021). However, their main lim-
itation is that their aim is not to use the DL system
to quantify the same qualitative parameters clinically
relevant to characterize the pathology as the ones we
take into account in our study. They nor consider the
idea of using the system as an aid for the filling in of
the radiological structured report.
2 MATERIALS AND METHODS
2.1 Dataset
For the training and test of the updated version of the
DL-based segmentation software considered in this
study, the same datasets and their partitions in a train,
validation, and test sets used in the baseline version
described in (Lizzi et al., 2022) have been adopted.
Whereas, to evaluate the ability of the developed
Deep-Learning software in the automatic quantifica-
tion of the qualitative features characterizing COVID-
19 lesions, a subset of a specific public dataset has
been used. This validation has been made by means
of a statistical comparison between the output of the
software and multicenter clinical evaluations. There-
fore, it is composed of only 120 CT scans to not over-
load clinicians’ work. They were sampled from the
TCIA database (CT Images in COVID-19), which in-
cludes only patients with SARS-CoV-2 infection con-
firmed by Reverse Transcription Polymerase Chain
Reaction (RT-PCR). The images were randomly se-
lected so that they were not used in the training of the
DL-based software, but were sampled with severity
score statistics similar to the one used for the train-
ing of the software. However, the severity score is not
given as ground truth for the dataset, but it is inferred
from the output of the software. The distribution of
the CTSS (the severity score index ranging from 1 to
5, with 5 corresponding to the most severe cases) for
the 120 cases is 75 cases with CTSS=1, 36 cases with
CTSS=2, and 9 cases with CTSS=3. Images are in the
NIfTI file format and were fully anonymized, there-
fore the acquisition parameters and patient informa-
tion were not provided.
2.2 Deep Learning Software
In this study, we used an updated version of our cus-
tom software (Lizzi et al., 2022), which is a DL-based
pipeline for the segmentation and quantification of
COVID-19 pulmonary lesions. It is based on a cas-
cade of three Convolutional Neural Networks. One
CNN is used to predict a bounding box enclosing the
lungs and two U-nets are devoted to the segmentation
of the lungs and of the COVID-19 lesions. The out-
put of the software is the lung parenchyma segmenta-
tion mask, the COVID-19 lesion segmentation mask,
including Ground Glass (GG) opacities and consoli-
dations (typical findings of COVID-19 disease) (Fig-
ure 1), the percentage P of lung volume affected by
CCH 2023 - Special Session on Machine Learning and Deep Learning for Preventive Healthcare and Clinical Decision Support
664

COVID-19 lesions and the CTSS, defined as follows:
CTSS = 1 for P < 5%; CTSS = 2 for 5% ≤ P < 25%;
CTSS = 3 for 25% ≤ P < 50%; CTSS = 4 for 50% ≤
P < 75%; CTSS = 5 for P ≥ 75%.
This updated version of the algorithm underwent
the same training and testing procedure, in terms of
used datasets and hyperparameters, adopted for the
first version and described in (Lizzi et al., 2022). The
update covered the addition of the first of the three
CNNs, devoted to the identification of a bounding box
enclosing the lungs performed through a regression.
It has been added to make the system work also on
CT images acquired with a different Field Of View.
Other updates are the introduction of a function that
separates the right and left lungs with two different
masks, and a threshold to differentiate consolidations
from GG in the lesion mask.
The metrics used to validate the segmentation per-
formance of this updated version were surface and
volumetric Dice similarity coefficients (sDSC and
vDSC) computed between the segmented masks and
the reference ones. They were computed on the cases
of the same benchmark dataset used to test the first
version of the algorithm (Lizzi et al., 2022). The
sDSC at 5 mm of tolerance and the vDSC for lung
segmentation are equal to 0.97 ± 0.01 and 0.96 ±
0.01, respectively. For the lesion segmentation, the
performance in terms of sDSC 5mm and the vDSC
are equal to 0.83 ± 0.07 and 0.69 ± 0.08, respectively.
The Mean Absolute Error in assessing the percentage
of the infected lung is equal to 2%. The accuracy in
assigning the correct CTSS class is equal to 80%. The
explanation of these evaluation metrics and the reason
for their adoption is reported in (Lizzi et al., 2022).
These results allow us to consider the software sta-
tistically validated in its segmentation performance
2.3 Quantification of the Qualitative
Metrics
Once the DL-based system has been trained, it can be
used at the inference phase to obtain from a CT scan
volume the corresponding lung and lesions segmen-
tation masks and a set of volumetric estimates com-
puted on the masks. These raw volumetric outputs
are:
• Lung volume: total volume of the lungs.
• LL ratio: the ratio between the total volume of the
lesion and the total volume of the lungs.
• consolidation volume: volume of consolidations
in the lesion mask.
• lesion volume: total volume (right + left) of the
lesion (GG + consolidations).
• R gg: volume of GG in the right lung.
• L
gg: volume of GG in the left lung.
• L con: volume of consolidations in the left lung.
• R con: volume of consolidations in the right lung.
These values derived from the segmented region
of the COVID-19 lesion on the CT image can be ex-
ploited to quantify some qualitative features or met-
rics relevant to characterize COVID-19 pneumonia.
On the basis of common clinical knowledge as con-
sidered in the routine visual evaluation of chest CT
scans, the following quantifiable qualitative metrics,
with the correspondent categories, have been identi-
fied.
1. Lesion Type:
• Ground Glass Only: only GG opacities are
present. GG appears as a hazy increase in
opacity of the lungs, with preservation of the
bronchial and vascular margins (Hansell et al.,
2008). It has been reported as the primary find-
ing of COVID-19 pneumonia on CT scans.
• Mainly Ground Glass: most of the lesion is
GG, but scattered consolidation sites are also
present. Consolidations appear as a homoge-
neous increase in pulmonary parenchymal at-
tenuation that obscures the margins of the ves-
sels and airway walls (Hansell et al., 2008), and
they are typically associated to a more severe
prognosis (Carotti et al., 2020).
• Consolidation and GG: GG and consolidations
are present in approximately similar propor-
tions.
• Mainly consolidations: most of the lesion is
consolidation, but GG is also visible.
• Consolidations Only: only consolidations are
present.
There are no established thresholds to discrimi-
nate visually among the types of lesions.
This Lesion Type qualitative metric has been au-
tomatically translated into a quantitative index by
exploiting the output of the segmentation software
as follows:
LesionType =
consolidation volume
lesion volume
(1)
When this index is closer to zero, the lesion is
mainly GG; when it is closer to 1, the lesion is
mostly consolidation.
2. Bilateral distribution of the lesion: when pul-
monary lesions are visible in both lungs in an
approximately similar percentage (Abou Ghayda
et al., 2021). It can be described by a binary cate-
gorization yes/no.
Integration of a Deep Learning-Based Module for the Quantification of Imaging Features into the Filling-in Process of the Radiological
Structured Report
665
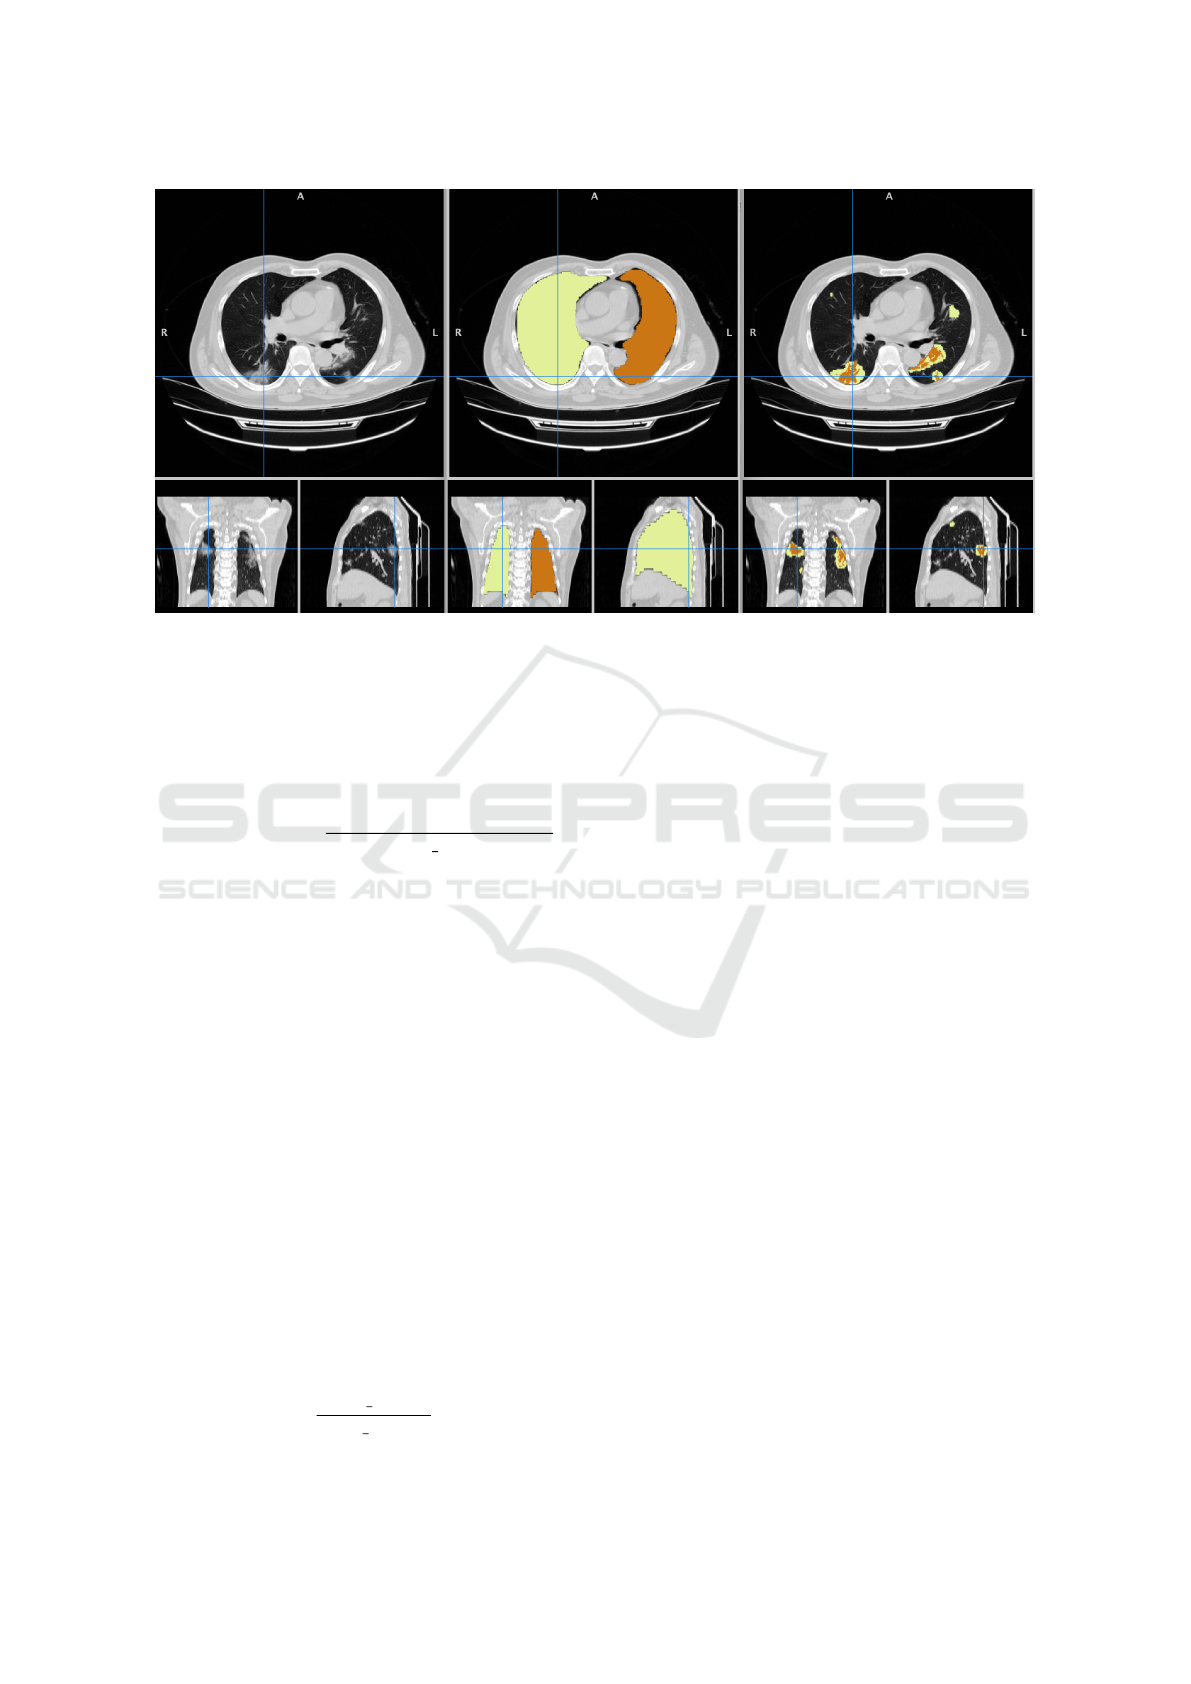
Figure 1: Example of software output. Left: original input CT scan image with axial, coronal, and sagittal projections.
Center: lungs segmentation mask. Right: COVID-19 lesions segmentation mask, with different labels for GG (light orange)
and consolidations (dark orange).
This qualitative metric has been quantified into a
representatative index by combining the raw val-
ues obtained with the segmentation software by
means of the following formula:
Bilateral = 1 −
|
(R
con
+ R
gg
) − (L
con
+ L
gg
)
|
lesion volume
(2)
The lower the index, the less bilateral the lesion.
3. Basal predominant distribution of the lesion:
when lesions affect mainly the bases of the
lungs with relative sparing of the upper regions
(Rizzetto et al., 2021).
The quantitative index corresponding to the basal
distribution is obtained by projecting both the
lung distribution and the lesion distribution on the
z-axis (the lung axis). The index value is cal-
culated as the percentile of the lung distribution
which lies the median of the lesion distribution.
A lower index corresponds to a lower z and there-
fore to a more basal distribution of the lesions.
4. CT Severity Score: a 5-class score describing the
lung compromised fraction (1=0-5%, 2=5-25%,
3=25-50%, 4=50-75%, 5=75-100%).
The translation of this visually estimated severity
index into a quantitative index has been obtained
by computing the percentage P of lung affected
by COVID-19 infection from the volumes of the
segmentation masks as:
P =
lesion volume
Lung volume
x100 (3)
and CTSS = 1 for P < 5%, CTSS = 2 for 5% ≤ P
< 25%, CTSS = 3 for 25% ≤ P < 50%, CTSS =
4 for 50% ≤ P < 75%, CTSS = 5 for P ≥ 75%.
2.4 Multicenter Evaluation
The 120 CT scans of the public dataset TCIA were
processed with the DL software to obtain the segmen-
tation masks and the volumetric values. We then de-
rived these quantitative indexes corresponding to the
qualitative metrics as described before, for each of the
120 cases, obtaining a table of values.
Before evaluating the possibility of using the soft-
ware as a support to the automatic filling in of the
structured report form, it is worth evaluating the reli-
ability of the system in this quantitative translation of
clinical qualitative metrics. In this case, we assessed
the performance of the DL algorithm by means of a
multicenter evaluation, which is a sort of clinical val-
idation. It was based on a statistical analysis of the
agreement between the software output and the vi-
sual assessments of 14 clinical experts from 5 clinical
centers on the defined qualitative metrics for the de-
scribed public dataset of chest CT scans of COVID-19
patients. This comparison was performed with two in-
dependent statistical methods: an AUC analysis and a
non-linear regression based on a previous work (Chin-
carini et al., 2019). The details of this comparison are
the subject of another work under review and are not
the focus of the present study, therefore they are not
reported here.
CCH 2023 - Special Session on Machine Learning and Deep Learning for Preventive Healthcare and Clinical Decision Support
666
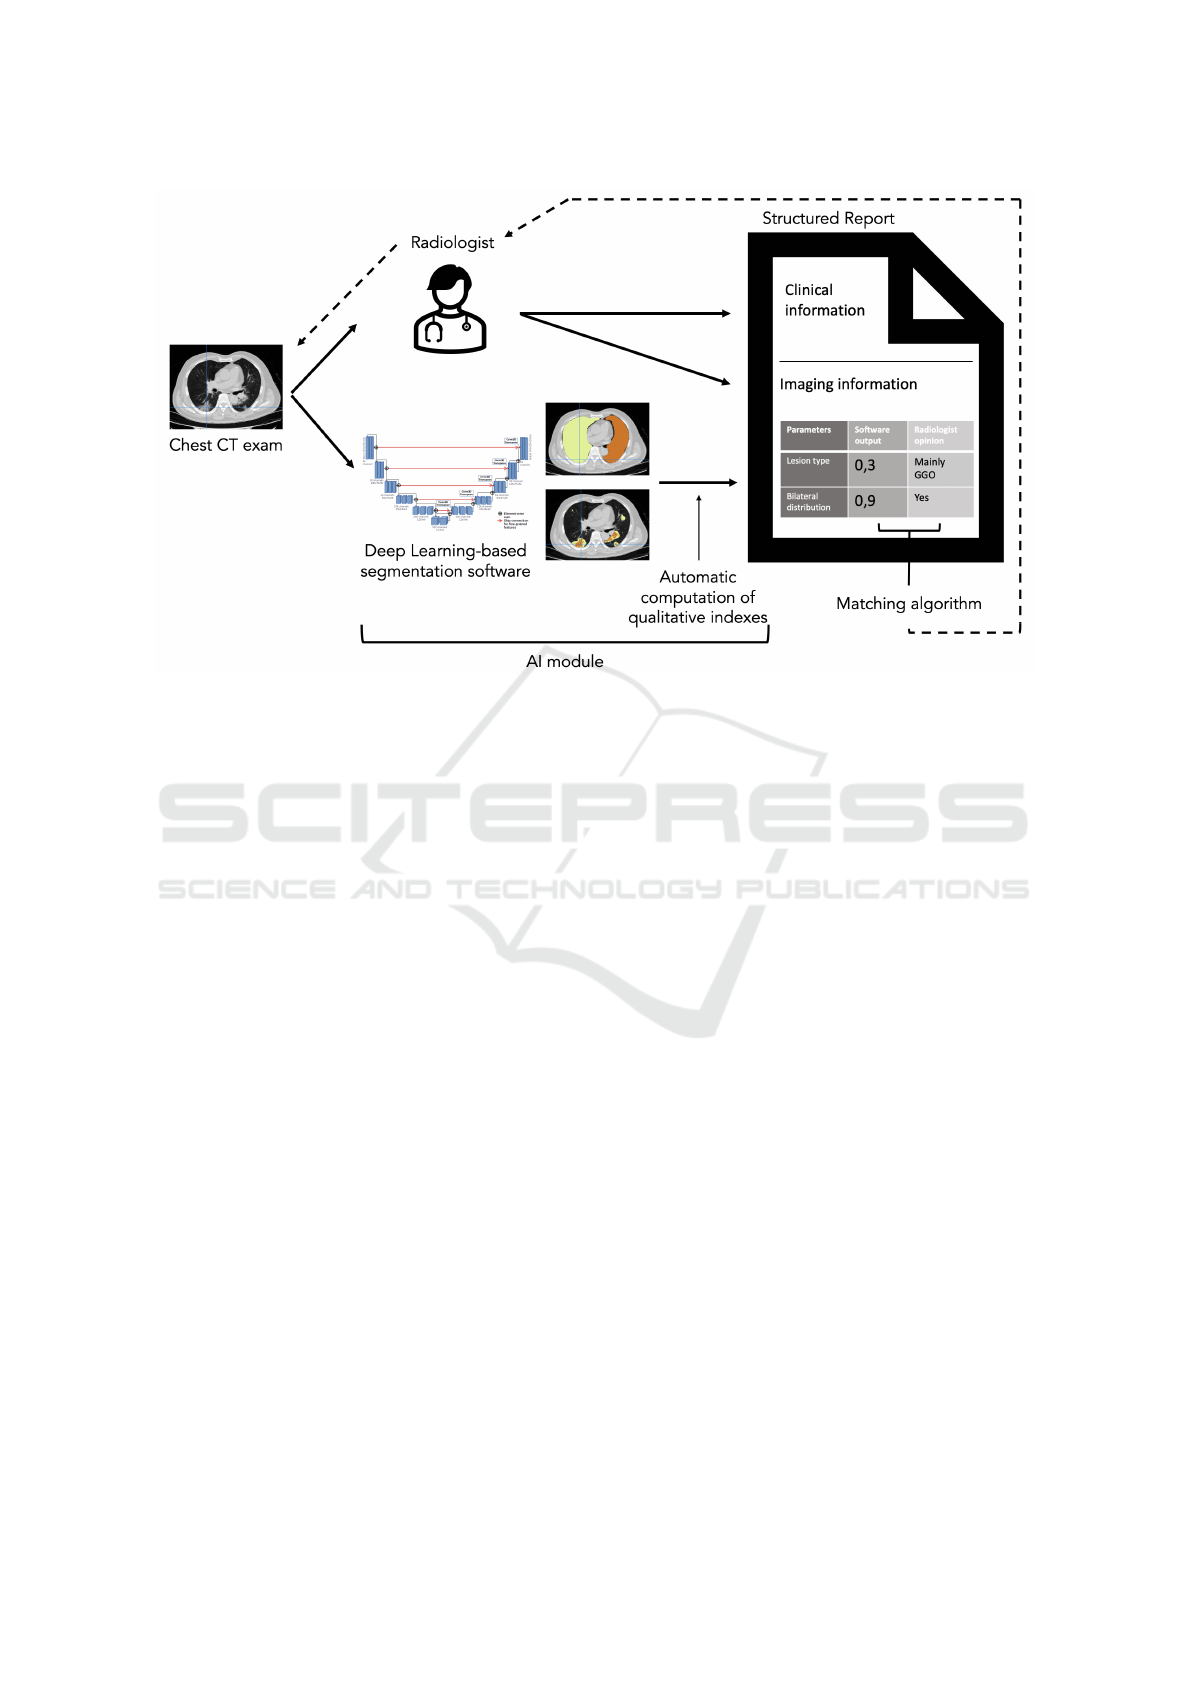
Figure 2: The scheme of the proposed pipeline of integration between the AI module and the radiologist’s assessment to fill
in the radiological structured report for the management of COVID-19 patients.
2.5 AI Module Integration in
Structured Report Fulfillment
Different studies highlight that the main CT findings
that characterize COVID-19 lesions and are predic-
tors of patient outcome are those considered in the
present study, i.e. related to the type and location of
the lesion (Salvatore et al., 2021). Moreover, the pro-
posed structured report for COVID-19, defined with
a consensus agreement, contains some fields, such
as Location (Bilateral, Left unilateral, Right unilat-
eral), Cranio-caudal distribution (Predominant in the
lower lobes, Predominant in the upper lobes, Multi-
focal/patching) for both Ground Glass Opacities and
Consolidations, and the volumes of GG and consol-
idations for right and left lung (Neri et al., 2020),
which precisely correspond to the qualitative imaging
parameters described in this study.
Therefore, the idea is to use the output of the soft-
ware to automatically fill in the values for these fields
in the imaging sections of the structured report. This
could be the last step to clinically apply the developed
software, and it could be possible thanks to the bases
laid through the steps explained in the previous sec-
tions.
As shown in Figure 2, we propose a novel archi-
tecture that integrates an AI segmentation, classifica-
tion, and quantification module, previously described,
into the reporting pipeline of the structured scheme
for COVID-19 patients. The same CT scan acquired
from the patient undergoes both the radiologist’s vi-
sual examination and the AI module processing. The
radiologist fills in the clinical information part of the
report and the imaging information part for what con-
cerns the visual assessment of the defined qualita-
tive parameters. The same imaging parameters are
obtained automatically from the segmentation soft-
ware and the following manipulation of its outcome,
as previously described. Thus, these obtained quanti-
tative indexes are automatically inserted into the cor-
responding field of the qualitative metric in the struc-
tured report form.
The idea is also to add an automated matching al-
gorithm that compares the final index of the AI mod-
ule with the radiologist’s annotation so that the radiol-
ogist can operate a second reading only on those cases
with discordant evaluations.
3 RESULTS
As previously outlined, one of the direct outputs
of the DL segmentation software is the CTSS. The
other qualitative metrics (Lesion Type, Bilateral dis-
tribution, and Basal distribution), conversely, are ob-
tained with manipulation of the other volumetric val-
ues given as output of the software by means of the
formulas described above. In Figure 3, an example
of a table of the qualitative indexes obtained with this
post-processing manipulation is reported.
Integration of a Deep Learning-Based Module for the Quantification of Imaging Features into the Filling-in Process of the Radiological
Structured Report
667
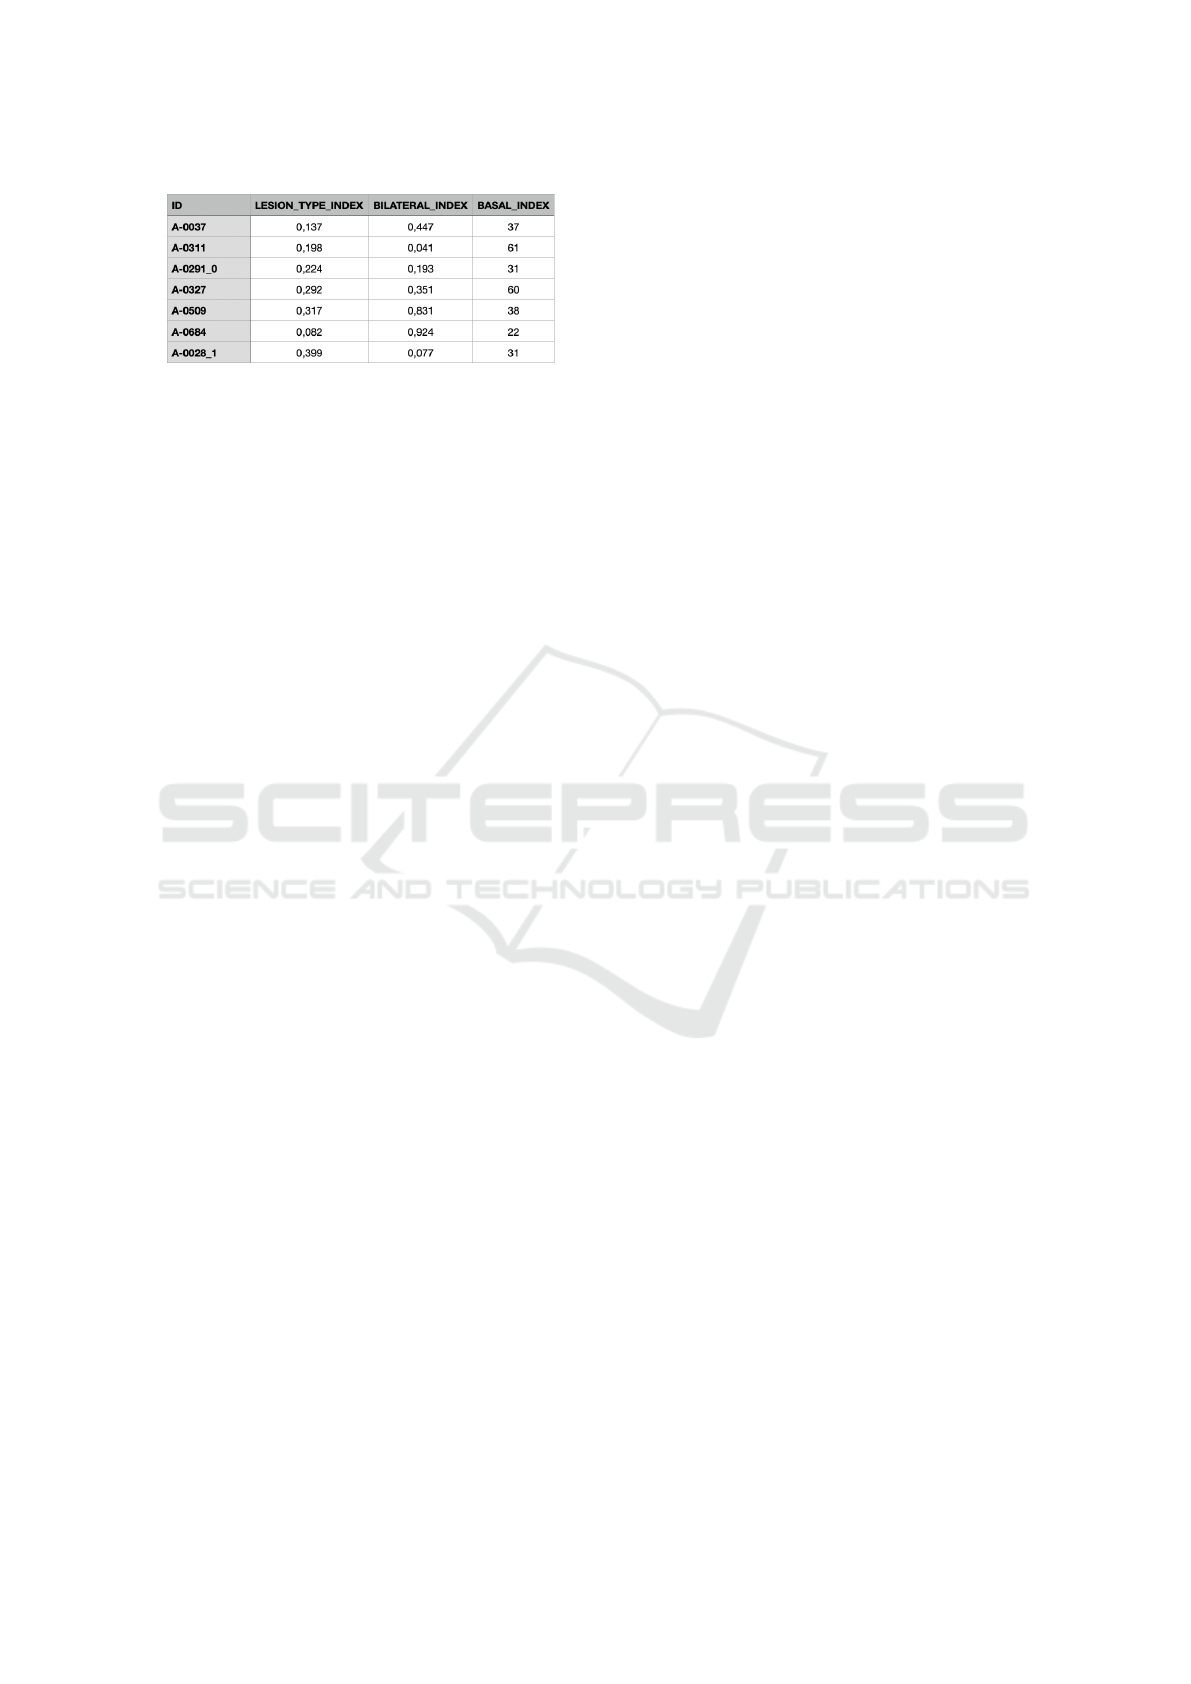
Figure 3: Example of the table of quantitative values de-
scribing the qualitative metrics characterizing COVID-19
lesions, obtained from the output values of the segmenta-
tion software.
These indexes have been obtained for all 120 con-
sidered cases. The CT images have been processed
by the segmentation software, the volumes have been
computed on the segmented masks and the indexes
corresponding to the qualitative metrics have been
computed from them by means of the formulas re-
ported in Section 2.3.
To compare this automatic output to the visual
evaluation of clinicians, for each of the 120 scans, the
radiologists were asked to visually assess them and
assign a category to the four qualitative parameters
defined in Section 2.3. As each clinician’s evalua-
tion is blind to that of the others, we can consider an
assumption of independence. Therefore, the “true”
evaluation was estimated as the mean of the clini-
cians’ opinions. These ”true” evaluations have been
compared to the indexes given automatically from the
software by means of an AUC analysis and a non-
linear regression. We do not discuss here the details
of this multicenter evaluation, as it is the subject of an-
other work under revision. However, this evaluation is
useful to state that the software is robust in the quan-
tification of qualitative parameters and could be there-
fore used to support the filling-in of the structured re-
port. We report here, in Table 1, just the summarized
results demonstrating the reliability of the software.
Once the statistical comparison confirms the ro-
bustness of the performance of the software, it can
be used to automatically quantify the qualitative fea-
tures on the CT scan. Therefore, the following step
is the integration of the segmentation software and
the post-processing computation of the quantitative
indexes (AI module). The proposed pipeline and inte-
gration scheme is shown in Figure 2. The implemen-
tation of this design with a corresponding interface to
use the complete package has yet to be developed, as
the research here presented is in progress.
Therefore the results here reported are intermedi-
ate as the methods have to be slightly refined and val-
idated. However, the goal of this paper is to convince
the audience that the idea here described of an autom-
atized fulfillment of a structured report is valid and to
underline the need for further research in this direc-
tion.
4 DISCUSSION
We described an automatic pipeline to obtain a quan-
tification of some qualitative parameters typically
used by clinicians to characterize COVID-19 lesions
on CT scans. After having evaluated the reliability of
the software by means of a multicenter evaluation and
a statistical analysis, we proposed the integration of
this AI system into the process of the structured report
fulfillment, as a fully-automated tool to support clini-
cians in the diagnosis and management of COVID-19
patients.
The statistical analysis of the comparison between
the quantification tool outcome and the radiologists’
visual assessments of the chest CT scans of the con-
sidered public dataset shows that the software is able
to distinguish with acceptable precision among the
categories of the clinical metrics. In fact, as evi-
dent from Table 1, the AUC values are quite satisfac-
tory, and the cutoff values obtained with independent
methods – Youden index in AUC analysis and inflec-
tion point in non-linear regression model – are quite
comparable for the different qualitative metrics. This
allows us to consider the software a robust quantifi-
cation system of these qualitative metrics describing
COVID-19 pneumonia and use it to automatically fill
in the structured report. The use of this latter is largely
promoted nowadays to overcome the variability due
to the free-text radiological reports and harmonize the
communication of findings and diagnosis among dif-
ferent clinical centers.
The usefulness of the integration of an automated
AI-based tool in the fulfillment of a COVID-19 pa-
tient’s structured report is in the fact that the visual
assessment of this new disease from chest CTs is not
so trivial, especially for borderline cases. In fact, from
the multicenter evaluation, it turned out that there is a
huge heterogeneity of the clinical evaluations on sev-
eral cases of the public database (TCIA). This poor
agreement among radiologists’ opinions suggests that
these qualitative metrics are not easy to visually eval-
uate and especially quantify. This is because COVID-
19 imaging patterns are non-specific and a 3D vol-
ume quantification by means of a 2D scrolling viewer
is not so trivial. Therefore, a quantitative aid with
automatic software can play a role in improving the
clinical workflow related to COVID-19 patients and
providing the necessary evaluation contrast in the in-
terpretation of borderline cases.
Moreover, the future addition of an automated
CCH 2023 - Special Session on Machine Learning and Deep Learning for Preventive Healthcare and Clinical Decision Support
668
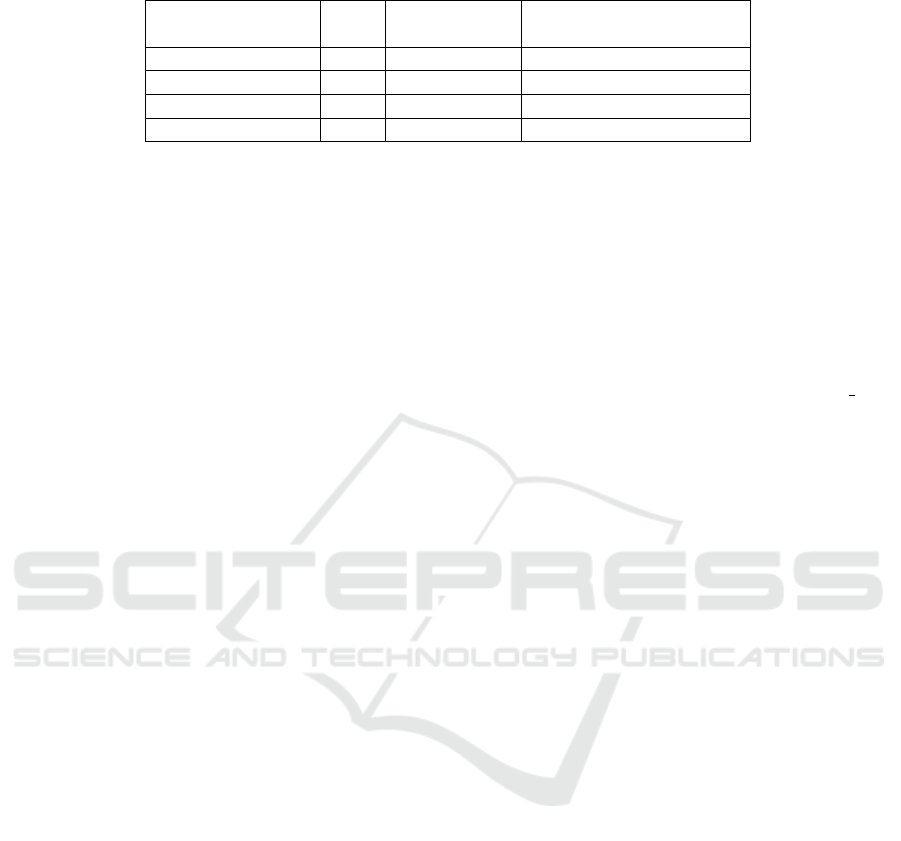
Table 1: AUC, Youden’s cutoff and sigmoid-fit inflection point on the software outputs vs the respective dichotomized clinical
metrics.
Metric AUC Youden cutoff Inflection linear constrain
[95% CL]
CTSS 0.98 0.10 0.20 [0.19 0.21]
Bilateral 0.85 0.60 0.64 [0.52 0.76]
Basal Predominant 0.90 0.34 0.32 [0.31 0.33]
Lesion Type 0.81 0.15 0.18 [0.12 0.25]
matching algorithm in the proposed pipeline of inte-
gration between the AI module and the radiologist’s
annotations could be used as further validation, and
following updating and improvement, of the software
itself.
The relevance of the present study consists of the
possibility to translate qualitative assessments charac-
terizing COVID-19 lesions into quantifiable metrics,
which, therefore, represent intelligible features imme-
diately understandable by clinicians. Through these
quantitative data, it is possible to build more com-
plex and structured datasets able to foster data mining
and precision medicine. This will enable the develop-
ment of predictive models exploiting radiomics and
Machine Learning, to foresee, for instance, if the pa-
tient will develop a severe progression of the pathol-
ogy. So, a structure report thus produced, with quan-
tified parameters, could be used for further analytic
research.
4.1 Limitations and Future Perspectives
A limitation of this study is the use of a public dataset
of CT scans designed for research purposes, with-
out information on the acquisition parameters, patient
metadata, or scanner type. Another limitation is due
to the fact that the sampling of the 120 cases used for
the validation was done on an imbalanced dataset in
terms of class representation for CTSS. This was due
to the imbalance in the original dataset used for the
software training. Another deficiency in our study is
that the fields in the report that can be automatically
filled in from the AI module are relatively limited in
terms of measurement content. The AI module is not
yet capable of presenting a complete imaging diagno-
sis report as some qualitative metrics are not included,
such as for example the peripheral distribution. The
future perspective is to extend the qualitative metrics
that the AI software is able to quantify, precisely start-
ing from providing a peripheral distribution index.
The future perspective will regard also the imple-
mentation and deployment of a specific interface for
this integrated tool, to use in a clinical scenario as a
decision support tool for healthcare providers, and in
the second instance, to provide researchers with struc-
tured and quantitative data. The idea is also to ex-
tend the architecture of this proposed framework to
other medical diseases whose diagnosis is based on
CT imaging.
ACKNOWLEDGEMENTS
This work has been carried out within the Ar-
tificial Intelligence in Medicine (next AIM,
https://www.pi.infn.it/aim) project funded by INFN
(CSN5) and within the FAIR-AIM project funded
by Tuscany Government (POR FSE 2014-2020).
We also thank the radiologists from the 5 clinical
centers (Universities hospitals of Florence (Azienda
Ospedaliero Universitaria Careggi), Milan (ASST
Grande Ospedale Metropolitano Niguarda), Palermo
(Azienda Ospedaliera Universitaria Policlinico “P.
Giaccone”), Pavia (Policlinico San Matteo Pavia
Fondazione IRCCS) and Pisa (Azienda Ospedaliero
Universitaria Pisana)) who provided the clinical
visual assessments for the multicenter evaluation part
of the study and anyone from the five clinical centers
cited in the text and the different INFN nodes who
collaborated on this project.
REFERENCES
Abou Ghayda, R., Lee, K. H., Kim, J. S., Lee, S., Hong,
S. H., Kim, K. S., Kim, K. E., Seok, J., Kim, H., Seo,
J., et al. (2021). Chest ct abnormalities in covid-19:
a systematic review. International journal of medical
sciences, 18(15):3395.
Carotti, M., Salaffi, F., Sarzi-Puttini, P., Agostini, A.,
Borgheresi, A., Minorati, D., Galli, M., Marotto, D.,
and Giovagnoni, A. (2020). Chest ct features of coron-
avirus disease 2019 (covid-19) pneumonia: key points
for radiologists. La radiologia medica, 125(7):636–
646.
Caruso, D., Polici, M., Zerunian, M., Pucciarelli, F., Poli-
dori, T., Guido, G., Rucci, C., Bracci, B., Muscogiuri,
E., De Dominicis, C., et al. (2021). Quantitative
chest ct analysis in discriminating covid-19 from non-
covid-19 patients. La radiologia medica, 126(2):243–
249.
Integration of a Deep Learning-Based Module for the Quantification of Imaging Features into the Filling-in Process of the Radiological
Structured Report
669

Chincarini, A., Peira, E., Morbelli, S., Pardini, M., Bauck-
neht, M., Arbizu, J., Castelo-Branco, M., B
¨
using,
K., De Mendonc¸a, A., Didic, M., et al. (2019).
Semi-quantification and grading of amyloid pet: A
project of the european alzheimer’s disease consor-
tium (eadc). NeuroImage: Clinical, 23:101846.
Colombi, D., Villani, G. D., Maffi, G., Risoli, C., Bodini,
F. C., Petrini, M., Morelli, N., Anselmi, P., Milanese,
G., Silva, M., et al. (2020). Qualitative and quan-
titative chest ct parameters as predictors of specific
mortality in covid-19 patients. Emergency radiology,
27(6):701–710.
Faggioni, L., Coppola, F., Ferrari, R., Neri, E., and Regge,
D. (2017). Usage of structured reporting in radiologi-
cal practice: results from an italian online survey. Eu-
ropean radiology, 27(5):1934–1943.
Fervers, P., Fervers, F., Jaiswal, A., Rinneburger, M.,
Weisthoff, M., Pollmann-Schweckhorst, P., Kottlors,
J., Carolus, H., Lennartz, S., Maintz, D., et al.
(2022). Assessment of covid-19 lung involvement on
computed tomography by deep-learning-, threshold-
, and human reader-based approaches—an interna-
tional, multi-center comparative study. Quantitative
Imaging in Medicine and Surgery, 12(11):5156–5170.
Hansell, D. M., Bankier, A. A., MacMahon, H., McLoud,
T. C., Muller, N. L., Remy, J., et al. (2008). Fleis-
chner society: glossary of terms for thoracic imaging.
Radiology, 246(3):697.
Kollias, D., Arsenos, A., and Kollias, S. (2022). Ai-mia:
Covid-19 detection & severity analysis through medi-
cal imaging. arXiv preprint arXiv:2206.04732.
Lizzi, F., Agosti, A., Brero, F., Cabini, R. F., Fantacci,
M. E., Figini, S., Lascialfari, A., Laruina, F., Oliva,
P., Piffer, S., et al. (2022). Quantification of pul-
monary involvement in covid-19 pneumonia by means
of a cascade of two u-nets: training and assessment
on multiple datasets using different annotation crite-
ria. International journal of computer assisted radiol-
ogy and surgery, 17(2):229–237.
Lyu, P., Liu, X., Zhang, R., Shi, L., and Gao, J. (2020).
The performance of chest ct in evaluating the clinical
severity of covid-19 pneumonia: identifying critical
cases based on ct characteristics. Investigative radiol-
ogy, 55(7):412–421.
Mergen, V., Kobe, A., Bl
¨
uthgen, C., Euler, A., Flohr,
T., Frauenfelder, T., Alkadhi, H., and Eberhard, M.
(2020). Deep learning for automatic quantification of
lung abnormalities in covid-19 patients: First experi-
ence and correlation with clinical parameters. Euro-
pean Journal of Radiology Open, 7:100272.
Neri, E., Coppola, F., Larici, A., Sverzellati, N., Mazzei,
M., Sacco, P., Dalpiaz, G., Feragalli, B., Miele, V., and
Grassi, R. (2020). Structured reporting of chest ct in
covid-19 pneumonia: a consensus proposal. Insights
into Imaging, 11(1):1–9.
of Radiology (ESR) communications@ myesr. org, E. S.
(2018). Esr paper on structured reporting in radiology.
Insights into Imaging, 9:1–7.
¨
Ozer, H., Kılınc¸er, A., Uysal, E., Yormaz, B., Cebeci,
H., Durmaz, M. S., and Koplay, M. (2021). Diag-
nostic performance of radiological society of north
america structured reporting language for chest com-
puted tomography findings in patients with covid-19.
Japanese journal of radiology, 39(9):877–888.
Rizzetto, F., Perillo, N., Artioli, D., Travaglini, F., Cuccia,
A., Zannoni, S., Tombini, V., Di Domenico, S. L.,
Albertini, V., Bergamaschi, M., et al. (2021). Cor-
relation between lung ultrasound and chest ct patterns
with estimation of pulmonary burden in covid-19 pa-
tients. European Journal of Radiology, 138:109650.
Rocha, D. M., Brasil, L. M., Lamas, J. M., Luz, G. V., and
Bacelar, S. S. (2020). Evidence of the benefits, advan-
tages and potentialities of the structured radiological
report: An integrative review. Artificial intelligence in
medicine, 102:101770.
Rubin, G. D., Ryerson, C. J., Haramati, L. B., Sverzellati,
N., Kanne, J. P., Raoof, S., Schluger, N. W., Volpi, A.,
Yim, J.-J., Martin, I. B., et al. (2020). The role of chest
imaging in patient management during the covid-19
pandemic: a multinational consensus statement from
the fleischner society. Radiology, 296(1):172–180.
Salvatore, C., Roberta, F., Angela, d. L., Cesare, P., Alfredo,
C., Giuliano, G., Giulio, L., Giuliana, G., Maria,
R. G., Paola, B. M., et al. (2021). Clinical and labo-
ratory data, radiological structured report findings and
quantitative evaluation of lung involvement on base-
line chest ct in covid-19 patients to predict prognosis.
La radiologia medica, 126(1):29–39.
Zhao, C., Xu, Y., He, Z., Tang, J., Zhang, Y., Han, J.,
Shi, Y., and Zhou, W. (2021). Lung segmentation
and automatic detection of covid-19 using radiomic
features from chest ct images. Pattern Recognition,
119:108071.
CCH 2023 - Special Session on Machine Learning and Deep Learning for Preventive Healthcare and Clinical Decision Support
670
