
Personnel Data Management System for Workforce Analytics
Marcin Pilat
Director General Military Personnel Research and Analysis, Department of National Defence,
101 Colonel By Drive, Ottawa, ON, K1A 0K2, Canada
Keywords: Workforce Analytics, Personnel, Data Management System, Data Mart, Dimensional Modelling.
Abstract: An effective analytics solution relies on the right data and the right data management system. We present a
data management system for personnel data that is specifically designed to enable efficient workforce
analytics. The system is designed using dimensional modelling and implemented as a collection of star
schemas over the business functions of workforce planning, recruitment, and retention. Special internal
processing during the Extract, Transform, Load process streamlines the generation of the internal data tables.
1 INTRODUCTION
The USA Department of Defense Personnel and
Readiness Strategy for 2030 (Department of Defense,
2020) identifies information, data management and
data-driven decision support as key goals of the
strategy. Similarly, The Department of National
Defence and Canadian Armed Forces Data Strategy
(Department of National Defence, 2019) emphasises
data management, data governance, and data access
to “create a culture where data are leveraged in all
decisions”.
Operations Research (OR) and Analytics rely on
access to well-structured and accurate data. Quite
often, the answer to a question is needed in a timely
fashion which prevents spending excessive time in
data processing. The right data management system
is crucial for successful delivery of an OR and
Analytics function to provide data-driven decision
support capabilities to modern military forces. Data
management is increasingly recognized as a key
strategic imperative for militaries and, by extension,
for OR scientists looking to support military research.
In this paper, we describe a data management
system, in the form of a data mart, tailored for an OR
and Analytics function in the personnel (i.e., Human
Resources) domain. This system
1
is used by the
1
The described system is based on the design of the
Director Research Workforce Analytics Data Mart within
Director General Military Personnel Research and
Analysis, Chief of Military Personnel, Canadian Armed
Forces.
Canadian Department of National Defence to support
OR and Workforce Analytics and provide decision
support to the Canadian Armed Forces in the domain
of personnel.
2 BACKGROUND
This section presents some background information
on data management systems, personnel business
processes, and previous data management systems as
motivation for the proposed new personnel data
management system.
2.1 Data Management Systems
Systems of record
2
are structured to support Online
Transaction Processing (OLTP). These are optimized
for a large volume of database transactions (such as:
insertions, deletions, and updates). While they can be
used for OR and Analytics, the analysts would have
to write complex queries which often run slowly.
There is also the unintended consequence of bogging
down the system with large data pulls. As a result,
they are typically not suitable for Analytics tasks.
While personnel systems of record differ among
organizations, OLTP systems are based on recording
2
The examples presented in this paper are based on the
PeopleSoft Human Resources Management System
(HRMS) used by the Canadian Department of National
Defence as the personnel system of record.
Pilat, M.
Personnel Data Management System for Workforce Analytics.
DOI: 10.5220/0011919500003396
In Proceedings of the 12th International Conference on Operations Research and Enterprise Systems (ICORES 2023), pages 281-287
ISBN: 978-989-758-627-9; ISSN: 2184-4372
Copyright
c
2023 by His Majesty the King in Right of Canada as represented by the Minister of National Defence and SCITEPRESS – Science and Technology Publications, Lda. Under
CC license (CC BY-NC-ND 4.0)
281

transactions (i.e., business events) in a database. In
the military personnel domain, transactional data
includes hires, terminations, transfers, contract
changes, postings, rank changes, occupational
transfers, deployments, and leave. New transactions
are added to the system with the following data:
personal identifier, transaction type, effective date,
and any additional supporting information.
Transactions can affect people but also affect other
organizational elements, such as positions and
occupations.
In addition to transactional data, systems of record
also store master data, such as personal details,
locations, position details, and other organizational
structures (e.g., military units). Master data is
typically persistent and some can be effectively dated
to preserve historical state (e.g., person’s marital
status). Special master data (commonly referred to as
reference data) provides additional context to the
main data in the system (such as decodes for the
various codes captured in transactional data).
In contrast to OLTP, the Online Analytical
Processing (OLAP) approach relies on a multi-
dimensional data model and a set of special
operations to efficiently analyse large data volumes.
Data warehouses and data marts
3
are relational
databases
4
where the data is structured for data
analysis over specific business processes. OLAP over
data warehouses and data marts provides analysts
with the right structured data and the right
technologies for OR and Analytics functions.
Data warehousing design classically follows two
modelling approaches: Inmon (Inmon, 2005) or
Kimball (Kimball & Ross, 2013). Breslin (Breslin,
2004) provides a detailed comparison between the
two models. The Personnel Data Mart design
presented in this paper follows the Kimball
dimensional modelling approach, as described in
Section 3.1. The Kimball approach is better suited for
smaller data sets (e.g., single business process such as
personnel) vs. enterprise-wide solutions. It also
requires lower start-up costs and faster time to
delivery (Breslin, 2004).
2.2 Personnel Process
Human Resources (HR) analytics is widely used in
the business world to analyse and optimize HR
processes. In the context of a defence establishment,
3
Data marts are typically a subset of a data warehouse built
for a specific division or business process.
4
In a relational database, the data is organized in tables and
rows called records. Multiple tables can be linked via
personnel (or workforce) analytics is a crucial
capability within defence OR. As the 2017 Canada’s
Defence Policy (Department of National Defence,
2017) states: “People are at the core of everything the
Canadian Armed Forces does to deliver on its
mandate.”
The main personnel business functions that are of
interest in defence are: workforce planning,
recruitment, training, retention, career/talent
management, health services, and compensation and
benefits. The data mart design presented in this paper
is based on three of these business functions:
workforce planning, recruitment, and retention.
Workforce planning is a broad business function
to analyse and plan the future workforce in order to
meet the organizational goals. Within the context of
the data management system, we concentrate on the
data analysis component of workforce planning. The
recruitment and retention functions represent the
flows in and out (and also within) the organization.
2.3 Previous Systems
Prior to the Director Research Workforce Analytics
(DRWA) Data Mart, workforce analytics at the
Canadian Department of National Defence relied on
a combination of a legacy analytics data management
system in Microsoft Access, additional data sets, and
manual data manipulation through Microsoft Access
and Excel.
The legacy system was composed of annual
population snapshots from a personnel reporting
system, annual release table (capturing retention
data), and various decode tables for slicing. This
system was adequate for some tasks but had several
drawbacks: it was slow, it had data quality issues
(mostly stemming from the source data system), and
had static historical data (i.e., retroactive changes to
the system of record were not captured).
The recruitment business function was not
represented in the legacy system. Workarounds to
calculate the recruitment data from the system were
being used to approximate the data; however, for
detailed analyses, the workforce analysts had to
manually request for additional data from the system
of record. Additional data requests were often limited
in scope with a turn-around time of weeks.
The analysts at DRWA were often faced with
tight-deadline personnel data analysis requests for
entities called keys forming relationships between the
records in the tables. Data in relational databases is
managed via Structured Query Language (SQL).
WAPAT 2023 - Special Session on Workforce Analytics - Practical Application and Theory
282
various clients, including top level military and
government officials. To support the effective
delivery of analytics products, a new analytics-drive
data management system was conceived and
developed. The details of this system are presented in
this paper.
3 SYSTEM DESIGN
This section presents the design of the personnel data
management system, including introduction to
dimensional modelling, facts, and dimensions.
3.1 Dimensional Modelling
Dimensional modelling is considered to be the
preferred technique for presenting analytical data
because it 1) delivers data that is understandable to
the end user and 2) has fast query performance
(Kimball & Ross, 2013). It relies on separating the
data into two types of entities: dimensions and facts.
Dimensions (such as: time, person, position, unit,
rank) provide the context for a business function
while the facts (e.g., hires, population snapshots) are
the measurements of the function. Facts are measured
with respect to a certain grain which specifies a
consistent scale for each measurement (e.g., a time-
based daily grain).
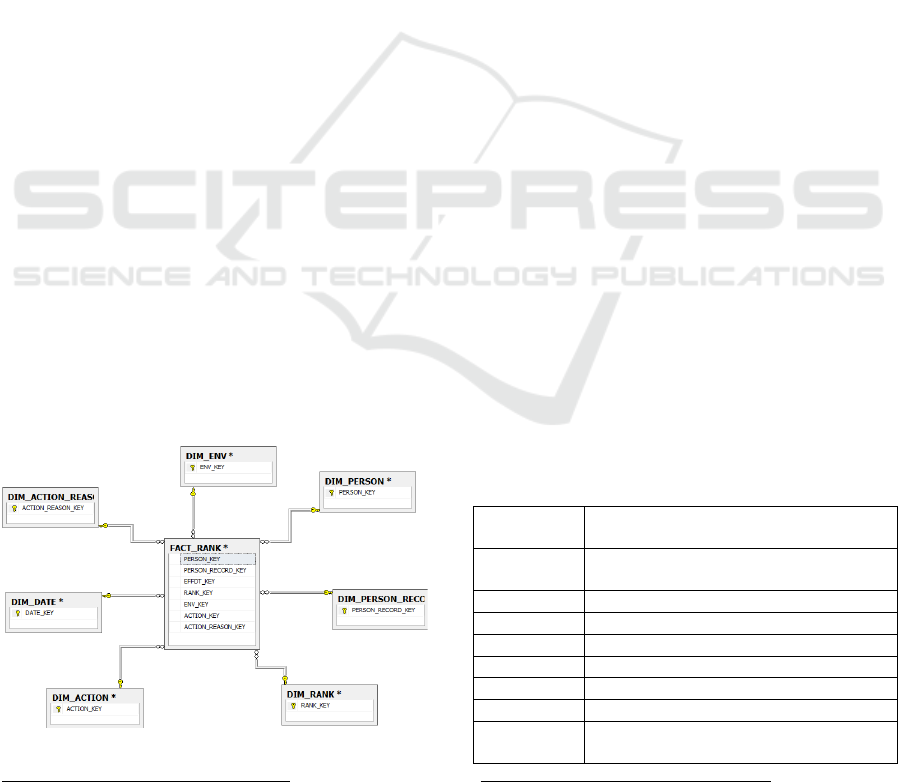
A fact table and its corresponding dimension
tables are typically organized in a star schema, as
illustrated in Figure 1. Relationships are defined by
single or compound keys as in relational database
models. A more generalized snowflake schema,
where each dimension can link to smaller dimensions,
can also be used but is usually discouraged due to
higher complexity and performance costs.
Figure 1: Simplified star schema for a rank fact table.
5
Normalized relational databases spread data over
multiple tables with relationships between each table
There are several different types of fact tables, but
we will describe the main three: transaction, periodic
snapshot, and accumulating snapshot. Transaction
fact tables are closest to the representation of the data
as stored in the system of record. They record events
at points in time with a transaction-based grain.
Periodic snapshot fact tables summarize events
occurring over a period of time, such as a day or a
year, which provides the grain of the table. Lastly,
accumulating snapshot fact tables summarize events
with a start and an end. Most rows start off with
missing end information that is updated when it
becomes available.
The core measurements in the personnel domain
are personnel counts (i.e., headcounts). To prevent the
generation of trivial count tables and due to the
typical low counts, we rely on the idea of factless fact
tables as described in (Kimball & Ross, 2013). These
tables record several dimensional entities at a moment
in time instead of a numerical measurement. The
records can be easily and efficiently counted with
respect to the desired grain.
Fact tables are normalized
5
and store the
following data: a grain key (such as a key to a date
table), measurements, and keys to any dimension
tables (for factless fact tables). Dimension tables are
typically de-normalized (especially under the star
schema) and store all the required data internally.
3.2 Processes and Facts
Each business function outlined in the previous
section gives rise to one or more fact tables with a
specific grain, as summarized in Table 1. A fact table
with its corresponding dimensions, organized into a
star schema, produce the output products that are used
by workforce analysts to apply OR and Analytics
Table 1: Summary of fact tables under each business
function within the personnel domain.
Business
Function
Fact Table (type)
Workforce
Plannin
g
JOB, RANK, OCC, TOS (transaction)
RECORDS
(
accumulatin
g
sna
p
shot
)
SNAPSHOT
(p
e
r
iodic sna
p
shot
)
STATS (
p
eriodic snapshot)
Recruitment INTAKE (transaction)
INTAKE
_
STATS
(
p
eriodic sna
p
shot
)
Retention ATTRITION
(
transaction
)
ATTRITION_STATS (periodic
snapshot)
specified through keys in order to reduce data redundancy
and improve data integrity.
Personnel Data Management System for Workforce Analytics
283

techniques. Multidimensional databases (known as
OLAP cubes) can also be generated on the star
schema to improve query performance.
The workforce planning function relies on access
to data at various grain levels, from detailed fine grain
to high-level coarse grain data. Tables storing
detailed data are often used for data exploration,
model building, and custom analytical queries. High-
level (often called “aggregate”) tables are used for
analytics and for model input.
To satisfy fine grain level analytics requirement,
we include event-grain transaction fact tables based
on normalized transaction tables from the system of
record
6
. These include: the main JOB table that
captures employment transactions (such as: hires,
terminations, postings, assignments, and leave); the
RANK table that captures personnel rank changes;
the OCC table that captures changes in personnel
occupations; and the TOS table that stores terms-of-
service history.
At a medium grain level, we define a population
snapshot table (a periodic snapshot fact table)
recording all personnel employed on a specific day
together with the state of their employment (via keys
to appropriate dimensions) and measures. This table
can be filled in with daily grain, but we typically limit
the snapshots to annual (fiscal and calendar) or
monthly grain to suit the business case requirements,
reduce complexity, and increase efficiency of
database queries.
We also create population statistic tables (periodic
snapshot fact tables) that simply store counts of
personnel on a daily basis over several categories,
including: service component, rank category, and
gender.
At the coarse grain level, we create record tables
that capture the personnel record history (for
employment, rank, and occupation records) in
segments from a start event (e.g., a hire) to an end
event (e.g., termination). These accumulating
snapshot fact tables are initially filled out based on
the start events and are updated when end events
become available. The tables are also instrumental in
the generation of other fact tables (population
snapshot, intake, and attrition) as described in Section
4.1.
The recruitment and retention functions rely on
data showing flows in, out, and within the
organization. Internal flows (typically denoted as
transfers) can be represented as in/out flows between
different service components of the military force.
6
These tables are based on filtered transactions from the
PeopleSoft HRMS product.
The recruitment INTAKE transaction fact table
records all personnel hire/transfer events occurring on
a specific date with additional information on the
event, including initial employment state (keyed to
appropriate dimensions). Similarly, the retention
ATTRITION transaction fact table stores all
personnel termination/transfer events for a given date
with any additional information, including reasons for
leaving.
Similar to the population statistic tables, intake
and attrition statistic tables store counts of the flows
on a daily basis together with categorical data of
interest (keyed to corresponding dimensions).
3.3 Dimensions
Dimension tables provide the context around a
business function event captured in the fact tables.
They contain descriptive data that is used to filter,
group, and drill down on the facts. Not all of the data
fields contained in the system of record tables are
used in the corresponding dimension tables as some
fields are of low analytical value (e.g., phone
numbers).
A dimension table has a simple structure of a key
tied to the descriptive data. These keys are used in the
fact tables to reference the specific rows of the
dimension tables. Dimension tables vary in size from
small decode tables representing reference data to
large tables storing master data.
The main dimension tables in the personnel data
management system are: PERSON, OCCUPATION,
POSITION, and ORGANIZATION. The PERSON
table is the master data for personnel records, storing
attributes such as gender, marital status, date of birth,
and home location. The OCCUPATION table stores
a listing of occupations whereas the POSITION table
lists the positions that a person might be posted in.
Finally, the ORGANIZATION table provides details
for each unit within the organization and contains
information about the unit hierarchy.
Reference data resides inside smaller dimension
tables (often called decode tables) that decode various
codes that are used by the fact tables. Some examples
are: ACTION, ACTION REASON, SERVICE
COMPONENT, EMPLOYMENT STATUS, RANK,
and ATTRITION REASON. Some tables, such as the
LOCATION table, are simple in structure but have
many records.
Data in dimension tables could change over time
(e.g., marital status, address in a PERSON
WAPAT 2023 - Special Session on Workforce Analytics - Practical Application and Theory
284
dimension). When the data changes slowly (as
compared to the rate of fact table changes), there are
several ways of dealing with the changes. The most
common method of dealing with slowly changing
dimensions that require preservation of old data
(called type 2) is to add a new row to the dimension
table. The rows are effectively dated so that the
attribute data can be extracted for any point in time.
Such historical tables are necessary to create
historical snapshot tables in personnel systems.
An important special type of dimension is the date
dimension that gives rise to the DATE dimension
table. Date dimensions are used throughout the design
to enable date-based navigation (e.g., by fiscal year,
month, or day).
Dimension table conformity drives analytic
consistency across the system. Conformed
dimensions enforce the rule that same attributes in
separate dimensions have the same names and
content. Multiple fact tables that refer to these
separate dimensions will use the same content.
4 SYSTEM DEPLOYMENT
This section describes the deployment processes of
the personnel data management system, including
data integration and generation of output data
products.
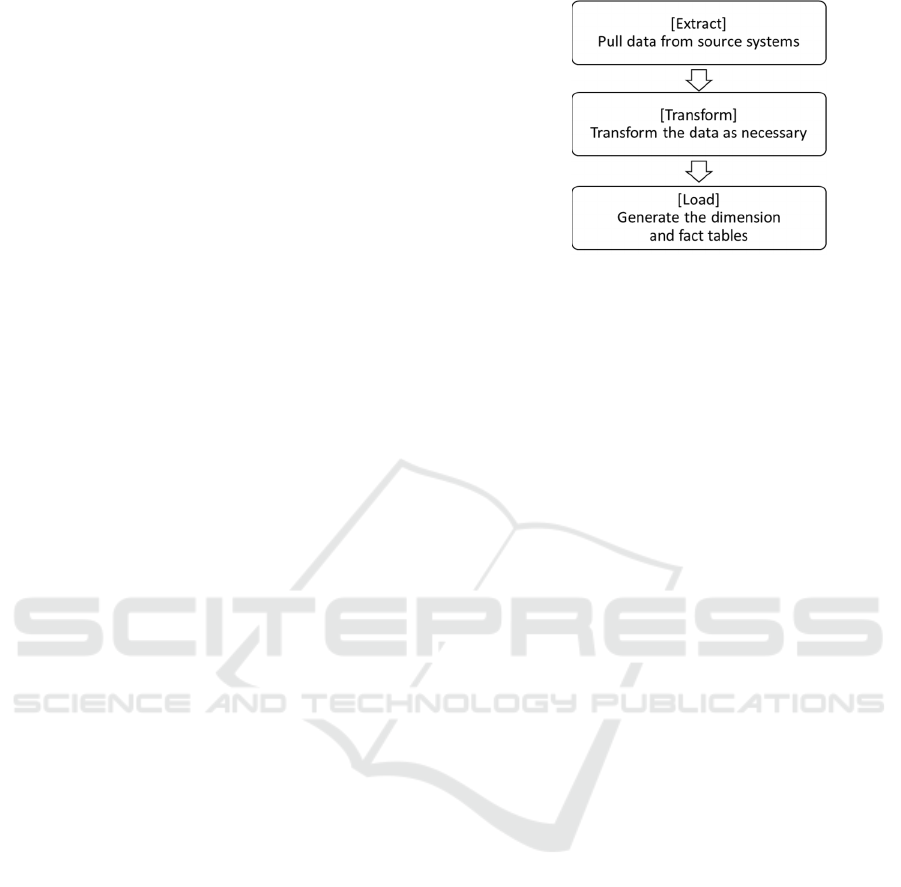
4.1 Data Integration
An ETL (Extract, Transform, Load) process is used
to generate the dimension and fact tables in a data
warehouse, as illustrated in Figure 2. Many variations
of the ETL process exist adapted for specific
purposes. The ETL process of the Personnel Data
Mart uses a staging area to transform the data before
the data mart is built. A staging area (a special
database for temporary data storage and processing)
is necessary for the Personnel Data Mart due to the
lack of a direct link to the data source systems.
First, the data is extracted from various data
sources and placed into tables in a staging area. Next,
the transform process performs data cleaning and
conforming tasks on the staging area data. Finally, the
Personnel Data Mart is built by loading the staging
area data into the data mart database via the
generation of dimension and fact tables.
The transform step in the ETL process is crucial
for the proper functioning of the resulting data mart.
Systems of record are often prone to data quality
issues. Errors and inconsistencies are introduced due
to inconsistent data entry procedures, inconsistent
Figure 2: The ELT (Extract, Load, Transform) process for
the Personnel Data Mart.
application of data entry procedures, and due to
manual error on data entry. Multiple data stores for
the same data can also yield conformity issues that
need to be resolved before a data mart is built.
Data validation and error correction is performed
on the source data in the staging area. Due to resource
constraints, only the most important data is cleaned.
Data cleaning is applied to field values but also to
entire records as necessary to prevent inconsistencies
in the data mart generation process. Conflicting data
sources are eliminated to generate conformed
dimensions and conformed facts. Detailed
information on the challenges and workarounds of
data cleaning and conforming can be found in
(Kimball & Caserta, 2004).
The Personnel Data Mart is built in stages, as
illustrated in Figure 3, to resolve any dependencies
between the resulting tables. The dimension tables are
generated first, followed by fine-grain transaction
tables (JOB, RANK, OCC, and TOS) that reference
the dimension tables. Next, the record tables are
generated from the data stored in the corresponding
fine-grain transaction tables and referenced to the
dimension tables.
The record tables form the basis for efficient
generation of the main data mart result tables (i.e., the
snapshot and intake/attrition flow tables). JOB record
tables store a record of each employment period per
person starting with the hire event until an optional
terminate event. Each person has one or more such
records. Similarly, the RANK and OCCUPATION
record tables generate rank and occupation records,
respectively. All the record tables are required to
provide a unique record at a given point in time (i.e.,
no time overlaps of records per person).
The population snapshot generation is done using
record table slicing along the time domain to arrive
at the person’s job, rank, and occupation records
at the time of the slice. This method significantly
speeds up the generation of the population snapshots.
Personnel Data Management System for Workforce Analytics
285
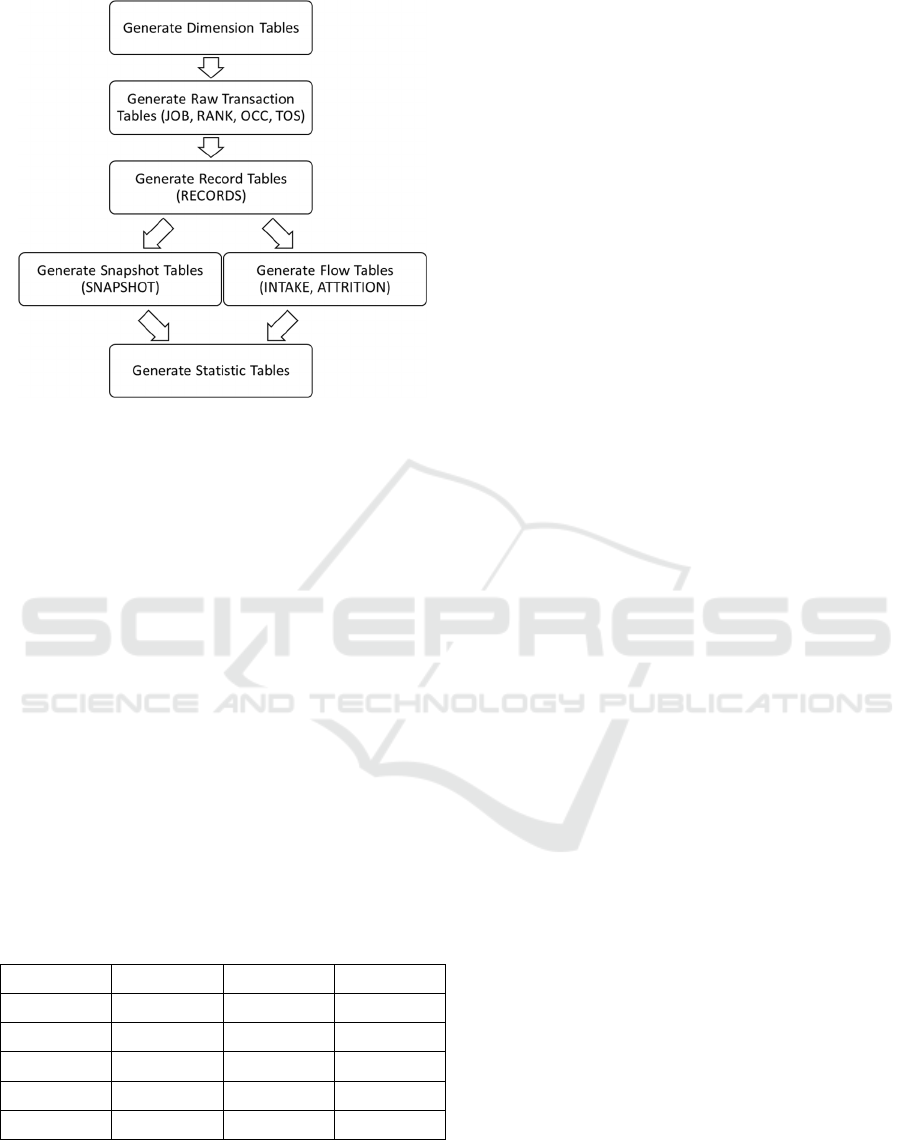
Figure 3: Detailed workflow of building the Personnel Data
Mart.
A snapshot can be generated on any given date
although we normally generate bi-annual (end-of-
calendar year and end-of-fiscal year) or monthly
(end-of-month) snapshots.
The flow tables are generated directly from the
JOB record table as they represent the start and end
events captured in the table. The INTAKE table
consists of the start fields of all JOB record table
entries. The ATTRITION table consists of the end
fields of those JOB record table entries that have end
records. The start fields are also included for ease of
use.
Once the SNAPSHOT, INTAKE, and
ATTRITION tables are generated, various statistics
tables are calculated to summarize the 3 main tables
by providing a historical view on various personnel
counts, as illustrated in Table 2.
Table 2: Sample historical statistics table calculated from
the main Personnel Data Mart Tables. Values rounded to
the nearest 1000.
Fiscal Year Population Intake Attrition
F17/18 67,000 6,000 5,000
F18/19 68,000 6,000 6,000
F19/20 68,000 6,000 6,000
F20/21 66,000 2,000 4,000
F21/22 65,000 5,000 6,000
4.2 Output Products
A star schema around a fact table and the
corresponding dimensions produces a product that
allows the analysts to explore all the data associated
with the business function that the fact table is
modelling. Star schemas are created by joining the
dimensions tables to the fact table via unique
identifiers called keys. There are various ways in
which such schemas can be produced and
operationalized.
Star schemas can be created as views (i.e., logical
tables) inside of the database management system. A
view stores the code (e.g., using Structured Query
Language) to dynamically produce a large flat table
representing the schema. Views are one of the easiest
ways to expose the star schema data to the users.
However, the users must have access to the database
management system to use the views. The large flat
tables generated by views can also be exported to
other, more accessible formats, such as: Microsoft
Access and Microsoft Excel as well as business
intelligence tools.
A raw fact table and its corresponding dimension
tables can be directly loaded into business
intelligence tools that support dimensional modelling,
such as Microsoft Power BI or Tableau. Relationships
between the dimension tables and each fact table can
be specified inside of the tool. The resulting large flat
table can then be used by clients similar to the view
table.
Star schemas can also be represented as OLAP
cubes – multidimensional arrays of pre-computed
data. OLAP operations, such as: slice, dice, drill
down/up, roll-up, and pivot, are then applied to the
cubes for efficient data analysis.
5 CONCLUSIONS
We presented a data management system for military
personnel data as used by the OR and analytics
practitioners in the DRWA team within the Canadian
Department of National Defence. The Personnel Data
Mart expanded the workforce analytics capabilities of
the team to deliver efficient and accurate analytics
results as well as provided accurate personnel data for
various OR projects. It is now regarded as the go-to
database management system for the Canadian
Armed Forces personnel data.
The Personnel Data Mart is based on dimensional
modelling. Current technologies of columnal storage
and parallelism provide high performance on wide
tables (i.e., One Big Table (OBT)) and could be
further explored for the personnel domain. However,
dimensional modelling is still a useful and common
paradigm as it is easier to maintain and works on older
hardware and software.
WAPAT 2023 - Special Session on Workforce Analytics - Practical Application and Theory
286

The system design can be easily expanded to
support new data and data requirements. A new
business function can be added by creating a new fact
table (and corresponding schema) with minimal
impact on the existing tables. Additional data sources
can also be included with care taken to ensure that all
dimension tables are conformed. The design can also
be adapted to fit specific requirements of any military
or civilian organization.
REFERENCES
Breslin, M. (2004). Data Warehousing Battle of the Giants:
Comparing the Basics of the Kimball and Inmon
Models. Business Intelligence Journal.
Department of Defense. (2020). Preserving our
Competitive Advantage: Personnel and Readiness
Strategy for 2030.
Department of National Defence. (2017). Strong, Secure,
Engaged: Canada’s Defence Policy.
Department of National Defence. (2019). The Department
of National Defence and Canadian Armed Forces Data
Strategy.
Inmon, W. H. (2005). Building the Data Warehouse.
Indianapolis, IN: Wiley Publishing, Inc.
Kimball, R., & Caserta, J. (2004). The Data Warehouse
ETL Toolkit: Practical Techniques for Extracting,
Cleaning, Conforming, and Delivering Data.
Indianapolis, IN: Wiley Publishing, Inc.
Kimball, R., & Ross, M. (2013). The Data Warehouse
Toolkit: The Definitive Guide to Dimensional Modeling
(Third ed.). Indianapolis, IN: John Wiley & Sons, Inc.
Personnel Data Management System for Workforce Analytics
287
