
A Survey of Geospatial-Temporal Visualizations for Military Operations
G. Walsh
1 a
, N. S. Andersen
1 b
, N. Stoianov
2 c
and S. J
¨
anicke
1 d
1
Department of Mathematics and Computer Science, University of Southern Denmark, Odense, Denmark
2
Department of Computing, Bulgarian Defence Institute, Sofia, Bulgaria
Keywords:
Military Operations, Command and Control, Situational Awareness, Geospatial-Temporal Visualization
Abstract:
European defense funding has surpassed 200 billion euros per year for the first time, with a renewed strategic
interest in creating technological innovations that aid military cooperation, such as comprehensive decision-
support systems. Overcoming the many challenges associated with the research and development of such
military technologies presents an excellent opportunity for the visualization community’s contributions in the
domain, as there is ample scope for applied research. No other recent surveys examine the use and design
of Information Visualization (IV) and Visual Analytics (VA) tools in the military domain. As such, this sur-
vey’s primary interest is to investigate and assess IV and VA tools’ functionality and integration into military
decision-support systems, specifically focusing on geospatial-temporal visualization aspects. Considering this
objective, this survey systematically identifies and discusses suitable visualization solutions and the benefit
they may offer to military decision-support systems through the lens of the Military Operations Process. This
results in a domain-specific design space for analyzing various existing and relevant military products. This
survey’s outcome and main contribution is thus the formulation of a design space and analysis of existing
military products. This leads to identifying gaps, opportunities, and guidelines for where geospatial-temporal
visualizations in military decision-support systems can enhance military commanders’ decision-making capa-
bilities and ability to act.
1 INTRODUCTION
The Russian invasion of Ukraine has escalated the risk
of a spillover war with a NATO member, resulting in
18 European countries increasing military spending
in 2022. The European Defence Agency has stated,
”co-operation must now become the norm” (Quinn,
2022), calling for the increased need to develop
emerging military technological capabilities as a nec-
essary intervening variable to handle both conven-
tional and unconventional future warfare (Leuprecht,
2019). To counter these modern threats, many armed
forces have re-emphasized and re-prioritized com-
patibility and interoperability across military equip-
ment, with a desire to create common, open-source,
integrated, and secure military technology platforms
which easily enable cross-platform interactions. Fur-
ther development of such emerging military tech-
nologies requires overcoming a myriad of challenges
posed by the research, development, and implementa-
a
https://orcid.org/0000-0002-1095-5471
b
https://orcid.org/0000-0001-6926-1397
c
https://orcid.org/0000-0002-4953-4172
d
https://orcid.org/0000-0001-9353-5212
tion of such technologies. Yet, it can be an opportu-
nity for the visualization community to contribute to
the abundance of research projects in this domain.
Examples of such related challenges are many,
as described in (O’Hanlon, 2018), and include the
development of software for overcoming the threat
of cyber-warfare by devising new novel tools which
make it easier to monitor, analyze, detect, and re-
spond to unauthorized activity, the implementation of
artificial intelligence (e.g., for route-planning analy-
sis (Lazarowska, 2022)), the possibility of analyzing
multi-source military intelligence data using natural
language processing (Hecking et al., 2011), and the
development of augmented reality (AR) technologies
(Le Roux, 2010) to improve commanders’ and sol-
diers’ situational awareness. Despite the many chal-
lenges this domain is confronted with, innovations
in defensive technologies can be worthwhile pursuits
as they can benefit and permeate many domains as
well as the general public. An example of such a de-
fensive technology that evolved into universal use is
the internet which began as a modest research exper-
iment to link three early packet networks in an open-
architecture framework (Kahn et al., 1997).
Walsh, G., Andersen, N., Stoianov, N. and Jänicke, S.
A Survey of Geospatial-Temporal Visualizations for Military Operations.
DOI: 10.5220/0011902500003417
In Proceedings of the 18th International Joint Conference on Computer Vision, Imaging and Computer Graphics Theory and Applications (VISIGRAPP 2023) - Volume 3: IVAPP, pages
115-129
ISBN: 978-989-758-634-7; ISSN: 2184-4321
Copyright
c
2023 by SCITEPRESS – Science and Technology Publications, Lda. Under CC license (CC BY-NC-ND 4.0)
115

In this context, there is also a particular contem-
porary interest in supporting the functionality of new
and existing military decision-support systems by in-
tegrating Information Visualizations (IVs) and Visual
Analytics (VA) tools with advanced Graphical User
Interfaces (GUIs), producing Visual User Interfaces
(VUIs) that can support and improve well-informed
decision-making capabilities (Tardy, 2020).
The interest in developing such systems is preva-
lent as military operations are intrinsically complex
and dynamic by nature. As such, they call for visual-
izations implemented in an equally sophisticated and
advanced manner to support well-informed decision-
making. In this survey, we examine and discuss
geospatial-temporal visualization solutions and the
benefit they may offer to military operations. In this
context, we aim to identify prospective areas of fu-
ture visualization research, including elaborating on
the research prospects of innovative technologies such
as AR, micro-visualizations, and 4D representation of
geospatial-temporal data for military purposes.
No other recent surveys examine IVs and VA tools
used in the military domain, with only Gouin and Ev-
dokiou (2004) exploring the area. This survey thus
aims to provide an analysis of recent visualizations
used in the military domain to derive guidelines that
could be used in the design process of visualizations
and VA tools supporting military operations, relat-
ing visualizations to the Military Operations Process
(NATO Standardization Office (NSO), 2019b).
To outline the contents of the survey, we describe
the scope and survey methodology in Section 1.1 to
narrow the focus. Then, in Section 2, we introduce
the relevant military theory and highlight the need
for suitable geospatial-temporal visualizations in suc-
cessfully carrying out military operations.
In Section 3, we emphasize how domain-specific
constraints and military standards affect the use and
implementation of visualizations in the military do-
main. Following this, in Section 4, we describe our
design space subsequently used for analyzing twenty
military products, as shown in Table 1. Then, in Sec-
tion 5, we discuss patterns such as design and imple-
mentation gaps and opportunities identified based on
our analysis of military products. Finally, we con-
clude our survey findings in Section 6.
1.1 Scope
The related works examined were limited to those of
an unclassified nature to promote accessibility and
reproduction. This survey assesses academic liter-
ature on military operations, situational awareness,
knowledge and insight generation, human-computer
interaction, and visualization techniques. This theory
is then framed based on state-of-the-art examples in
current decision-support systems from product manu-
als/videos/images, design guides, military standards,
tech reports, and knowledge of military operations.
Survey Methodology. We searched for related
products and publications within the given survey
scope. We utilized Google Scholar to browse visu-
alization, military theory, situational awareness, and
knowledge and insight generation using relevant key-
words like ”military visualization” or ”geospatial-
temporal visualization” to gather academic refer-
ences. Reviewing each paper’s related works and sec-
tions individually, we traced every cited reference and
checked if it fitted our survey scope. In addition,
we used Google Search to find twenty relevant mili-
tary products that applied visualization and were suit-
able to be examined in our survey. We also browsed
military standards, manuals, and tech reports through
NATO’s Standardization Office’s archive
1
and mili-
tary standards aggregator EverySpec
2
.
2 BACKGROUND
Military organizations, commanders, and subordi-
nates have put forward higher requirements for accu-
rate and prompt information transfer through various
IVs, VA tools, and GUIs during the planning, execu-
tion, and assessment of military operations.
Military operations are coordinated actions con-
ducted under dynamic and uncertain conditions to
achieve objectives for a particular purpose. These ac-
tions involve various tasks carried out by different cat-
egories of military personnel, which we identify as:
Commanders. A category of military personnel who
command and control military forces and who are
involved in making decisions to achieve goals that
ultimately place military forces in the desired end
state. Commanders work at a strategic level.
Military Forces. The military personnel carrying out
the commanders’ orders and instructions. Mil-
itary forces ”on the ground” work at a tactical
level.
Intelligence data that military organizations can
gather primarily relates to time (a temporal dimen-
sion) and space (spatial dimensions) along with actors
(e.g., people) and objects (e.g., facilities and equip-
ment) and the events that they generate.
1
https://nso.nato.int/nso/nsdd/main/standards
2
http://everyspec.com/search result.php
IVAPP 2023 - 14th International Conference on Information Visualization Theory and Applications
116

Figure 1: A depiction of how visualization can be used
in the cyclic Military Operations Process to increase situ-
ational awareness, decision-making, and ability to act by
improving commanders’ cognitive perception.
The execution of military operations requires situ-
ational awareness at all levels, from the strategic to the
tactical. A general definition of situational awareness
is provided by Vidulich et al. (1994) which states situ-
ational awareness is the ”continuous extraction of en-
vironmental information, integration of this informa-
tion with previous knowledge to form a coherent men-
tal picture, and the use of that picture in directing fur-
ther perception and anticipating future events”. As
such, employment of suitable geospatial-temporal vi-
sualizations is critical as a means of achieving the
goals as set out in the the military operations process.
We define the military operations process as con-
sisting of central command and control activities per-
formed during military operations, namely planning,
execution, and assessment, as depicted in Figure 1
(Department of the Army (DA), 2019). The military
operations process can be complex and vary depend-
ing on the operations’ scale, scope and context. Fur-
thermore, the different phases of the operations pro-
cess typically overlap and recur as circumstances de-
mand. However, at all times, commanders drive the
operations process, by applying critical and creative
thinking and building and maintaining situational un-
derstanding by encouraging collaboration and dia-
logue. Each phase of the operations process consists
of a chain of high-level tasks, each with a different
emphasis on information visualization and interaction
requirements. Therefore, we separate the phases to
highlight each phase’s prominent theme to more eas-
ily discuss the various requirements and visualization
techniques that may be appropriate. The phases and
the themes of each, are described as follows:
1 Planning of the operation according to known and
established goals and objectives. In the planning
phase, emphasis is placed on the interaction with
static data (all data known at the current point in
time) through IVs that relate to the representation
and simulation of geospatial-temporal data asso-
ciated with the conception of military operations.
2 Execution of the operation by carrying out
planned actions. In the execution phase, the ac-
centuation of IVs used is placed on those which
support the monitoring of dynamic (new incom-
ing real-time) data, such as, information regarding
moving geospatial-temporal objects and stream-
ing time-series data. Furthermore, the execution
phase also relies on the effective communication
of initial orders and information from a comman-
der at a strategic level to subordinates at a lower
tactical level and vice versa.
3 Assessment of the operation, along with report-
ing and documentation for future use and analysis.
The assessment phase is predominately concerned
with IVs depicting insights derived from static
and dynamic data, such as, completing goals,
identifying trends, and providing reflections on
military operations. These all feed into the next
iteration of the military operations process.
Visualization & Military Operations. Military
operations require VUIs implemented in a sophisti-
cated manner to reduce cognitive load, promote well-
informed decision-making and provide constant sit-
uational awareness. Proper VUIs facilitate and as-
sist military commanders in successfully carrying out
and correctly perceiving numerous high-level tasks
such as collaboration, communication, interoperabil-
ity, reconnaissance, surveillance, and target acquisi-
tion while carrying out military operations. VUIs sup-
port the success of such high-level tasks by allowing
actions (Munzner, 2014) in relation to the military op-
erations process (NSO, 2019b; DA, 2019).
Visualization at the Strategic Level. Decision-
support systems support military operations. In this
context, Command and Control (C2) systems
3
are a
particular type of decision-support system that em-
body the operations process and relay a Common Op-
erational Picture (COP) to various categories of mili-
tary personnel.
3
Many derivative terms exist and emphasize different
aspects, uses, and subdomains of C2. The abbreviations
associated with these terms are numerous. We thus find it
sufficient to use C2 as a catch-all term.
A Survey of Geospatial-Temporal Visualizations for Military Operations
117

Commanders in a command center maintain an
overview by consuming the information processed
and managed by the C2 system. Commanders con-
sume the information to drive the operations process
through direct manipulation and interaction with the
information managed by the C2 system. VUIs used in
this setting operate at the strategic level and are used
by personnel in a remote site (e.g., a command cen-
ter). Such VUIs facilitate the coordination and com-
munication of information to subordinates at a lower
tactical level.
Visualization at the Tactical Level. VUIs used
at the tactical level are used by personnel ”on the
ground” (e.g., pilots, soldiers, divers). In this context,
physical constraints limit the possibilities concerning
what is and can be visualized and interacted with in a
VUI. The most prominent challenges associated with
VUIs at this level, relates to constraints such as space
limitations, light conditions, and limitations related to
operating the interfaces on the move (Motti, 2020).
3 DOMAIN SPECIFIC
CONSTRAINTS/STANDARDS
Many domain-specific constraints are associated with
implementing geospatial-temporal visualizations for
military purposes. The constraints that apply should
be considered when implementing visualizations in
military decision-support systems. These include en-
vironmental conditions, display size, workspaces, the
possibility to organize and arrange windows, and the
design of graphical interface components.
3.1 Environmental Constraints
The various environments within which military op-
erations occur directly limit equipment’s capabilities,
affecting how a VUI should be designed to ensure op-
timal usability. To overcome this, VUI components
need to be designed in a specific way to compen-
sate for the degraded viewing or operational condi-
tions that may exist in the environment, as shown in
Figure 2. When carrying out design within such con-
straints, it is vital to assess several factors, including:
• Display readability and force visibility
• A display should not create visual fatigue or loss
of coordination
• External environmental factors should be incorpo-
rated into design
Figure 2: Example of a synthetic vision system used in
head-mounted devices for military pilots. The system al-
lows permanent perception of the terrain and obstacles
around the aircraft, through direct and synthetic views, even
in poor visibility conditions. Source: (Lemoine et al., 2013).
• Equipment should be highly shock and vibration-
resistant (United States Navy, 1989; U.S. Depart-
ment Of Defense (DOD), 1969)
3.2 Displays
3.2.1 Large Displays & Video Walls
Current Implementations. Video walls are used at
a strategic level in military operations. They con-
sist of multiple smaller high-resolution screens (with
minimal bezel) placed together to give the impression
of one large display, typically larger than 60 inches.
Higher command usually uses them in centralized
command rooms in indoor conditions. The additional
real estate that video walls provide enables comman-
ders to view a ”whole picture” of operations as the
level of representation of IV is much greater.
Potential Implementations. It has been studied in
the visualization literature whether visualizations for
larger displays need to be fundamentally different
from visualizations on standard desktop displays and
whether basic visual design principles are different
for large displays. For example, in the work by An-
drews et al. (2011), an extensive list of visualization
design guidelines for large displays has been derived.
Based on these guidelines, the authors conclude that
designing visualization for larger displays is not sim-
ply a matter of scaling up existing visualizations or
displaying more data. Instead, they conclude that vi-
sualization designers need to adopt a more human-
centric perspective and highlight the importance of
IVAPP 2023 - 14th International Conference on Information Visualization Theory and Applications
118
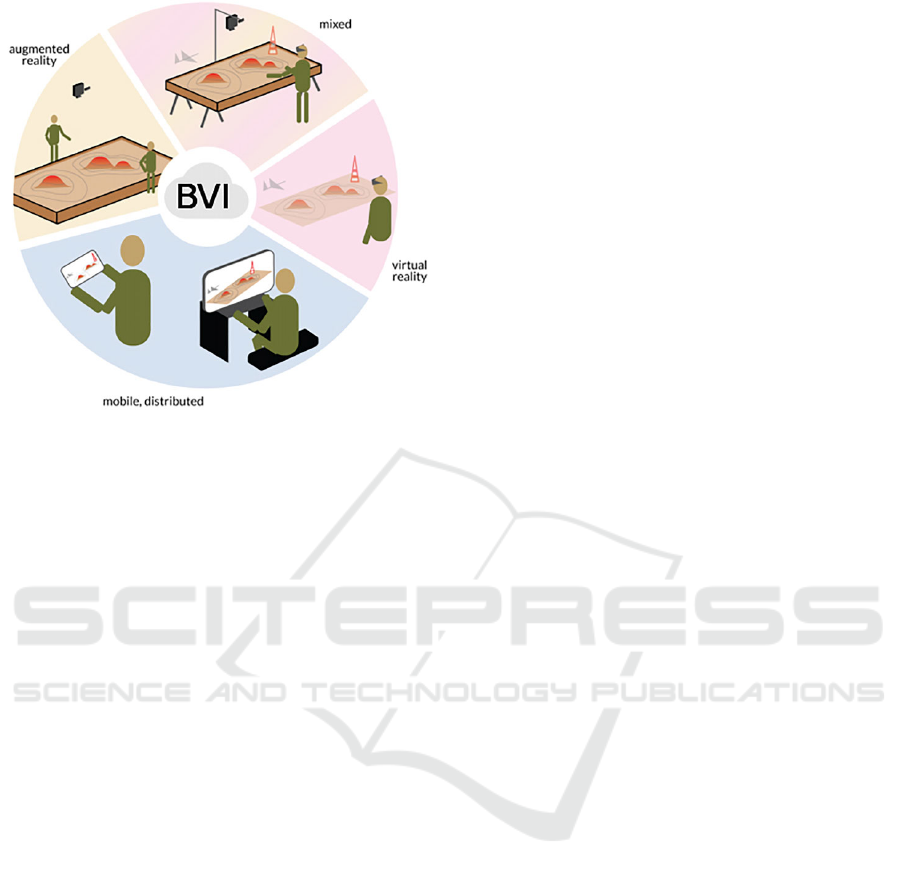
Figure 3: Example of Battlespace Visualization and Inter-
action (BVI) types illustrating augmented reality, virtual re-
ality as well as mobile and distributed, developed for visu-
alizing military operations. Source: (Boyce et al., 2022).
physical navigation in how the user will approach,
perceive, and interact with visualizations on these
larger displays. There is ample opportunity for im-
proved implementation of geospatial-temporal visual-
izations in these situations, with increasing emphasis
on human-centric design and interaction.
3.2.2 Small Displays & Alternatives
Current Implementations. Small or ”micro”-
displays are typically very small, ranging from
around 2 to 10 inches. Tactical forces ”on the
ground” typically use them to display limited but
vital information. As the screen size of these displays
is limited, so are the types and amount of visual in-
formation they can communicate to a user. Similarly,
there are alternative methods of displaying IVs during
military operations, as shown in Figure 3 where tra-
ditional visualization methods may not be sufficient.
These include papers focusing on land (Ferrin, 1999)
and the sub-sea environment (Scubapro, 2022),
which have investigated the possibility of integrating
display devices into tactical helmets in the form
of head-mounted/Head-Up Displays (HUDs), to
better provide access to situational awareness tools
(Le Roux, 2010) while also limiting the effect of the
lumination of the display on the soldier or, e.g., diver.
Potential Implementations. Developments for dis-
plays in small and head-mounted devices could in-
clude improved use of micro-visualizations, Aug-
mented Reality (AR) displays, and feature tracking
for military operations. E.g., see how the use of
HUDs within the aviation industry to augment a pi-
lot’s vision could be applied to a number of military
operations, such as sub-sea operations Lemoine et al.
(2013). However, developments of such novel tech-
nologies are not without their challenges. For ex-
ample, the Integrated Visual Augmentation System
(IVAS) using AR goggles resulted in personnel suf-
fering from nausea, headaches, and eyestrain when
using the device (Harding, 2022).
3.3 Windows & Workspaces
The arrangement of a single window or a group
of windows on display can be regarded as a user’s
workspace.
• A single-window workspace is typically dis-
played on the entire screen, enabling a user to fo-
cus on a single task. As a result, a single window
workspace is particularly well-suited to smaller
screens where display real estate is constricted.
• A multi-window workspace allows multiple win-
dows to be displayed simultaneously on a single
display. The windows in the workspace can be
overlaid over one another or divided across the
display according to a user’s needs.
Typically, in decision-support systems designed
for military purposes, workspaces designed to be
used at the strategic level by commanders are multi-
window. In contrast, workspaces intended for use at
a tactical level are typically single-window applica-
tions.
3.4 Graphical Design
Text & Military Standards: As highlighted by
Parnow (2015), carefully considered typography can
convey additional information, which may improve
VUIs by modifying the visual variables associated
with typography. For example, shape (typeface, style,
weight, width), position (spacing, indentation, align-
ment, line spacing), appearance (color, texture, opac-
ity), size (scale), orientation (rotation), underlining,
strike-through, etc. can be adjusted to alter its semi-
otics (Parnow, 2015). The choice of typefaces used in
a VUI is typically standardized within military orga-
nizations to improve consistency and ensure familiar-
ity and interoperability across organizations (see, e.g.,
standard APP-56 (NSO, 2018), which specify Arial or
Times New Roman as the preferred font). However,
a VUI designer can make particular use of, e.g., char-
acter spacing, size, and capital letters for typographic
coding, headlines, captions, and labels that need spe-
cial emphasis within this context.
A Survey of Geospatial-Temporal Visualizations for Military Operations
119
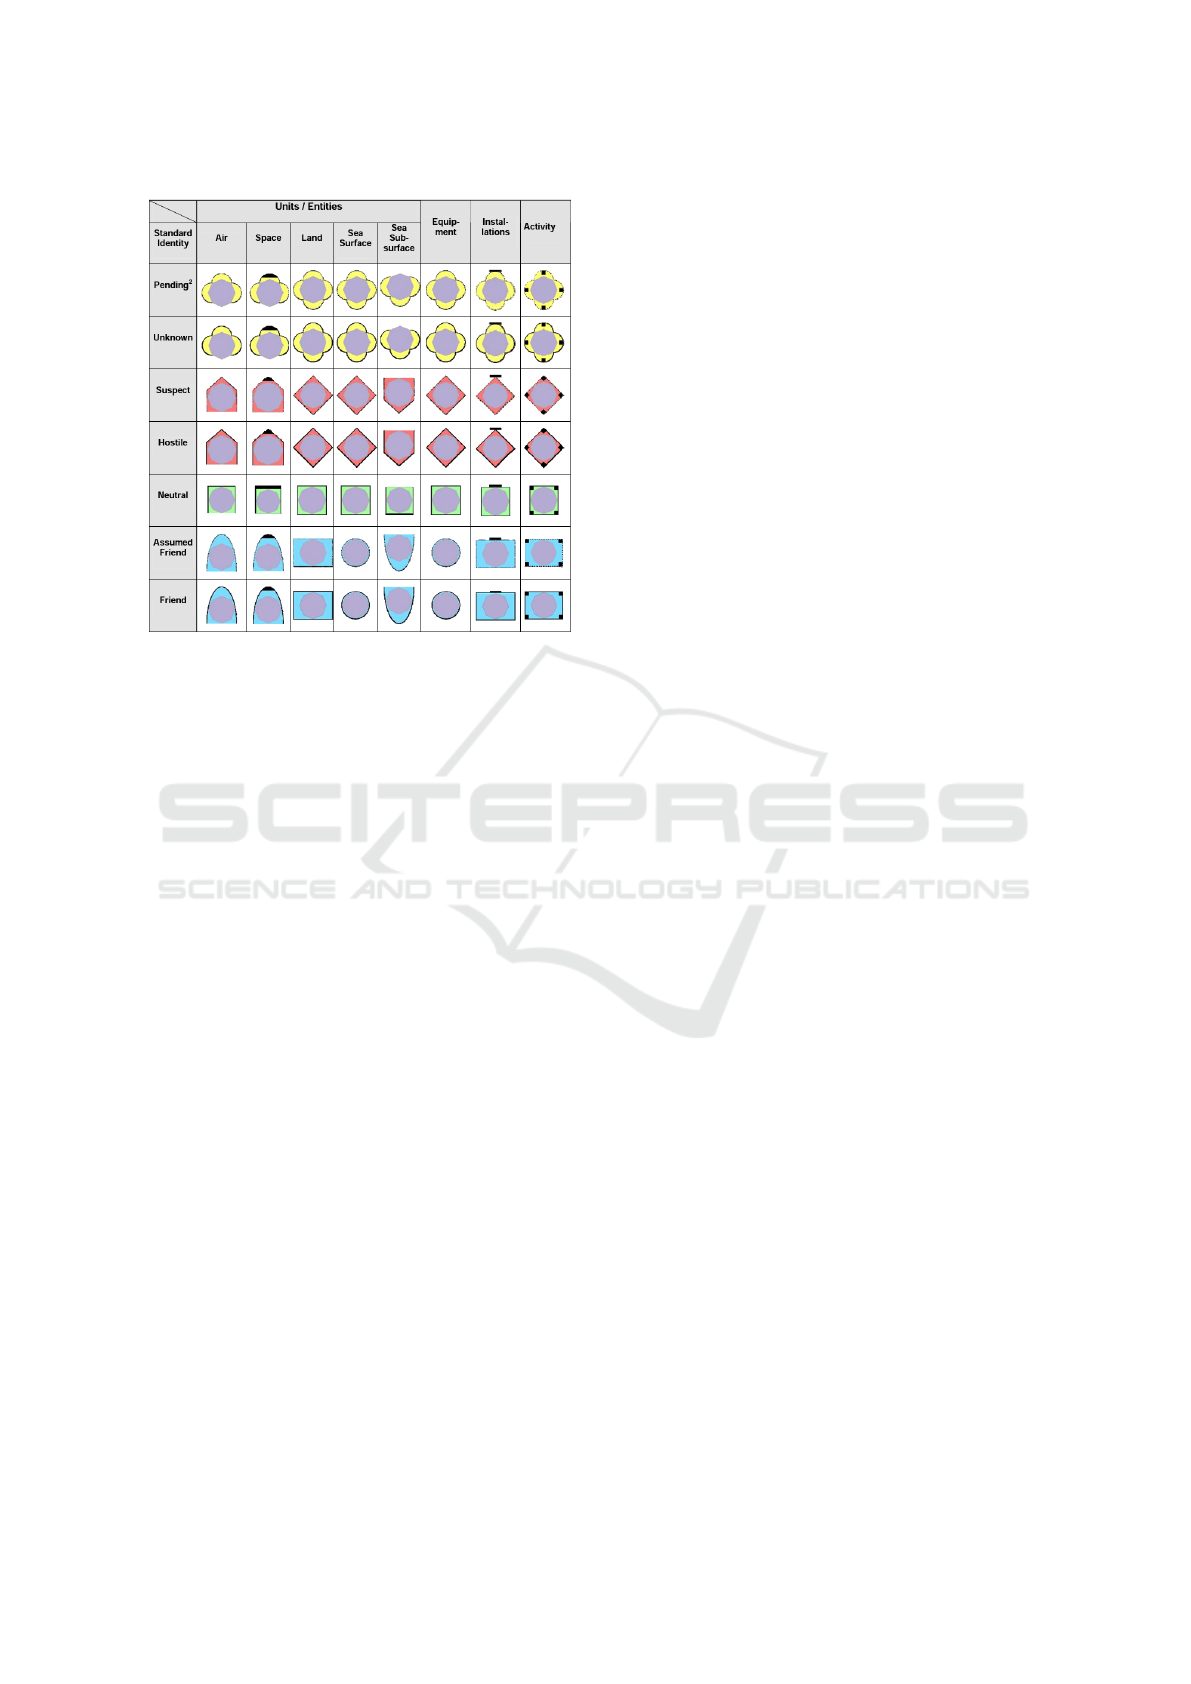
Figure 4: Illustration showing a collection of symbol frames
with their associated unit dimension. A solid line is used
to denote the certainty of identification of standard identity
and shall identify the symbol as representing friendly, hos-
tile, neutral, or unknown actors or objects. Source: NSO,
2019a.
Color & Military Standards. Color as a visual in-
dicator and signifier can be used in military VUIs to
convey different yet specific meanings. For exam-
ple, within military organizations, the colors men-
tioned next typically have the following meaning:
Red means immediate or imminent danger, yellow or
amber means caution, outside normal operating lim-
its, system malfunction, or other conditions which can
produce hazards in the longer term, green means safe,
normal operating condition (Department Of Defense
Technical Architecture Framework For Information
Management (DODTAFIM), 1996). The coloring of
text or a window can furthermore be used to indicate
the classification of the information shown in a visu-
alization in an interface (DODTAFIM, 1996).
Particular guidelines exist for military symbology.
E.g., the APP-6 standard for NATO military symbol-
ogy states that all symbol components, except the
frame fill, should be the same color (NSO, 2019a).
Furthermore, symbol implementations in a VUI must
maximize the contrast between symbols and the dis-
play background to provide optimum discriminabil-
ity (Niu et al., 2020). This contrast can be provided
by using high-contrast colors for the frame, icon, and
modifiers depending on the background and should
be incorporated into any kind of visualizations used
in military VUIs.
Symbols & Military Standards. VUIs use a vari-
ety of simple symbols and icons to help users under-
stand the items, actions, and modes they can choose.
In general, icons in VUIs work the best when they use
familiar visual metaphors directly related to the ac-
tions they initiate or the content they represent. This
is especially relevant in small displays and micro-
visualizations (Isenberg, 2022). Furthermore, sym-
bols and icons for use in military operations in spe-
cific IV contexts have been standardized to increase
interoperability across nations.
Military symbol standards describe a structured
set of graphical symbols to display information in
military C2 systems and related applications (NSO,
2019a). The standards serve as a framework for sym-
bol construction by providing a common set of build-
ing blocks that can be used to create specific sets of
symbols appropriate to particular contexts and set-
tings, as shown in Figure 4.
A proper and robust method of selecting, con-
structing, and displaying suitable symbology is vital
to military VUIs. The correct use of symbols in mil-
itary operations yields an accurate understanding of
the operational picture by commanders. It also helps
speed up the decision-making process, as graphical
representations of objects, commands, movements,
and additional information (including alphanumeric
text and colors) can be observed and readily under-
stood faster than just text alone.
4 CLASSIFICATION
Up to this point, we described theory relating to the
military operations process and VUI design consid-
erations pertaining to domain-specific constraints and
military standards. The following section describes
relevant visualization aspects crucial in assessing mil-
itary products.
This survey is predominantly concerned with
geospatial-temporal visualizations used in military
products and the domain-specific constraints that af-
fect the visualization of objects and actors at partic-
ular points in space and time. We thus describe the
most vital aspects related to how VUIs can enhance
the performance of military operations through in-
creased human cognition of the COP by appropriately
providing information regarding the internal structure
of static and dynamic data (intel) and causal relation-
ships within it.
In Table 1, we show our design space and clas-
sification system where each column in the top row
relates to a corresponding section in this survey, with
surveyed military products listed as rows.
IVAPP 2023 - 14th International Conference on Information Visualization Theory and Applications
120
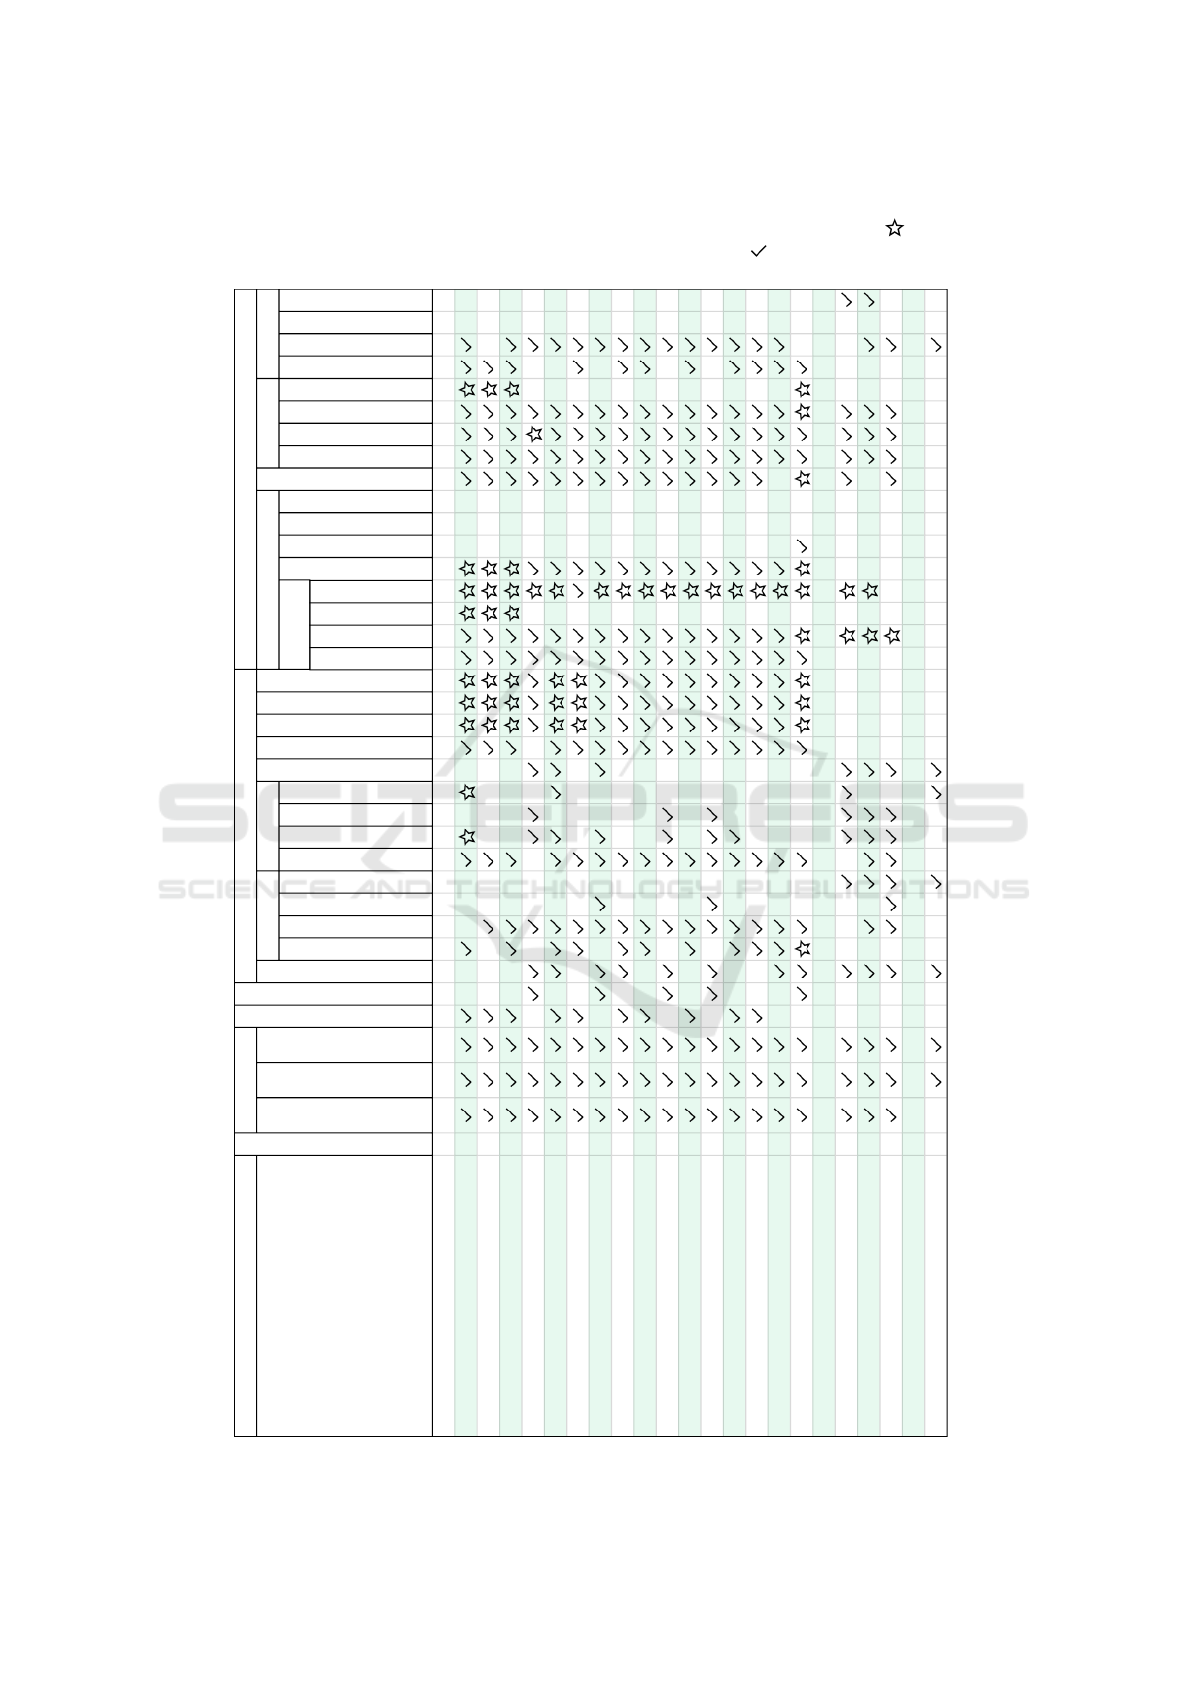
Table 1: The tabular analysis of twenty military products according to our established design space. The design space
considers the military operations process, domain-specific constraints, and visualizations utilized. Indicates that the
product have the facilities necessary and there is an opportunity for implementation. Indicates that the product implements
the feature.
Example Software
Review Rank
Operations Process
Strategic Level
Tactical Levels
Domain Specific Constraints Visualizations
Planning Phase
Execution Phase
Assesment Phase
Environmental Constraints
Ouput Devices Input Devices
Single Window
Multi Window
Text & Military Standards
Color & Military Standards
Symbols & Military Standards
Primary Visualization
Secondary Visualization
Interaction Collaboration
Video Walls
Standard Displays
Small Displays
Alternative
Keyboard / Mouse
Touchscreen
Bezel Keys
Alternative
Map
Timelines
Alternative
Data Glyphs
Word-scale Visualization
Map-based Interactions
Visualization Linking
Information Dashboards
Focus+Context
Co-located & Synchronous
Remote & Synchronous
Co-located & Asynchronous
Remote & Asynchronous
Map Primitives
Map Overlays
2D, 3D, or 4D
Spatial Comparisons
Command and Control (C2) Systems:
Lockheed Martin Corporation (C2BMC System) 20
Battlegroup Command and Control Trainer (BC2T) 19
Boeing Joint All Domain Command and Control 17
Saab AB 9Land Battle Management System (BMS) 10 2D
General Dynamics Corporation (TAIS) 11 3D
General Dynamics Corporation (IMPACT) 9 3D
General Dynamics Corporation (GeoSuite) 8 3D
Terma Maritime Misson System 7 2D
Thales Group C2 Headquarter 12 2D
Thales Group C2 Vehicular 13 2D
L3Harris Technologies hC2 Software Suite 14 2D
L3Harris Technologies hC2 C4I Modules 15 2D
Systematic Multi-Domain C2 16 3D
Airbus Fortion Joint C2 6 3D
UMISOFT ECA 1 2D
Lockheed Martin Corporation (C4ISR) 18 2D
Handheld Underwater Devices:
Artemis Pro (with PinPoint) 3 2D
UWIS 2 2D
SonaDive RTSYS 4 2D
Dive Computer Example:
Ratio Computers 5
A Survey of Geospatial-Temporal Visualizations for Military Operations
121

Figure 5: Example of Command and Control system utiliz-
ing 3D geospatial visualizations with appropriate military
symbolgy annotations. Image source: (Richardson, 2020).
4.1 Geospatial Visualizations
Map-based Visualizations. Maps visualized in
military operations have various uses, such as com-
municating the existence and the location of spa-
tial features and entities, along with the distance be-
tween them. Map-based visualizations are used in al-
most all examples analyzed in the survey. However,
only mainly utilizing 2D maps with the exceptions of
General Dynamics, Systematic, and Airbus products.
These exceptions provide cutting-edge 3D geospatial
visualizations, using 3D maps to illustrate spatial fea-
tures such as regions populated with friendly or en-
emy forces, or critical infrastructure targets, while
communicating information regarding the variations
in terrain, the altitude of natural spatial features, and
the extent of vegetation and cover (DA, 2005; Us-
beck et al., 2015), as shown in Figure 5. Implement-
ing such visualization techniques with the addition
of a temporal component could offer significant im-
provements in situational awareness, as maps allow
commanders in remote and military forces ”on the
ground” to know where they and their allies are lo-
cated, making it possible to make decisions accord-
ingly.
Map Primitives. We define primitives as basic ge-
ometric shapes that depict spatial features, entities,
or phenomena on visualized maps. These basic ge-
ometries can represent various things depending on
the context (
˙
Zyszkowska, 2016). E.g., specific points
on a map, in the context of military operations, could
represent evacuation and rescue facilities or places
to avoid. Similarly, lines can be used to represent
pre-planned routes, while polygons can be used to
indicate areas of interest that should be investigated
or avoided. From our survey, all C2 systems uti-
lize map primitives, making them an essential com-
ponent of such systems. However, the usability of
map-based primitives in such systems varies drasti-
cally, with some systems seeming unintuitive to use,
such as L3Harris. Similarly, there is room for im-
provement in terms of conveying necessary informa-
tion through map primitives by exploiting the use of
visual attributes (color/hue, texture, etc.) of such
primitives overlaid on a map, according to military
standards, theory, and their associated meaning and
intent. The map primitives are typically managed and
organized in specific map overlays or layers, which
we describe next.
Map Overlays. Map overlays superimpose multi-
ple thematic maps to reveal information about spe-
cific geographic patterns of a particular subject mat-
ter (theme) in a geographic area. The ability to add
overlays to a base map is an essential function in any
Geographical Information System (GIS), as the abil-
ity to do so opens up the possibility of gaining a new
understanding of an area based on the relationship
between the different types of maps layered on top
of each other (Romeo et al., 2019). In our analysis,
all C2 systems implement such a component. Sim-
ilarly, military symbology may be incorporated into
geospatial-temporal visualizations relevant to military
operations through a map overlay, as demonstrated in
Figure 6. However, there is an opportunity to expand
the range of map overlays offered by such systems.
Additional Military Layers. Additional Military
Layers (AML) are defined in NATO standard
STANAG 7170 as ”A unified range of digital geospa-
tial data products designed to satisfy the total-
ity of NATO non-navigational maritime defense re-
quirements” (NATO’s Geospatial Maritime Working
Group (GMWG), 2022). The data products are es-
sentially digital datasets organized in specific map
overlays and designed to meet the needs of several
military organizations. AML primarily provides in-
formation related to several environmental conditions
in the operating area that might affect the execution
2 of a military operation. The AML Handbook
(NATO’s GMWG, 2022) mentions many interesting
AMLs. However, for the purposes of this survey, the
most relevant military layers which could be of inter-
est to incorporate into geospatial-temporal visualiza-
tions are:
• Maritime Foundation and Facilities (MFF)
• Routes, Areas and Limits (RAL)
• Atmospheric and Metreological Climatology
(AMC)
Currently, there is much opportunity to further expand
the visual integration of such military layers in almost
IVAPP 2023 - 14th International Conference on Information Visualization Theory and Applications
122

all of the command and control systems assessed in
this survey.
Spatial Comparisons. Many scenarios in military
operations fundamentally rely on comparisons and
representations, along with many methods of collect-
ing and simulating data to help solve these compari-
son and representation questions (Kim et al., 2017).
In particular, there is a shortcoming in visualizing
3D geospatial and time-varying 3D geospatial data.
Geospatial 3D data can typically be represented in
one of two ways: 1) ”surface-based” representation
and 2) ”volume-based” representations. Both of these
representations present data using some form of 3D
computer graphics, where facilitating accurate spatial
perception in three dimensions and addressing occlu-
sion issues are typical concerns. Javed and Elmqvist
(2012) propose five views for composite visualiza-
tions: Juxtaposition, Superimposition, Overloading,
Nesting, and Integration, which can be used in situa-
tions where a single visualization is insufficient. Sim-
ilarly, there is ample opportunity for the visualization
community to integrate such methods in the domain
from our analysis of C2 systems.
4.2 Geospatial-temporal Visualization
Visualizing 2D & 3D Geospatial Data Temporally.
Due to advances in tracking technologies, tracking
individual objects in remarkable spatial and tempo-
ral detail is possible. This inherently geospatial-
temporal data availability can provide further insights
into dynamic processes and challenges that traditional
(static) geospatial analysis techniques cannot (Laube,
2014). Consequently, work has appeared address-
ing several aspects related to modeling, storing, in-
dexing, querying, and analyzing geospatial-temporal
data (Hamdi et al., 2021). In turn, the research field
studying the mapping and visualization of geospatial-
temporal data has also received a great deal of atten-
tion. Due to the dynamic nature of the geospatial-
temporal data captured, various visualization tech-
niques have taken advantage of this by represent-
ing the data in various ways. Visualization tech-
niques utilize 2 and 3 spatial dimensions and the
possibility of showing the progress of moving ob-
jects over time in such spaces. In addition, the op-
tion of visually encoding attributes of the object via
color or texture is also accounted for temporally. As
a result, many geospatial-temporal data visualization
techniques have been developed and published An-
drienko et al. (2010); Sibolla et al. (2016); Zhu et al.
(2021). Furthermore, the existing methods have also
been studied from the perspective of the types of data
they can be applied to and the types of exploratory
tasks they can support (see Andrienko et al. (2003)).
The use and depiction of geospatial-temporal data
especially come into play in visualizing military op-
erations in terms of representing objects and actors on
a map over time. E.g., the correct application of vi-
sualization techniques in military operations through
the geospatial-temporal representation of objects and
actors can help illustrate to commanders the evolution
of such entities’ movement, which can be recorded in
terms of a trajectory that can be visualized in several
ways. E.g., simply as a fixed or fading trace of the
continuous and true path of the moving entity sam-
pled at discrete points in time.
For this survey, we define 4D representations as a
time-series of 3D geospatial data. According to our
survey, state-of-the-art implementations of these vi-
sualizations appear in General Dynamics, Systematic,
and Airbus products.
Timelines. A timeline is essential for sense-making
regarding how sequences of events unfold or re-
sources are used over time. As such, they can be in-
valuable tools to command and tactical forces in the
planning, execution, and assessment 1/3 of military
operations. This is the case, as a timeline allows a user
to examine information chronologically and identify
temporal patterns and relationships. Therefore, time-
line visualizations should preferably enable the inter-
active temporal grouping of events with the possibil-
ity to further explore underlying or associated data vi-
sually and take notes (Nguyen et al., 2014). For ex-
ample, a C2 system may implement a timeline in con-
junction with cartographic maps to better understand
how sequences of events may unfold in military op-
erations. While a temporal element is used in all C2
systems surveyed, the interaction potential for such a
component is not realized in any examples analyzed.
It represents a significant opportunity for the visual-
ization community’s input.
4.3 Visualization Interaction
In terms of interaction techniques in interactive data
visualization, a specific set of high-level interactions
is established in Munzner’s Framework and discussed
in-depth in her book ”Visualization Analysis, and De-
sign” (Munzner, 2014). This abstraction hierarchy
categorizes high-level and low-level tasks that can
be applied to the geospatial-temporal visualizations
in military operations examined in this survey. E.g.,
actions broken down into user goals of ”analyze”,
”search”, and ”query” can be applied to visualizations
used in military C2 systems.
A Survey of Geospatial-Temporal Visualizations for Military Operations
123

Figure 6: Example of Holographic Tactical Sandbox Aug-
mented Reality mission preparation system implemented
with relevant military graphics. Source: (Airbus, 2022).
Map-Based Interactions. During the planning
phase 1 of military operations, there may be a need
to manage various assets or objects on a map over a
period of time. This could be achieved through inter-
action with visualizations using geospatial-temporal
data to represent these different assets or objects. As
such, a commander creating a plan or various run-
through options should be able to edit, delete or cre-
ate/place assets using such a visualization effortlessly.
Furthermore, the interaction design of such visual-
izations should be designed such that a plan can be
edited and deleted and what-if scenarios can be read-
ily devised. During the drawing and editing of as-
sets/objects, the user must be able to undo and redo
actions. In addition, the assets should be manageable
and be allowed to be linked to a specific order. As
mentioned previously, low-level actions, such as ”se-
lect”, ”navigate”, ”arrange”, ”change”, ”filter”, and
”aggregate,” could be applied in such a manner to
achieve these high-level tasks mentioned above using
map-based 2D or 3D interactions. All such interac-
tions are implemented in C2 systems surveyed in the
paper, making them an essential element of such in-
formation systems.
In the planning phase 1 , many high-level tasks
performed by a commander are carried out in a col-
laborative setting where different people with differ-
ent roles will reason and cooperate intensively using
a collaborative digital map (Figure 6). Therefore, es-
sential assets and objects should be presented to com-
manders on this 2D or 3D geospatial-temporal visual-
ization to allow suitable actions of the planning phase
1 , such as to help devise a plan of action and predict
resource requirements. E.g. in this case, appropri-
ate actions may be the selection of military objects,
easy navigation of the map, arrangement of military
Figure 7: Image illustrating the information visualization
technique of focus plus context to present information.
Source: (H
¨
ollt et al., 2019).
assets, adjustment of parameters, filtering of objects,
and clustering of objects.
Map Navigation. Typical methods of achieving in-
tuitive map navigation could be the use of ”click and
drag” (or ”touch and drag”), ”double click to zoom”,
”scroll to zoom”, ”pinch to zoom”, the use of arrow
keys to pan (important for accessibility), or plus and
minus keys to zoom (Heyman, 2022). These basic
map navigation methods are implemented across all
C2 systems surveyed. Additionally, more sophisti-
cated data-driven maps may use automatic zooming
and panning when an event occurs, for example, a
user selecting a region or creating a key-frame in a
military plan narrative. In cases where a narrative may
occur, e.g., when a commander creates run-through
scenarios, key moments on a map may be presented
as a narrative that is advanceable using buttons. Cur-
rently, none of the systems surveyed include such a
visualization technique.
Focus+Context. Focus plus context as a method of
IVs enables one to see the object of primary interest
presented in complete detail while at the same time
gaining an overview of the surrounding information
available. This technique can be a very spatially effi-
cient method of allowing the user to view detailed in-
formation regarding spatial data. As seen in Figure 7,
we can see how this visualization can be effective in
representing two different types of spatial data simul-
taneously, effectively (Card et al., 1999). None of the
visualizations in the military products examined im-
plement such a technique, presenting another oppor-
tunity for visualization to improve situational aware-
ness.
4.4 Collaboration
Collaboration occurs in an environment where ”par-
ticipants are encouraged to use critical thinking;
IVAPP 2023 - 14th International Conference on Information Visualization Theory and Applications
124

solve problems; and share information, knowledge,
perceptions, ideas, and concepts in a spirit of mu-
tual cooperation” (DOD, 2018). As such, devices,
software tools, and infrastructure that facilitates col-
laboration are aimed at connecting the right people
and data at the right time to complete a task solve
a problem, or discuss something of mutual interest.
Geospatial-temporal visualizations aid this goal in the
planning, execution, and assessment phase
1/3 of
military operations.
Vital to visualizing information intended for mili-
tary collaboration is the possibility to establish a COP,
which is a single identical display of relevant informa-
tion (e.g., maps with the position of own forces and
enemy forces, position and status of critical infras-
tructure such as bridges, roads, etc.) shared by more
than one command. A COP facilitates further collab-
orative planning and execution 1/2 and improves sit-
uational awareness across echelons.
In this survey, we use the Computer Supported
Cooperative Work (CSCW) time-space matrix to
group collaboration types according to Pedersen and
Koumaditis (2020):
• (Temporal dimension) The interaction of users oc-
cur at the same time (synchronous)
• (Temporal dimension) The interaction of users oc-
cur at different times (asynchronous)
• (Spatial dimension) Users are co-located
• (Spatial dimension) Users interact remotely
Out of the four categories introduced by the
CSCW matrix, synchronous and co-located, along
with asynchronous and remote collaboration, are es-
pecially important within military organizations as
synchronous and co-located collaboration can be said
to happen between commanders and their staff in a
command center. In contrast, asynchronous and re-
mote collaboration can be said to occur, e.g., between
commanders and military personnel ”on the ground”.
These two types of collaboration can be said to pri-
marily occur in the planning phase 1 and execution
phase 2 of military operations.
5 DESIGN IMPLICATIONS
A design space describes possible design choices of
varying utility and can be used to derive design guide-
lines and highlight gaps in current solutions. Devel-
oping design guidelines for VUIs used for decision
support can be valuable in reducing the workload of
VUI engineers. In the context of VUI design, a design
space helps to understand and tackle challenges such
as how to:
• Decide on the combination of visualization tech-
niques most suitable for domain tasks.
• Compare existing visualization approaches to
identify their advantages and disadvantages.
The design space this survey assembles empha-
sizes and covers VUI aspects relevant to designing
and developing IVs and GUIs for military decision-
support systems and devices used in extreme situa-
tions characterized by high uncertainty, high risk, and
severe time pressure. However, the design space does
not account for aspects such as data and run-time
complexity, which also influences VUI design and the
choice of visualization techniques. Our design space
is shown in Table 1. The design space is a method
for analyzing twenty VUIs of military products and
connected devices selected in the survey to be com-
pared in terms of several distinct design considera-
tions, which can provide a basis for guidelines when
implementing geospatial-temporal visualizations in
this context. This design space examines the exam-
ples under the broad categories of review rank, op-
erations process, domain-specific considerations, and
types of visualizations utilized in such systems. From
our analysis, several implications emerged from the
design space, which we describe in the following.
Implementation of Military Standards. The use
of text highlights an area for potential improvement
across all products. Most of the examples (except
some C2 systems) in our analysis do not strictly ad-
here to and utilize the relevant military standards in
terms of text. Improvements in this area could offer
benefits such as increased legibility, consistency, and
familiarity with military personnel across products
used in military operations. Furthermore, improved
adherence and implementation of text according to
relevant military standards could result in decreased
cognitive load and the possibility of more quickly
gaining a COP and increased consistency across prod-
ucts and nations.
A similar observation can be made regarding
color, where most products do not appear to utilize
color according to the relevant military standards to
their maximum potential. Using color according to
relevant military standards could increase usability,
decrease cognitive load and increase responsiveness
amongst military personnel.
According to our analysis, symbology, as a cat-
egory of analysis, suggests the most significant po-
tential for improvement. Strict compliance with rele-
vant military symbology standards is rare. Similarly,
A Survey of Geospatial-Temporal Visualizations for Military Operations
125

there is much scope for improvements in terms of us-
ing metaphors and semiotics in iconography used in
the different products. Implementing such improve-
ments would lend itself to increasing the usability of
the products. Furthermore, it would improve cohe-
siveness and reduce the cognitive load of using such
products.
Map-based Primary Visualizations. Our analysis
of map-based primary visualizations has highlighted
that there may be a disparity in functionality between
systems that utilize map-based primary visualizations
in command and control products and those used in
C2 systems, handheld devices, or small alternative
devices. As such, our analysis has highlighted the
potential to increase map-based primary visualization
capabilities in such devices. For example, such ad-
vancements in map-based primary visualizations in
smaller devices may be achieved by increasing map
overlay and primitive capabilities, increased use of
micro-visualizations, or AR head-mounted devices.
Furthermore, there is a broad scope for improvement
by increasing spatial comparison capabilities, for ex-
ample, through juxtaposition. This is also true for en-
abling multiple layers for additional military layers,
which would similarly increase the capability and ef-
fectiveness of primary visualizations in such devices.
Time-based Geospatial Primary Visualizations.
Primary visualization capacity could be improved by
extending timelines linked to geospatial visualiza-
tions. Including such time-based visualization tech-
niques could enhance military personnel’s ability to
run through what-if scenarios, better understand how
operations play out over time and replay analysis and
assessment
3 of operations.
Alternative & Micro-visualizations. The analysis
of other methods of primary visualizations found that,
overwhelmingly, spatial visualization methods were
the predominant alternative method of displaying pri-
mary visualizations. Furthermore, data glyphs and
word-scale visualizations were not utilized in the ana-
lyzed examples. However, using micro-visualizations
might be an avenue worth pursuing in future research.
Particularly in military sub-sea operations, they may
be of great value to handheld and smaller alternative
devices such as dive computers.
Secondary Visualizations. Our analysis found no
robust trend regarding secondary graphics used in the
examples analyzed, as examples utilize a broad range
of secondary graphics, including diagrams, images,
and data visualizations. Our analysis, however, found
that using images in smaller devices may be a valu-
able development and innovation.
Interaction. In the analyzed examples, there was a
wide and consistent use of interaction methods, in-
cluding map-based interactions, visualization linking,
and information dashboards utilized in all examples
except the smallest analyzed example. However, our
analysis did identify that while most examples use a
wide range of interaction techniques, only some of
the analyzed examples employed the focus plus con-
text interaction method. The focus plus context in-
teraction makes it possible to display essential data
at the focal point at full size and detail and display
the area around the focal point (the context) to help
make sense of how the critical information relates to
the entire data structure. This interaction method may
greatly benefit military operations and, as such, be
considered for implementation in future research.
6 CONCLUSIONS
Through the lens of visualization concepts and the-
ory, this survey examined several academic stud-
ies related to military theory and situational aware-
ness, as well as twenty examples of modern mili-
tary products, to gain an understanding of the types
of geospatial-temporal visualizations that military or-
ganizations use. Some examples highlight novel
geospatial-temporal visualization methods, e.g., (Air-
bus, 2022), which incorporate emerging technologies
such as AR, 4D geospatial visualization, and holo-
graphic tactical sandbox simulation appropriately to
suit the high-level tasks of the domain. However,
many of the examples examined in this survey fall
short of this endeavor for lack of appropriate con-
sideration of the domain-specific constraints, which
include environmental constraints, display size, input
devices, and suitable graphic design. With these fac-
tors in mind, additional research must be conducted
to assess further geospatial-temporal visualization so-
lutions used in military products. The design space
we provided is based on analyzing academic litera-
ture and studying twenty relevant military products.
We aim to further use the results of this research as a
well-grounded foundation to share and grow knowl-
edge on geospatial-temporal visualization techniques
used in the military domain.
IVAPP 2023 - 14th International Conference on Information Visualization Theory and Applications
126

ACKNOWLEDGEMENTS
Some images in the survey paper are included under
the fair use copyright principle, which allows for the
free use of portions of copyrighted materials for pur-
poses of commentary and discussion. Image courtesy
of Lemoine et al. (2013); Boyce et al. (2022); NATO
Standardization Office (NSO) (2019a); Richardson
(2020); Airbus (2022); H
¨
ollt et al. (2019).
The European Defence Industrial Development
Programme has supported this research under the
project CUIIS
4
(Grant Agreement EDIDP-UCCRS-
EDD-2020-059 — CUIIS). The authors are solely re-
sponsible for this work which does not represent the
opinion of the European Commission. The European
Commission is not responsible for any use that might
be made of information contained in this paper.
REFERENCES
Airbus (2022). Holographic tactical sandbox augmented re-
ality mission preparation. URL: https://www.intellig
ence-airbusds.com/files/pmedia/public/r66562 9 h
olographic-tactical-sandbox-collaborative-tool.jpg.
Accessed: 17-12-2022.
Andrews, C., Endert, A., Yost, B., and North, C. (2011). In-
formation visualization on large, high-resolution dis-
plays: Issues, challenges, and opportunities. Informa-
tion visualization, 10(4):341–355.
Andrienko, G., Andrienko, N., Demsar, U., Dransch, D.,
Dykes, J., Fabrikant, S. I., Jern, M., Kraak, M.-J.,
Schumann, H., and Tominski, C. (2010). Space, time
and visual analytics. International journal of geo-
graphical information science, 24(10):1577–1600.
Andrienko, N., Andrienko, G., and Gatalsky, P. (2003). Ex-
ploratory spatio-temporal visualization: an analytical
review. Journal of Visual Languages & Computing,
14(6):503–541.
Boyce, M. W., Thomson, R. H., Cartwright, J. K., Felt-
ner, D. T., Stainrod, C. R., Flynn, J., Ackermann, C.,
Emezie, J., Amburn, C. R., and Rovira, E. (2022).
Enhancing military training using extended reality: A
study of military tactics comprehension. Frontiers in
Virtual Reality, 3.
Card, S., Card, M., Mackinlay, J., and Shneiderman, B.
(1999). Readings in Information Visualization: Us-
ing Vision to Think. Interactive Technologies. Elsevier
Science.
Department Of Defense Technical Architecture Framework
For Information Management (DODTAFIM) (1996).
Volume 8: Dod human computer interface style guide.
version 3. Technical report, Department Of Defense
Technical Architecture Framework For Information
Management.
4
Dissemination website available at: https://cuiis.eu/
Department of the Army (DA) (2005). Map reading and
land navigation. https://irp.fas.org/doddir/army/fm
3-25-26.pdf. Field Manual.
Department of the Army (DA) (2019). The operations pro-
cess (adp 5-0). https://armypubs.army.mil/epubs/DR
pubs/DR a/ARN18126-ADP 5-0-000-WEB-3.pdf.
Doctrine on the Operations Process.
Ferrin, F. J. (1999). Update on optical systems for mili-
tary head-mounted displays. In Lewandowski, R. J.,
Haworth, L. A., and Girolamo, H. J., editors, Helmet-
and Head-Mounted Displays IV, volume 3689, pages
178 – 185. International Society for Optics and Pho-
tonics, SPIE.
Gouin, D. and Evdokiou, P. (2004). A showcase of vi-
sualization approaches for military decision makers.
Technical report, Defence Research and Development
canadavalcartier (Qu
´
ebec).
Hamdi, A., Shaban, K. B., Erradi, A., Mohamed, A., Rumi,
S. K., and Salim, F. D. (2021). Spatiotemporal data
mining: A survey on challenges and open problems.
CoRR, abs/2103.17128.
Harding, S. (2022). United staes army soldiers felt ill while
testing microsoft’s hololens-based headset. URL: http
s://bit.ly/3FyHskb. Accessed: 27-11-2022.
Hecking, M., Wotzlaw, A., and Coote, R. (2011). Multi-
lingual content extraction extended with background
knowledge for military intelligence. Technical report,
Fraunhofer Society Wachtberg (Germany) Fraunhofer
Inst for Communication.
Heyman, D. (2022). Cartography guide, map interaction.
URL: https://axismaps.com/guide/map-interaction.
Accessed: 15-11-2022.
H
¨
ollt, T., Vilanova, A., Pezzotti, N., Lelieveldt, B., and
Hauser, H. (2019). Focus+context exploration of hi-
erarchical embeddings. Computer Graphics Forum,
38(3):569–579.
Isenberg, P. (2022). Micro Visualizations: Design and Anal-
ysis of Visualizations for Small Display Spaces. PhD
thesis, Universit
´
e Paris-Saclay.
Javed, W. and Elmqvist, N. (2012). Exploring the design
space of composite visualization. In 2012 IEEE Pa-
cific Visualization Symposium, pages 1–8.
Kahn, R., Leiner, B. M., Cerf, V. G., Clark, D. D., Klein-
rock, L., Lynch, D. C., Postel, J., Roberts, L. E., and
Wolff, S. (1997). The evolution of the internet as a
global information system. The International infor-
mation & library review, 29(2):129–151.
Kim, K., Carlis, J. V., and Keefe, D. F. (2017). Comparison
techniques utilized in spatial 3d and 4d data visualiza-
tions: A survey and future directions. Computers &
Graphics, 67:138–147.
Laube, P. (2014). Computational Movement Analysis.
SpringerBriefs in Computer Science. Springer Inter-
national Publishing.
Lazarowska, A. (2022). Safe Trajectory Planning for Mar-
itime Surface Ships, volume 13. Springer International
Publishing, Cham, 1. 2022 edition.
Le Roux, H. (2010). The use of augmented reality in
command and control situation awareness. Scientia
A Survey of Geospatial-Temporal Visualizations for Military Operations
127

Militaria: South African Journal of Military Studies,
38(1):115–133.
Lemoine, O., Franc¸ois, J.-M., and Point, P. (2013). Con-
tribution of TopOwl head mounted display system in
degraded visual environments. In Bernier, K. L. and
G
¨
uell, J. J., editors, Degraded Visual Environments:
Enhanced, Synthetic, and External Vision Solutions
2013, volume 8737, page 87370B. International So-
ciety for Optics and Photonics, SPIE.
Leuprecht, C. (2019). The enhanced forward presence: in-
novating nato’s deployment model for collective de-
fence. Technical report, NATO Defense College.
Motti, V. G. (2020). Wearable Interaction. Springer Inter-
national Publishing, Cham, 1. 2020 edition.
Munzner, T. (2014). Visualization Analysis and Design. AK
Peters Visualization Series. CRC Press.
NATO Standardization Office (NSO) (2018). Nato standard
aap-56: Military correspondence. edition a version 1.
URL: https://www.coemed.org/files/stanags/05 AAP
/AAP-56
EDA V1 E.pdf. Accessed: 25-05-2022.
NATO Standardization Office (NSO) (2019a). Nato joint
military symbology app-6(d). https://litpolukrbrig.wp
.mil.pl/u/APP-6D JOINT MILITARY SYMBOLO
GY. 16 October 2017.pdf. Accessed: 28-11-2022.
NATO Standardization Office (NSO) (2019b). Nato stan-
dard ajp-5 allied joint doctrine for the planning of op-
erations. https://www.coemed.org/files/stanags/01 A
JP/AJP-5 EDA V2 E 2526.pdf. Accessed: 24-10-
2022.
NATO’s Geospatial Maritime Working Group (GMWG)
(2022). Nato additional military layers handbook:
Information superiority in the maritime environment.
URL: https://assets.admiralty.co.uk/public/2022-06/
20220322 NATO%20AML%20Handbook%20Editi
on%205.pdf?VersionId=in9okGHLWSu0hqMdO0i
hTlNgWggo86hq. Edition 5 March 2022. Accessed:
15-11-2022.
Nguyen, P. H., Xu, K., Walker, R., and Wong, B. L. W.
(2014). Schemaline: Timeline visualization for sense-
making. In 2014 18th International Conference on
Information Visualisation, pages 225–233.
Niu, Y., Ma, G., Xue, W., Xue, C., Zhou, T., Gao, Y.,
Zuo, H., and Jin, T. (2020). Research on the col-
ors of military symbols in digital situation maps based
on event-related potential technology. ISPRS Interna-
tional Journal of Geo-Information, 9(7).
O’Hanlon, M. E. (2018). Forecasting change in mili-
tary technology, 2020-2040. Military Technology,
2020:2040.
Parnow, J. (2015). Micro visualisation: How can micro vi-
sualisations enhance text comprehension, memorabil-
ity, and exploitation? URL: https://microvis.info/th
esis/. Master’s thesis, Potsdam University of Applied
Sciences. Accessed: 02-11-2022.
Pedersen, G. and Koumaditis, K. (2020). Virtual reality (vr)
in the computer supported cooperative work (cscw)
domain: A mapping and a pre-study on functionality
and immersion. In Chen, J. Y. C. and Fragomeni, G.,
editors, Virtual, Augmented and Mixed Reality. Indus-
trial and Everyday Life Applications, pages 136–153,
Cham. Springer International Publishing.
Quinn, P. (2022). European defence spending surpasses
C200 billion for first time. European Defence Agency.
URL: https://eda.europa.eu/news-and-events/news/2
022/12/08/european-defence-spending-surpasses-2
00-billion-for-first-time-driven-by-record-defence-i
nvestments-in-2021. Accessed: 22-12-2022.
Richardson, J. (2020). Systematic’s sitaware headquarters
for british army. URL: https://euro-sd.com/2020/11/
articles/exclusive/19841/sitaware-for-british-army-3
rd-division/. Accessed: 7-11-2022.
Romeo, L., Nelson, J., Wingo, P., Bauer, J., Justman,
D., Rose, K., and National Energy Technology
Lab. (NETL), Albany, O. U. S. (2019). Cumulative
spatial impact layers: A novel multivariate spatio-
temporal analytical summarization tool. Transactions
in GIS, 23(5):908–936.
Scubapro (2022). Scubapro - galileo hud user manual.
URL: https://ww2.scubapro.com/en-GB/HKG/inst
ruments/computers/products/galileo-hud.aspx. Ac-
cessed: 31-10-2022.
Sibolla, B., Van Zyl, T., and Coetzee, S. (2016). Towards
the development of a taxonomy for visualisation of
streamed geo-spatial data. ISPRS Annals of Pho-
togrammetry, Remote Sensing & Spatial Information
Sciences, 3(2).
Tardy, T. (2020). “nato 2030. united for a new era“: A
digest. http://www.jstor.org/stable/resrep27747.
Accessed: 29-10-2022.
United States Navy (1989). Military specification: Shock
tests. h.i. (high-impact) shipboard machinery, equip-
ment, and systems, requirements for. URL: http:
//everyspec.com/MIL- SPECS/MIL- SPECS- MIL
-S/MIL-S-901D 14581/. Accessed: 25-11-2022.
U.S. Department of Defence (DOD) (2018). Joint publica-
tion 3-0: Joint operations. https://irp.fas.org/doddir/d
od/jp3 0.pdf. U.S. Department of Defence. Accessed:
15-11-2022.
U.S. Department Of Defense (DOD) (1969). Military stan-
dard: Mechanical vibrations of shipboard equipment.
URL: http://everyspec.com/MIL-STD/MIL-STD-0
100-0299/MIL-STD-167-1 22419/. Accessed: 25-
11-2022.
Usbeck, K., Gillen, M., Loyall, J., Gronosky, A., Ster-
ling, J., Kohler, R., Hanlon, K., Scally, A., Newkirk,
R., and Canestrare, D. (2015). Improving situa-
tion awareness with the Android Team Awareness
Kit (ATAK). In Carapezza, E. M., editor, Sensors,
and Command, Control, Communications, and Intelli-
gence (C3I) Technologies for Homeland Security, De-
fense, and Law Enforcement XIV, volume 9456, page
94560R. International Society for Optics and Photon-
ics, SPIE.
Vidulich, M., Dominguez, C., Vogel, E., and McMillan, G.
(1994). Situation awareness: Papers and annotated
bibliography. Technical report, Air Force Materiel
Command, Wright-Patterson Air Force Base, Ohio.
Zhu, Y., Kancharla, P. R., and Talluru, C. S. K. (2021). A
taxonomy of spatial-temporal data visualization. In
IVAPP 2023 - 14th International Conference on Information Visualization Theory and Applications
128

2021 25th International Conference Information Vi-
sualisation (IV), pages 223–228. IEEE.
˙
Zyszkowska, W. (2016). Visual features of cartographic
representation in map perception. Polish Cartograph-
ical Review, 48(1):5–15.
A Survey of Geospatial-Temporal Visualizations for Military Operations
129
