
Brain Tumor Segmentation of Lower-Grade Glioma Across MRI Images
Using Hybrid Convolutional Neural Networks
Amal Jlassi
1
, Khaoula ElBedoui
1,2
and Walid Barhoumi
1,2
1
Universit
´
e de Tunis El Manar, Institut Sup
´
erieur d’Informatique, Research Team on Intelligent Systems in Imaging and
Artificial Vision (SIIVA), LR16ES06 Laboratoire de Recherche en Informatique, Mod
´
elisation et Traitement de l’Information
et de la Connaissance (LIMTIC), 2 Rue Abou Rayhane Bayrouni, 2080 Ariana, Tunisia
2
Universit
´
e de Carthage, Ecole Nationale d’Ing
´
enieurs de Carthage,
45 Rue des Entrepreneurs, 2035 Tunis-Carthage, Tunisia
Keywords:
Deep Learning, Brain Segmentation, MRI, LGG, Hybrid Convolutional Neural Networks.
Abstract:
Low-Grade Gliomas (LGG) are the most common malignant brain tumors that greatly define the rate of sur-
vival of patients. LGG segmentation across Magnetic Resonance Imaging (MRI) is common and necessary
for diagnosis and treatment planning. To achieve this challenging clinical need, a deep learning approach that
combines Convolutional Neural Networks (CNN) based on the hybridization of U-Net and SegNet is devel-
oped in this study. In fact, an adopted SegNet model was established in order to compare it with the most
used model U-Net. The segmentation uses FLuid Attenuated Inversion Recovery (FLAIR) of 110 patients of
LGG for training and evaluations. The highest mean and median Dice Coefficient (DC) achieved by the hybrid
model is 83% and 85.7%, respectively. The obtained results of this work lead to the potential of using deep
learning in MRI images in order to provide a non-invasive tool for automated LGG segmentation for many
relevant clinical applications.
1 INTRODUCTION
According to the World Health Organisation (WHO),
Low-Grade Gliomas (LGG) are a class of grade I
and grade II brain tumors. Contrary to LGG grade
I, which is frequently curable by surgical resection,
LGG grades II and III are infiltrative and reach
to reproduce the higher-grade lesion (Louis et al.,
2016). Furthermore, and as reported by WHO also,
an increasing number of LGG grade II has been
incidentally found throw cervical MRI (Magnetic
Resonance Imaging), however 3.8% to 10.4 % of pa-
tients do not have obvious tumor-related symptoms.
Furthermore, in its fifth edition of 2021 relating to the
classification of tumors of the central nervous system,
the WHO affirms that LGG and glioneuronal tumors
account more than 30% of pediatric neoplasms of
the central nervous system. Thus, LGG is one of the
most commonly encountered brain tumors among
children, and the number of affected children may
dramatically rise. Indeed, as per the data published on
the site cancer.net, it is estimated that approximately
5, 900 brains will be diagnosed with brain tumors
this year (02/2022) in children ages 0 to 19 years
in the United States. In terms of diagnosis, MRI is
usually used throughout the neuro-oncology patient
treatment since routine structural imaging provides
particular anatomical and pathological information.
However, predicting patient outcomes based only on
MRI data for these tumors are imprecise and suffers
from the clinicians’ inter-variability (Network,
2015). To deal with this issue, subtypes of LGG
were defined across the clustering of patients based
on DNA methylation, gene expression, DNA copy
number, and microRNA expression (Mazurowski,
2015). Radiogenomics, as a new research direction
in this field, aims to explore the relationship between
tumor genomic characteristics and medical imaging
such as MRI (Mazurowski, 2015). Currently, the
first step when extracting tumor features was the
manual segmentation of MRI by neuroradiologists or
clinicians. However, manual segmentation is costly,
and time-consuming, and results often lead to inter-
observer variability, which can significantly sway the
diagnosis. In an effort to overcome these limitations,
automatic LGG segmentation seems to be one of
the effective solutions. Recently, progress in Deep
Learning (DL) for automatic brain segmentation has
carried out a level that achieves the performance of a
skilled radiologist. However, most of the existing DL
works have been focused on glioblastoma, compar-
atively to LGG (Booth et al., 2020). Several studies
454
Jlassi, A., ElBedoui, K. and Barhoumi, W.
Brain Tumor Segmentation of Lower-Grade Glioma Across MRI Images Using Hybrid Convolutional Neural Networks.
DOI: 10.5220/0011895900003393
In Proceedings of the 15th International Conference on Agents and Artificial Intelligence (ICAART 2023) - Volume 2, pages 454-465
ISBN: 978-989-758-623-1; ISSN: 2184-433X
Copyright
c
2023 by SCITEPRESS – Science and Technology Publications, Lda. Under CC license (CC BY-NC-ND 4.0)

suggest that LGG can be associated with different
genomic subtypes, which are significant factors in
determining the course of treatment. Based on the
recent literature, there is no noninvasive approach
identifying genomic subtypes. Does previous litera-
ture demonstrate a correlation between LGG shape
characteristics and subtypes(Buda et al., 2019). In
fact, it leads to conducting radiogenic analysis and
enhances inferences about these correlations.
In this work, we propose a fully automated seg-
mentation method that identify whether the assessed
shape features are prognostic of tumor molecular
subtypes or not. To do so, the proposed method is
based on an integrated deep learning architecture
combining SegNet and U-Net architectures. In fact,
to the best of our knowledge, none of the state-of-
the-art methods have tested the performance of the
well-known CNN architecture SegNet on delineating
LGGs. Most of the literature methods are based
on U-Net variants which have shown promising
performances. Thus, in order to take advantage of the
benefits of both U-Net and SegNet algorithms, we
have conducted a comparative study which allowed
us to propose an effective method that combines
both architectures in order to further enhance the
diagnosis accuracy. Literally, this work aims to
investigate the correlation between selected shape
features and genomic subtypes in order to provide the
information to clinicians sooner via a non-invasive
method. Further, in some cases, it could perform
better delineation of tumors where the resection is
not provided. Indeed, the obtained results show that
the proposed automated tool based on deep learning
could be helpful for the diagnosis and the treatment
planning of LGG.
The remainder of this paper is organized as fol-
lows. Section 2. describes the state of the art whereas
section 3. presents the proposed hybrid CNN ar-
chitectures for segmenting LGG from MRI images.
Then, in section 4. we show results for the segmen-
tation model. In section 5. we produce a conclusion
with some directions.
2 RELATED WORK
Various segmentation approaches have been devel-
oped to delineate LGG on MRI scans. The vast ma-
jority of these approaches are based on machine learn-
ing. For instance, generative and discriminative mod-
els have been widely used. On the one hand, Genera-
tive Models (GMs) have the capacity to handle small-
sized datasets. On the other hand, Discriminant Mod-
els (DMs) are more efficient when using ”wide data”.
However, GMs are generally less accurate than DMs.
2.1 Generative Models
GMs such as atlas-based models need prior knowl-
edge of anatomy and take on posterior probabilities
for voxels’ classification. For instance, Parisot et al.
have explored firstly prior knowledge in order to clas-
sify the tumor then they used another graph to identify
the class of each voxel (Parisot et al., 2012). How-
ever, Huang et al. have used the sparseness of sam-
ples to construct a particular dictionary and develop
a softmax model in order to optimize the error re-
construction coefficients for different classes (Huang
et al., 2014). Furthermore, the Random Forest (RF)
approach, notably in the cases of high number of fea-
tures, has succeeded to be good to accomplish accu-
rate brain tumor segmentation (Zikic et al., 2012). In
this context, Meier et al. have used a set of dedicated
features-based decision RF to discriminate patholog-
ical regions within brain MRI volumes (Meier et al.,
2015). Likewise, Meier et al. have investigated the
CRF method to improve the voxel-wise classification
accuracy on the summit of the RF classifier. Dif-
ferently, Markov Random Field (MRF) and Condi-
tional Random Field (CRF) are also frequently used
for brain tumor segmentation. For instance, Zhao
et al. have proposed a semi-segmentation approach
based on the MRF, in which one slice was labeled
and the other slices were sequentially labeled using
the MRF label (Zhao et al., 2013). Nevertheless, GMs
usually focus on the distribution of a dataset in order
to return a probability for a given example.
2.2 Discriminative Models
DMs, such as the Support Vector Machine (SVM),
do not require prior knowledge of anatomy and
use imaging features extracted from MRI instead
of the original MRI data for the classification task.
Thus, dimensionality reduction or imaging feature
selection is mostly developed before the model
training task. Deep Learning (DL) based on CNN is
a promising approach that is different from classical
DMs since it is based on end-to-end classifiers. In
fact, unlike classical DM, imaging feature extraction
and selection is automated during model training, and
this approach has shown relevant results in automatic
tumor segmentation. Furthermore, in recent years,
CNN models have shown promising performances
in medical image processing, not only in terms of
accuracy but also in terms of efficiency. Pereira
Brain Tumor Segmentation of Lower-Grade Glioma Across MRI Images Using Hybrid Convolutional Neural Networks
455

et al. have developed two different structures with
dissimilar depths to deal with the LGG (Thaha et al.,
2019). Similarly, Dvorak et al. have evaluated the
effectiveness of different patch selection techniques
based on the segmentation results of CNNs (Zhang
et al., 2020). Havaei et al. have proposed a multiscale
CNN structure in order to enhance the use of local
and global information (Havaei et al., 2015a). A
combination of RF with the final output of CNNs is
used to make better classification results. Zhao et al.
have introduced a method that combines FCNN and
CRF (Havaei et al., 2015b). The main advantage of
this method is that it treats the subproblem of unbal-
anced data. Overall, the patches are often randomly
extracted with controlling their number per class.
However, the size or quality of the patches can affect
easily the LGG segmentation. For example, a patch
of a small size cannot have all the spatial information
whereas a patch of considerable size will need more
computational resources. To address these problems,
recent studies used CNN-based encoder-decoder
networks. For instance, Buda et al. have recently
proposed a fully automatic way to quantify LGG
characteristics using U-Net architecture and test
whether these characteristics are predictive of tumor
genomic subtypes (Buda et al., 2019). Due to the
excellent performance of U-Net, other segmentation
networks based on the U structure of U-Net are
produced such as UNet++. Xu et al. have proposed
an LGG segmentation tool based on the UNet++
model (Xu et al., 2020) which uses nested dense
skip connections to reduce the semantic gap between
encoder and decoder caused by the U-Net model.
Moreover, Naser et al. have combined CNN based
on the U-Net for LGG segmentation and transfer
learning based on a pre-trained convolution-base of
Vgg16 and a fully connected classifier (Naser and
Deen, 2020). The latter U-Net architecture uses
skip connections to the corresponding layers in the
decoding part. Thus, it leads to a shortcut for gradient
flow in shallow layers during the training task.
More recently, two models, which are U-Net with
a ResNeXt-50, have been investigated in (Paradkar
and Paradkar, 2022). This work includes analyzing
LGGs through deep learning-based segmentation,
shape feature extraction, and statistical analysis to
identify correlations between selected shape features
and genomic subtypes.
As best as we know, no CNN architecture based
on SegNet is used for LGG segmentation. The most
used one is the U-Net model which requires higher
computational time compared to SegNet. However,
the skip connection saddles the set of captured fea-
tures to the corresponding upsampling convolution
blocks in the SegNet decoder module. This paper fo-
cuses on the hybridization of the CNN architecture,
the hybrid U-SegNet. The idea comes after a com-
parative study between U-Net and SegNet models.
Thus, the proposed architecture is a U-shape model
with properties mimicked from the SegNet.
3 MATERIALS AND METHODS
In this section, we firstly present the dataset that we
investigated in this work. Then, the proposed method
for the LGG segmentation is described comparatively
to used SegNet and U-Net and evaluated within the
used dataset.
3.1 Materials
The dataset used in this study contains brain MR im-
ages together with manual FLAIR abnormality seg-
mentation masks. The images were obtained from
The Cancer Imaging Archive (TCIA). In fact, these
scans correspond to 110 patients included in The Can-
cer Genome Atlas (TCGA) LGG collection with fully
FLAIR sequence and genomic cluster data available.
The collection of patients comes from five different
institutions (Thomas Jefferson University – 16 pa-
tients; Henry Ford Hospital – 45 patients; UNC – 1
patient; Case Western – 14 patients; and Case West-
ern St. Joseph’s – 34 patients). The patients are
distributed as 50 patients with Grade II, and 58 pa-
tients with Grade III. Figure 1 summarises the char-
acteristics of the patient’s data such as tumor grades,
tumor sub-types, genders, and ages. Each MRI per
patient contains from 20 to 88 slices with the size
of 256 pixels and shows cross-sectional areas of the
brain as shown in Figure 2. Tumor shape assessment
was based only on the FLAIR abnormality since tu-
mor enhancement in LGG is infrequent. The Ground
Truth (GT) generated by tumor masks was performed
by Buda et al. (Buda et al., 2019) using the FLAIR
MRI images and they made it publicly available for
download from (https://www.kaggle.com/).
3.2 Methods
An overview of the proposed approach used for LGG
segmentation is shown in Figure 3. In fact, the pro-
posed fully automatic method of LGG segmentation
based on a hybrid CNN is composed of three main
procedures: image preprocessing, data augmentation,
and segmentation.
ICAART 2023 - 15th International Conference on Agents and Artificial Intelligence
456
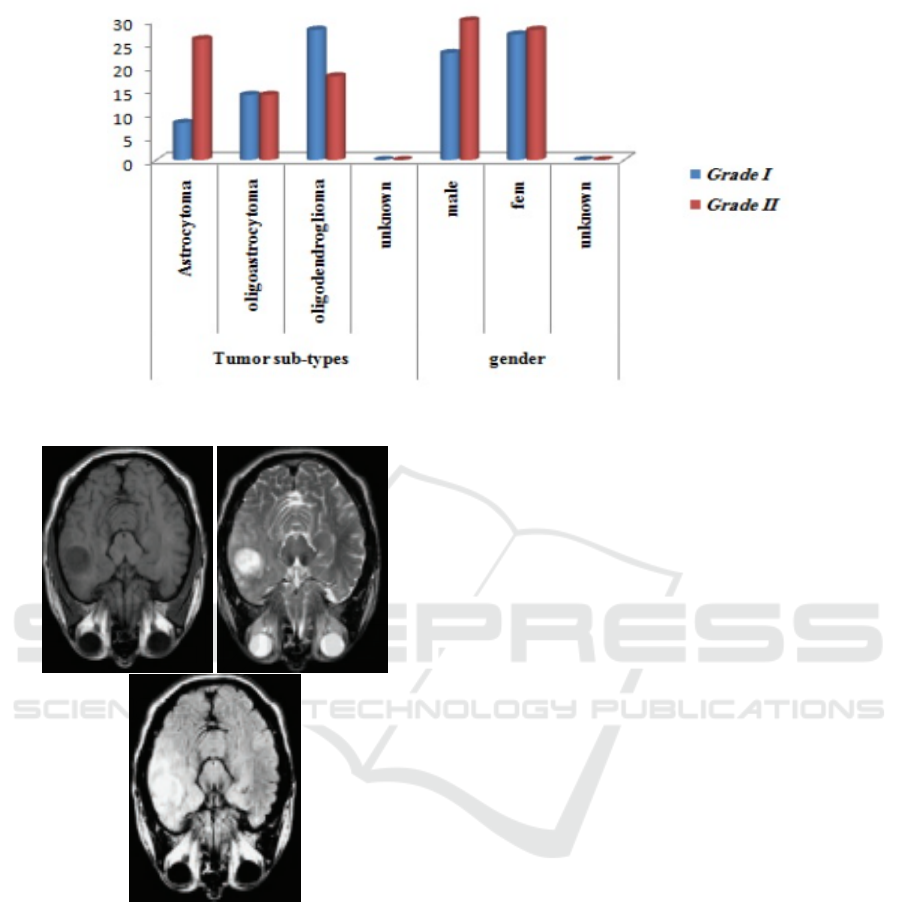
Figure 1: The patients’ data includes tumor grades, tumor sub-types, genders, and ages.
Figure 2: A sample of MRI scans from he TCGA dataset:
(a) T1 modality, (b) T2 modality, and (c) FLAIR modality).
3.2.1 Preprocessing
The Skull Stripping (SS) process is used in order to
extract brain tissue from the non-brain tissue. The
output of the SS is a new image with only a brain pixel
(without non-brain tissue) as presented in Figure 4 or
a binary value assigning value 1 for brain pixels and
value 0 for the rest of the tissue. More precisely, the
preprocessing of the MRI sequences consists of the
following steps:
1. Scaling images to the joint frame of reference.
2. Stripping of the skull to concentrate the analysis
of the brain region.
3. Normalizing the tissue intensity.
3.2.2 Data Augmentation
The number of images containing tumors was signifi-
cantly lower than the number of those with only back-
ground class present. To deal with this issue, data
augmentation seems to be as a good solution. How-
ever, in our context, we cannot apply all transforma-
tions because the segmentation results could consid-
erably change. Consequently, we opted to work on
three possible transformations in order to not degrade
the training performance (Buda et al., 2018). Indeed,
for each oversampled slice, we applied random rota-
tion, flip and for the other slice, we applied random
scale, as shown in Figure 5. Finally, in order to reduce
the unbalance between tumor and non-tumor classes,
we isolated empty slices that did not contain any brain
or other tissue after applying the Skull Stripping pro-
cess.
3.2.3 Segmentation
Recently, deep neural networks are payoff popularity
among researchers and have shown outstanding per-
formance with appreciated accuracy in medical im-
age segmentation. CNN is a type of deep neural net-
work, which can learn and extract features from im-
ages. In fact, many researchers have used CNN for
automatic brain tumor segmentation in MRI images,
especially for LGG segmentation. The objective of
this paper is to generally explore the CNN architec-
tures for brain tumor segmentation and specifically
those of SegNets and U-Net. So, it is important to
find the relevant advantages of each model in order
Brain Tumor Segmentation of Lower-Grade Glioma Across MRI Images Using Hybrid Convolutional Neural Networks
457
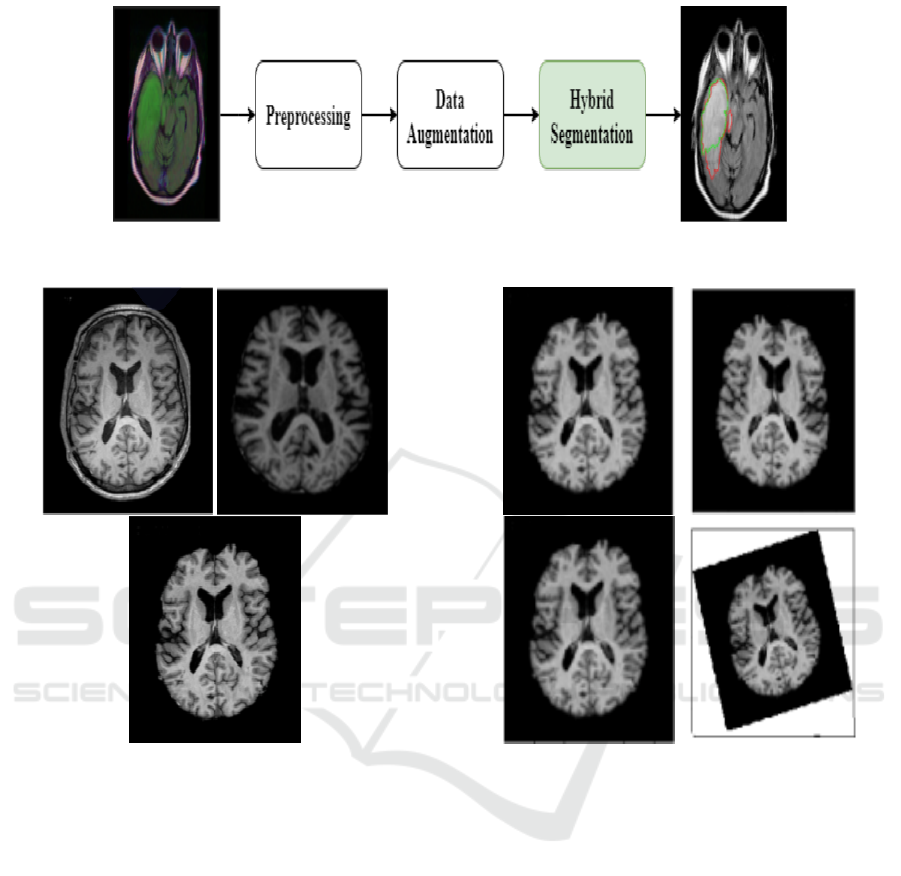
Figure 3: An overview of the proposed hybrid CNN.
Figure 4: Preprocessing Example: (a) Original MRI, (b)
Skull Stripped MRI, and (c) Preprocessed MRI.
to develop a hybrid architecture by inheriting the ad-
vantages of these models. It is noticeably expected
that the hybrid architecture will give a more devoted
result. Particularly, U-Net has achieved good results
in medical image segmentation. Hence, it is the most
commonly used in the LGG segmentation task. It has
performed outstanding results in this challenge and
it has overcome the problems of fewer data capac-
ity, fuzzy boundaries, and high gray scales in med-
ical image analysis. In fact, the U-Net method in-
cludes an encoder for processing input MRI images
and a decoder for generating outputs (Drozdzal et al.,
2016). Firstly, the encoder decomposes the image
into different levels of feature maps. Then, it extracts
the coarse-grained features of the main feature maps.
Next, the decoder restores the feature maps of each
layer by an up-sampling process. The concatenation
cascades the features of each layer of the encoder with
Figure 5: Example of corresponding data augmentation re-
sults. (a) Original MRI. (b) Flip. (c) Scale by 4% –8%. (d)
rotation by 5°–15°.
the features obtained by the transpose convolution op-
eration in the decoder. Thus, it reduces the loss of
accuracy in the feature extraction process. Regarding
the SegNet, it can be classified based on the number
of convolution blocks (Li et al., 2021). The SegNet
basically, has two convolutional layers with 3 × 3 fil-
ters. In each convolution block, the feature extraction
and the convolution operation are performed from the
input by sliding the filter kernel. Moreover, batch nor-
malization layers are developed after each convolu-
tional layer in order to normalize the channels of the
extracted features. Moreover, ReLU layers are used
in order to convert the negative value to zero with-
out changing its dimensions. It seems that U-Net is
able to capture fine and soar pieces of information
from the encoder to the decoder using skip linking,
but it requires a higher computational time compared
to SegNet. Since none of the state-of-the-art works
ICAART 2023 - 15th International Conference on Agents and Artificial Intelligence
458

have tested the performance of the well-known CNN
architecture SegNet on delineating LGGs. A compar-
ative study is established between the U-Net used by
Buda et.al (Buda et al., 2019) and the SegNet. The
latter is composed of an encoder network and a corre-
sponding decoder network, followed by a final classi-
fication layer in pixels. This architecture is illustrated
in Figure 6. In our case, the encoder network con-
sists of 10 layers followed by encoders, of the same
number of blocks set-top boxes.
In order to keep the higher-resolution feature maps
at the deepest encoder output, fully connected layers
were removed. The final decoder output is fed to a
Sigmoid classifier to produce class probabilities for
each pixel independently. For our dataset, the SegNet
architecture is trained with various parameters and
then we chose the relevant ones that gave a promis-
ing result for our task. The developed SegNet has the
following encoder layers:
• Input: MRI scans.
• Conv-1: The convolutional layer consists of 16
3times3 filters applied with a stride of 1 and a
padding of 1.
• Conv-2: The convolutional layer consists of 16
filters of size 3times3 applied with a stride of 1
and padding of 1.
• MaxPool-1: The next maxpool layer of Conv-2
consists of a size pool of 2times2 and a stride of
2.
• Conv-3: The convolutional layer consists of 32
filters of size 3times3 applied with a stride of 1
and padding of 1.
• Conv-4: The convolutional layer consists of 32
filters of size 3times3 applied with a stride of 1
and padding of 1.
• MaxPool-2: The next maxpool layer Conv-4 con-
sists of a size pool of 2times2 and a stride of 2.
• Conv-5: The convolutional layer consists of 64
filters of size 3times3 applied with a stride of 1
and a padding of 1.
• Conv-6: The convolutional layer consists of 64
filters of size 3times3 applied with a stride of 1
and a padding of 1.
• MaxPool-3: The next maxpool layer of Conv-6
consists of a size pool of 2times2 and a stride of
2.
• Conv-7: The convolutional layer consists of 128
filters of size 3times3 applied with a stride of 1
and a padding of 1.
• Conv-8: The convolutional layer consists of 128
filters of size 3times3 applied with a stride of 1
and padding of 1.
• MaxPool-4: The next maxpool layer of Conv-8
consists of a size pool of 2times2 and a stride of
2.
• Conv-9: The convolutional layer consists of 256
filters of size 3times3 applied with a stride of 1
and a padding of 1.
• Conv-10: The convolutional layer consists of 256
filters of size 3times3 applied with a stride of 1
and a padding of 1.
• MaxPool-5: The next max pool layer of Conv-10
consists of a size pool of 2times2 and a stride of
2.
Furthermore, the hyperparameters adopted for the
training process of this model are as follows: learning
Rate (LR) equals to 0.0001, number of epochs equals
to 100, lot size equals to 16, and Adam as optimiza-
tion algorithm.
As mentioned above, the objective of this work
is to combine the popular deep CNN models which
are U-Net and SegNet for the automatic segmentation
of tumors in the brain MRI images, by exploring the
advantages of each model. The proposed U-SegNet is
a hybridization of U-Net architecture which is widely
used for LGG segmentation and SegNet architecture.
Figure 7 shows the U-SegNet architecture which is an
assembly model that combines the U-Net and SegNet
architectures.
Similarly to U-Net, the U-SegNet architecture is a
U-shaped model with image features trained at difer-
ent levels through a set of convolution and pooling
layers. The decoder layer uses the pooling indices
from the max-pooling step corresponding to the en-
coder layer’s role to oversample the low-level feature
maps instead of the deconvolution layers. We used the
same parameters of SegNet to implement U-SegNet.
Additionally, we used 10 encoder blocks and 10 de-
coder blocks. Batch normalization and ReLu activa-
tion functions were applied on the feature maps after
the filters were applied in the encoder branch. A U-
Net type hop connection is only provided at the upper
layer, as shown in Figure 7, in order to insert feature
maps with fine detail. The jump connection helps us
to introduce fine information without increasing the
parameters as it was done in U-Net. Finally, a Sig-
moid layer is used in order to produce class probabil-
ities for each pixel independently. The hyperparam-
eters adopted for the training process of this model
are as follows: learning rate equals to 0.0001, number
of epochs equals to 100, a lot size of 16, Stall (Mo-
mentum) equals to 0.5, and Adam as an optimization
Brain Tumor Segmentation of Lower-Grade Glioma Across MRI Images Using Hybrid Convolutional Neural Networks
459
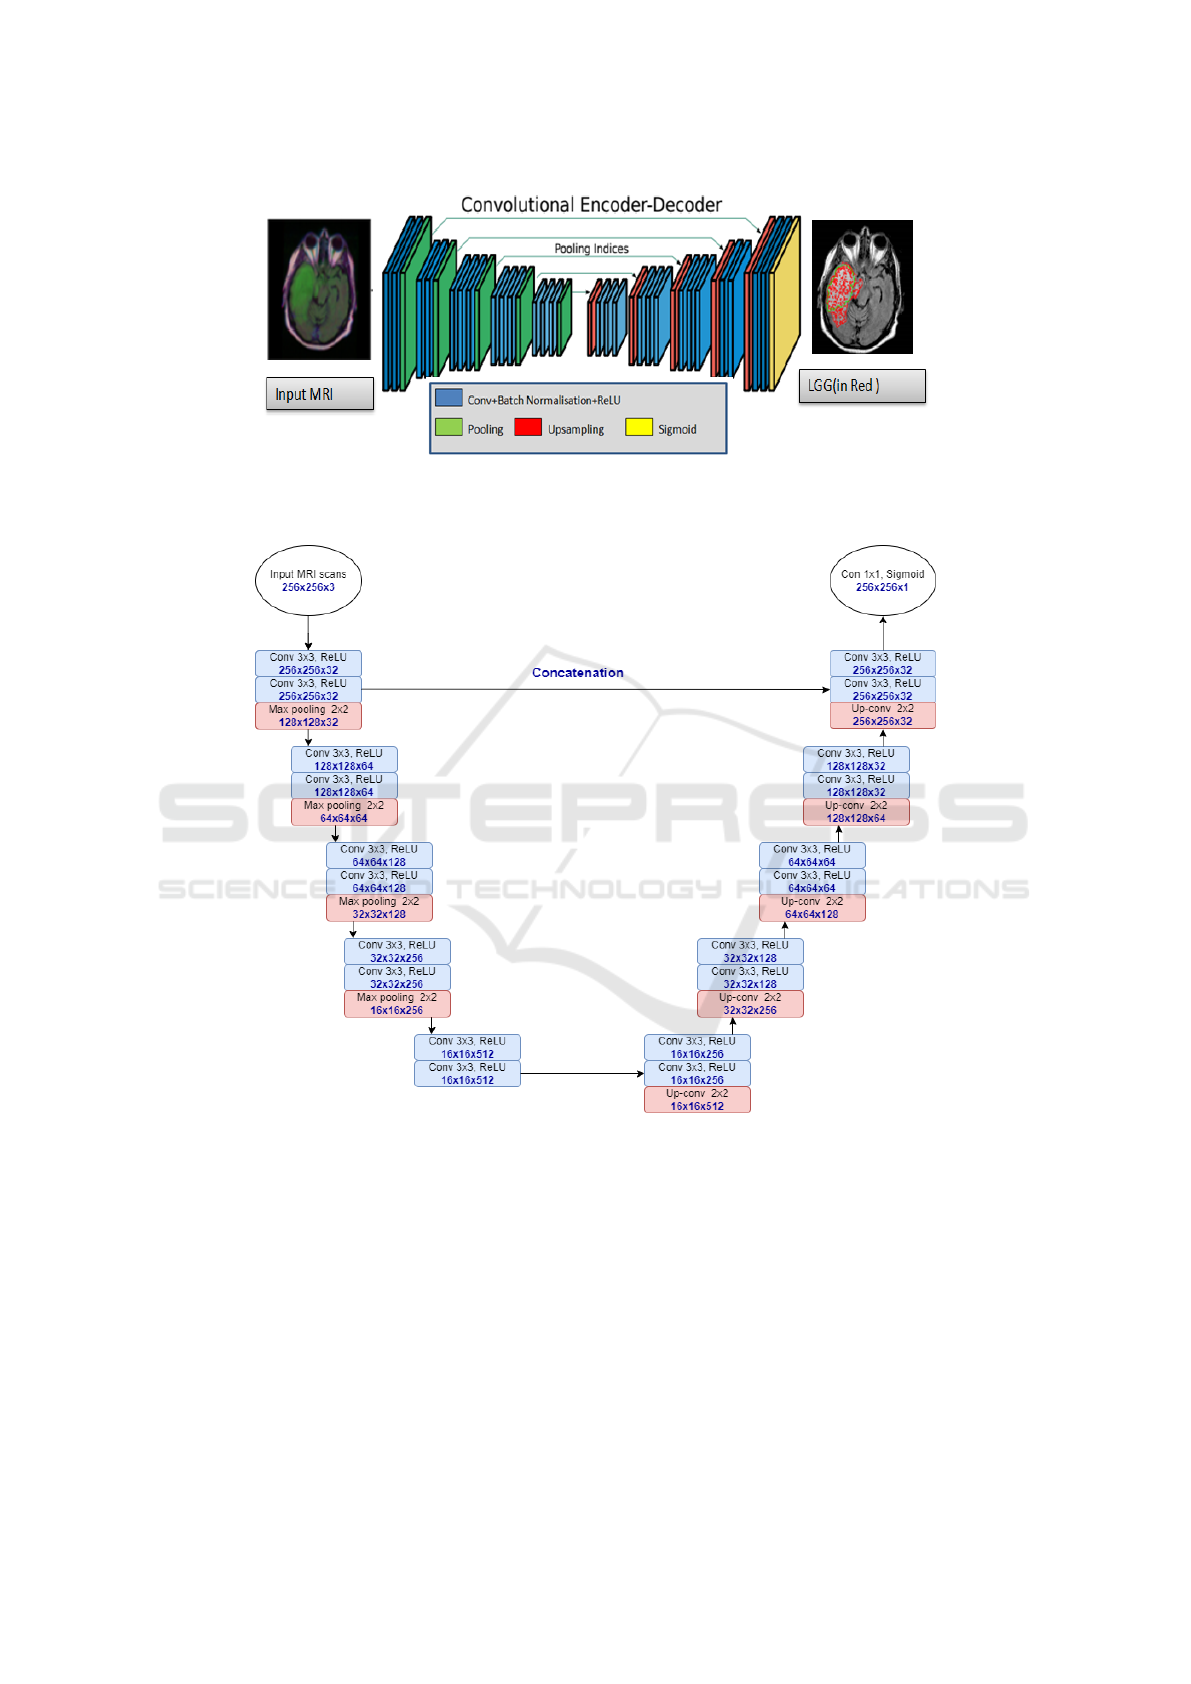
Figure 6: An illustration of the SegNet architecture generated while highlighting the LGG region (in Red). There are no Fully
Connected (FC) layers and only convolutional layers are used.
Figure 7: U-SegNet architecture used for segmentation. Below each layer specification dimensionality of a single example
that this layer outputs were provided.
algorithm.
The segmentation model used in this work was
based on CNN with the hybrid architecture. In order
to improve the learning performance, we have imple-
mented the U-SegNet architecture. This architecture
is a new model based on the SegNet model with a
connection hop to the upper layer to retrieve the finer
details of the feature map. Moreover, we have intro-
duced dropout in the encoder layer which is a regula-
tion technique in order to avoid overfitting (increase
validation accuracy). We have chosen what gives the
model a better opportunity to learn independent rep-
resentations. Typically, using a small dropout value
of 20-50% of neurons is sufficient, with 20% being
a good starting point. Too low a value has minimal
effect and too high a value leads to under-training of
the network. As shown in Figure 7, the U-SegNet
consists of 5 blocks of layers which contain 2 con-
volution layers (in blue color) with ReLU activation
function and one max pooling layer (in pink color)
in the encoding (down-sampling) part and a similar 5
blocks of layers but with one convolution transpose
ICAART 2023 - 15th International Conference on Agents and Artificial Intelligence
460

layer (in pink color) instead of max pooling in the
decoding (up-sampling) part. The number of filter
channels and the image size are given at the bottom of
each layer. The size of the input layer (in white color)
is 256 × 256 × 3 and the size of the output layer is
256 × 256 × 1 which is a convolution layer with Sig-
moid activation function.
4 EXPERIMENTAL RESULTS
In order to evaluate the performance of the proposed
method, various experiments have been performed on
a challenging MRI dataset. We have used the follow-
ing libraries for the implementation: OpenCV, Pillow,
NumPy, Matplotlib, and Tensorbord for visualization.
The operating system used was Ubuntu 18.04 on a
computer with 5 cores and with an Nvidia GeForce
GTX 960M graphics processor equipped of 9 GB of
RAM. This section includes qualitative and quantita-
tive assessment of the proposed method, while com-
prehensively assesses each module of the method.
4.1 Qualitative Evaluation
To illustrate the performance of the segmentation
model, overlays of FLAIR MRI images with the out-
lines of tumor masks using manual and model seg-
mentations for the test datasets are shown in Figure
8. Each panel, in Figure 8, is showing the highlighted
tumor in red, while the overlay image with tumor out-
lines (green – manual segmentation and red – model
segmentation). Overall, the visualization of the re-
sults allowed us to see that U-Net and SegNet make
complementary errors. Representative examples of
automatic segmentation results obtained using Seg-
Net architecture with best and worst scores are shown
in Figure 9 and Figure 10, respectively. The results re-
flect the anomalous detection of regions, while noise
and random speckles (red dots) indicate that SegNet
tends to miss finer details. It is clear that the proposed
model lacks precision, although it considers very deep
with 10 encoder layers. However, the proposed model
has succeeded in detecting the glioma region even in
the worst case, but it lacks precision. This leads us
to think that it lacks regularization to fit the proposed
problem. This will be discussed in the next part. In
fact, while visualizing the results, we have observed
that the proposed U-SegNet architecture captures fine
details and solves the random noise problem seen in
SegNet as illustrated in Figure 11 and Figure 12. It
is obvious that adding skip connections to the upper
layers helps to improve performance.
Consequently, SegNet tends to miss the finer de-
tails and in some cases suffers from random noise. On
the other hand, U-Net, thanks to jump connections, is
able to capture fine details; i.e. borders; more accu-
rately than SegNet. However, as shown in the same
figure (Figure 8), U-Net makes some errors in the de-
tection of tumors. We suspect this is due to confu-
sion created by deconvolutional layers and skipped
connections at lower levels. Moreover, compared to
U-Net, U-SegNet has fewer parameters than U-Net
allowing our network to train better. This solves the
accuracy problem. Although SegNet tends not to have
access to finer details, the proposed model is able to
capture these finer details by integrating the single
hop connection into the U-SegNet architecture.
4.2 Quantitative Evaluation
To compare the quantitative performances of the dif-
ferent models, we have evaluated the performance of
these segmentations through the Dice similarity (DC)
coefficient. It is among the most widely used met-
rics for brain tumor and structure segmentation appli-
cations. The Dice coefficient (1) was used to evalu-
ate the similarity of the predicted tumor masks by the
segmentation model with the tumor masks obtained
by manual segmentation (GT).
DC =
2 × T P
2 × T P + FN + FP,
(1)
where, TP, FP, and FN represent respectively the
True Positive, False Positive, and False Negative of
the class for which the result is calculated.
Table 1 shows the training time, best Dice coef-
ficient, mean Dice coefficient, and median Dice co-
efficient of each model per 100 epochs. As shown
in Table 1, SegNet performs faster than other models
since SegNet uses only max-pooling indices to over-
sample low-level features. It is obvious that adding
skip connections to the upper layers helps to improve
the performance. Thus, U-SegNet gave an average
Dice value of 83% and a median Dice coefficient
of 86%. Network training required 8 GB of mem-
ory while the total training time was approximately
5 hours and 58 minutes. In Figure 13, we present
the loss and Dice convergence results of the valida-
tion dataset for each of these models. Both U-Net and
U-SegNet models seem to be doing quite well. How-
ever, according to the same Figure 13, the predictions
vary for complex images with extremely diversified
sub-regions. In addition, it is clear that U-SegNet is
good at predicting regions in images that are very dif-
ficult and complex. Interestingly, U-SegNet incorpo-
rates the good features of both U-Net and SegNet ar-
chitectures. Compared to U-Net, U-SegNet has fewer
Brain Tumor Segmentation of Lower-Grade Glioma Across MRI Images Using Hybrid Convolutional Neural Networks
461
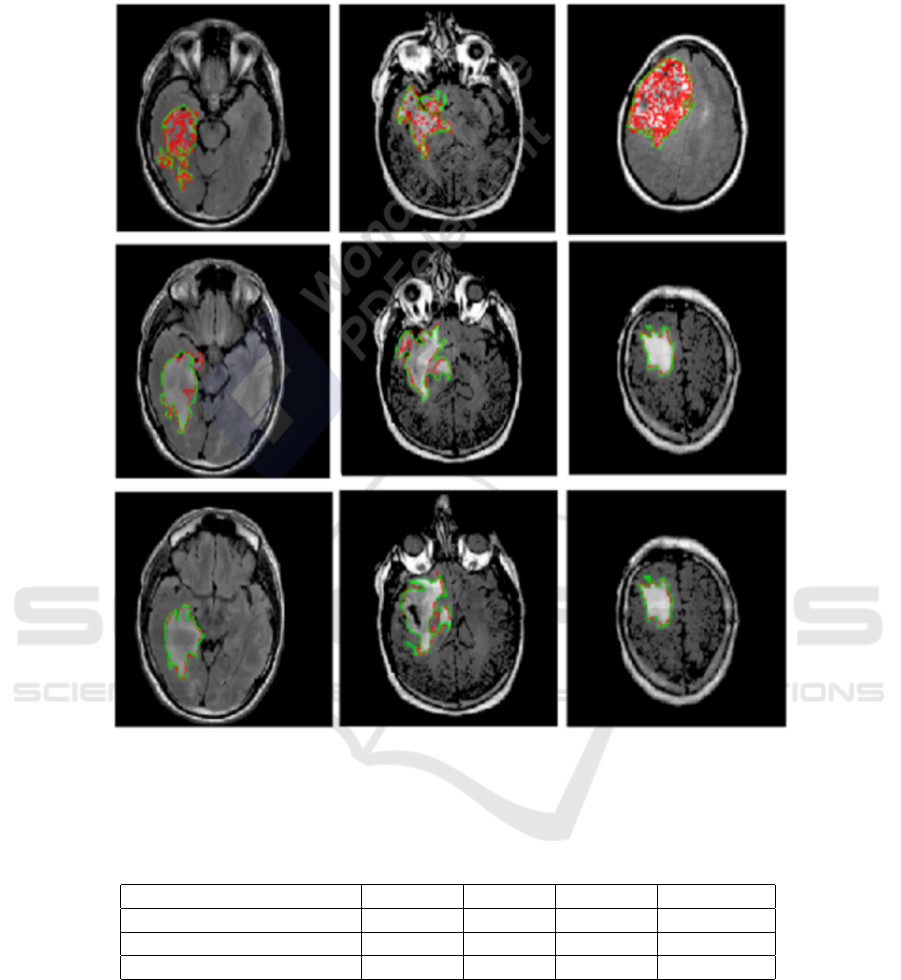
Figure 8: Samples from the test data sets showing FLAIR images for highlighted LGG regions and overlays of FLAIR images
and tumor masks’ (GT) (green – manual segmentation and red – model segmentation). First line: segmented LGG using
U-Net architecture. Second line: segmented LGG using SegNet. Third line: segmented LGG using proposed U-SegNet.
Table 1: Evaluation of the proposed architecture comparatively to the U-Net and the SegNet architectures (best values are in
bold).
Models Time Best DC Mean DC Median DC
U-Net [(Buda et al., 2019)] 8 :02 :35 90 % 82% 85 %
SegNet 4 :40 :50 84 % 76 % 78 %
U-SegNet 5 :57 :42 91,3 % 83% 85,7 %
parameters than U-Net which allows it to be trained
better. This solves the accuracy problem. Although
SegNet does not tend to have access to finer details,
the proposed model is able to capture these finer de-
tails by integrating the single hop connection into the
U-SegNet architecture.
5 CONCLUSION
In this work, we have investigated three relevant mod-
els, namely U-Net, SegNet, and U-SegNet designed
for reliable automatic LGG segmentation from MRI
images. The proposed hybrid model inherits the prop-
erties of U-Net and SegNet, which are the most pop-
ular CNN models for medical image segmentation.
In the case of LGG tumors, small sizes are lost dur-
ing subsampling, resulting in inappropriate segmenta-
ICAART 2023 - 15th International Conference on Agents and Artificial Intelligence
462
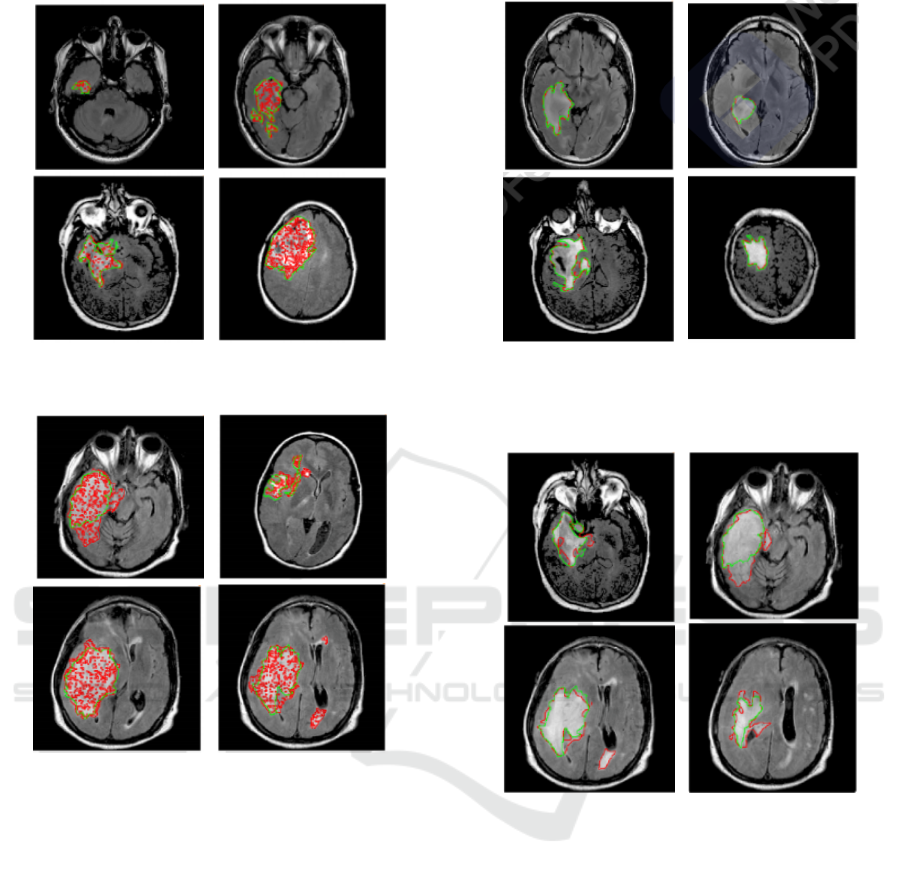
Figure 9: Example of segmentation results by SegNet with
Ground Truth (in Green) for the best cases.
Figure 10: Example of segmentation results by SegNet
overlays of FLAIR images and tumor masks’ (GT) (green
– manual segmentation and red – model segmentation) for
the worst cases.
tion. The hybrid model can overcome such a problem
by adding a hop connection to the upper layer of the
SegNet, in order to retrieve the finer details from the
feature map. All CNN models (U-net, SegNet, and
U-SegNet) have been trained and validated using the
challenging TCGA dataset. The performance of the
proposed hybrid model in terms of average Dice co-
effcient was 83%, a value that exceeds that of each
model apart. This was achieved through deep learn-
ing architecture that coupled the advantages of U-
Net with those of the SegNet. This study may be
the first step in order to associate the imaging fea-
tures of LGG and molecular tumor subtypes estab-
lished by genomic analysis. The proposed model
shows promise as a non-invasive tool for tumor char-
acterization in LGG. Furthermore, there are several
Figure 11: Example of segmentation results by U-SegNet
overlays of FLAIR images and tumor masks’ (GT) (green
– manual segmentation and red – model segmentation) for
the best cases.
Figure 12: Example of segmentation results by U-SegNet
overlays of FLAIR images and tumor masks’ (GT) (green
– manual segmentation and red – model segmentation) for
the worst cases.
techniques for developing automatic segmentation of
brain tumors that could be inspected for comparison
and to further enhance the obtained results (Akkus
et al., 2017). The LGG data used for validation is
comparatively small and there were not more datasets
available for testing. However, in order to general-
ize proposed models, additional datasets should be
used for more accurate evaluation. Nevertheless as
a next step, we will analyze the relationship between
the imaging features and genomic clusters.
Brain Tumor Segmentation of Lower-Grade Glioma Across MRI Images Using Hybrid Convolutional Neural Networks
463
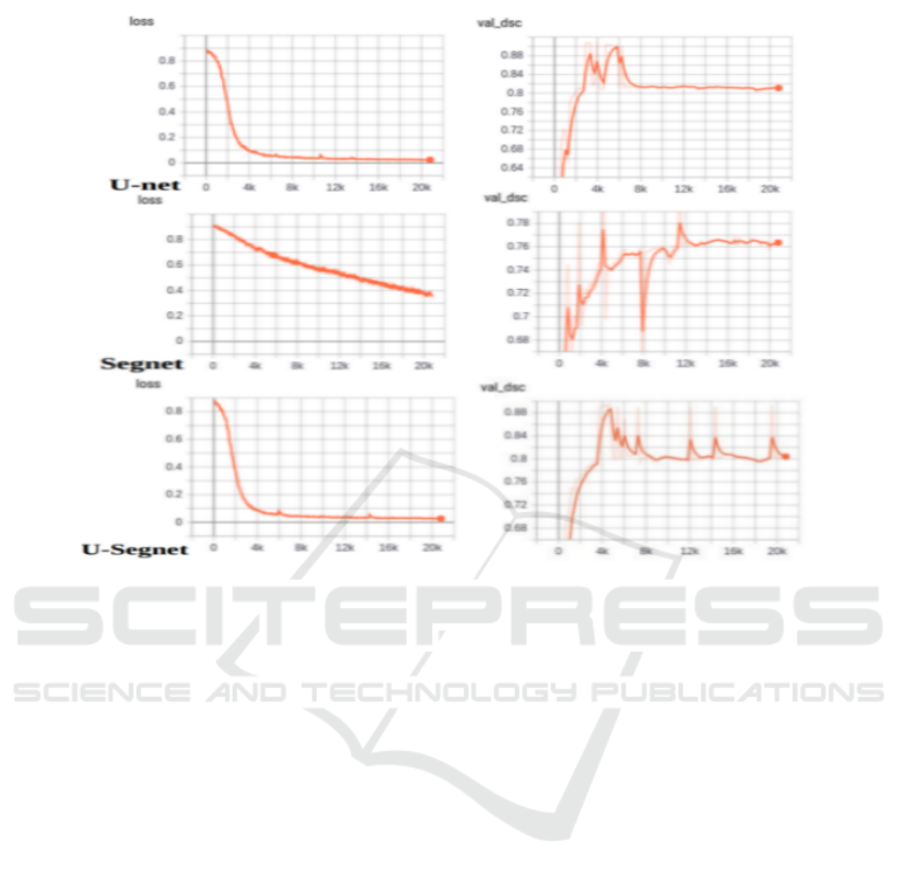
Figure 13: Evaluation of loss and DSC convergence of selected automatic LGG segmentation methods: U-Net, SegNet, and
U-SegNet.
REFERENCES
Akkus, Z., Galimzianova, A., Hoogi, A., Rubin, D. L., and
Erickson, B. J. (2017). Deep learning for brain mri
segmentation: state of the art and future directions.
Journal of digital imaging, 30(4):449–459.
Booth, T. C., Williams, M., Luis, A., Cardoso, J., Ashkan,
K., and Shuaib, H. (2020). Machine learning and
glioma imaging biomarkers. Clinical radiology,
75(1):20–32.
Buda, M., Maki, A., and Mazurowski, M. A. (2018).
A systematic study of the class imbalance problem
in convolutional neural networks. Neural networks,
106:249–259.
Buda, M., Saha, A., and Mazurowski, M. A. (2019). Asso-
ciation of genomic subtypes of lower-grade gliomas
with shape features automatically extracted by a
deep learning algorithm. Computers in biology and
medicine, 109:218–225.
Drozdzal, M., Vorontsov, E., Chartrand, G., Kadoury, S.,
and Pal, C. (2016). The importance of skip connec-
tions in biomedical image segmentation. In Deep
learning and data labeling for medical applications,
pages 179–187. Springer.
Havaei, M., Dutil, F., Pal, C., Larochelle, H., and Jodoin, P.-
M. (2015a). A convolutional neural network approach
to brain tumor segmentation. In BrainLes 2015, pages
195–208. Springer.
Havaei, M., Dutil, F., Pal, C., Larochelle, H., and Jodoin, P.-
M. (2015b). A convolutional neural network approach
to brain tumor segmentation. In BrainLes 2015, pages
195–208. Springer.
Huang, M., Yang, W., Wu, Y., Jiang, J., Chen, W.,
and Feng, Q. (2014). Brain tumor segmentation
based on local independent projection-based classifi-
cation. IEEE transactions on biomedical engineering,
61(10):2633–2645.
Li, G., Liu, Q., Ren, W., Qiao, W., Ma, B., and Wan, J.
(2021). Automatic recognition and analysis system
of asphalt pavement cracks using interleaved low-rank
group convolution hybrid deep network and segnet
fusing dense condition random field. Measurement,
170:108693.
Louis, D. N., Perry, A., Reifenberger, G., Von Deimling,
A., Figarella-Branger, D., Cavenee, W. K., Ohgaki,
H., Wiestler, O. D., Kleihues, P., and Ellison, D. W.
(2016). The 2016 world health organization classifi-
cation of tumors of the central nervous system: a sum-
mary. Acta neuropathologica, 131(6):803–820.
Mazurowski, M. A. (2015). Radiogenomics: what it is and
why it is important. Journal of the American College
of Radiology, 12(8):862–866.
Meier, R., Karamitsou, V., Habegger, S., Wiest, R., and
Reyes, M. (2015). Parameter learning for crf-based
tissue segmentation of brain tumors. In BrainLes
2015, pages 156–167. Springer.
ICAART 2023 - 15th International Conference on Agents and Artificial Intelligence
464

Naser, M. A. and Deen, M. J. (2020). Brain tumor seg-
mentation and grading of lower-grade glioma using
deep learning in mri images. Computers in biology
and medicine, 121:103758.
Network, C. G. A. R. (2015). Comprehensive, integrative
genomic analysis of diffuse lower-grade gliomas. New
England Journal of Medicine, 372(26):2481–2498.
Paradkar, R. and Paradkar, R. (2022). Analysis of lower-
grade gliomas in mri through segmentation and ge-
nomic cluster-shape feature correlation. bioRxiv.
Parisot, S., Duffau, H., Chemouny, S., and Paragios, N.
(2012). Graph-based detection, segmentation & char-
acterization of brain tumors. In 2012 IEEE Confer-
ence on Computer Vision and Pattern Recognition,
pages 988–995. IEEE.
Thaha, M. M., Kumar, K., Murugan, B., Dhanasekeran, S.,
Vijayakarthick, P., and Selvi, A. S. (2019). Brain
tumor segmentation using convolutional neural net-
works in mri images. Journal of medical systems,
43(9):1–10.
Xu, D., Zhou, X., Niu, X., and Wang, J. (2020). Automatic
segmentation of low-grade glioma in mri image based
on unet++ model. In Journal of Physics: Conference
Series, volume 1693, page 012135. IOP Publishing.
Zhang, D., Huang, G., Zhang, Q., Han, J., Han, J., Wang, Y.,
and Yu, Y. (2020). Exploring task structure for brain
tumor segmentation from multi-modality mr images.
IEEE Transactions on Image Processing, 29:9032–
9043.
Zhao, L., Wu, W., and Corso, J. J. (2013). Semi-automatic
brain tumor segmentation by constrained mrfs using
structural trajectories. In International Conference on
Medical Image Computing and Computer-Assisted In-
tervention, pages 567–575. Springer.
Zikic, D., Glocker, B., Konukoglu, E., Criminisi, A., Demi-
ralp, C., Shotton, J., Thomas, O. M., Das, T., Jena,
R., and Price, S. J. (2012). Decision forests for tissue-
specific segmentation of high-grade gliomas in multi-
channel mr. In International Conference on Medi-
cal Image Computing and Computer-Assisted Inter-
vention, pages 369–376. Springer.
Brain Tumor Segmentation of Lower-Grade Glioma Across MRI Images Using Hybrid Convolutional Neural Networks
465
