
A Knowledge-Based Approach for Evaluating Impact of Therapeutic
Strategies
Nadia Abchiche-Mimouni
1 a
, Mike Donald Tapi Nzali
2 b
and Franc¸ois Gueyffier
3 c
1
Laboratoire IBISC, Univ. Evry, Universit
´
e Paris-Saclay, France
2
LIRMM, Department of Computer Science, Montpellier University, Montpellier, France
3
LBBE, Universit
´
e Claude Bernard Lyon 1, France
fi
Keywords:
Rule-Base Systems, Simulation in Healthcare.
Abstract:
This paper proposes an original approach for modelling medical expertise and simulating medical strategies. A
knowledge-based system is used to model therapeutic strategies according to three axes: diagnostic, prescrip-
tion and treatment effect. The diagnostic axis describes the ways of deciding whether an individual is eligible
for treatment or not. The prescription axis models the ways of choosing an adequate drug for an individual
or changing the current treatment if it is judged ineffective. Treatment effect concerns the effect of a drug at
the individual level. This modelling is used for exploring different therapeutic strategies and quantifying their
impact on the individual and population levels. We have developed a platform, based on a rule-based system,
that was validated with a Use-case in Hypertension management. Classical and Alternative strategies have
been simulated with the same Realistic virtual population. 20.000 individuals were considered and several
parameters (e.g. optimal drug prescription, evolution of the cardiovascular risk) were calculated. The experi-
ments showed the viability and relevance of the approach. Its strengths are numerous. Since the rules are the
input of the system, they can be introduced and modified by non-programmers people, allowing prescribers to
fully test their own rules. The platform is configurable in terms of modelled expertise and in terms of outputs
to be measured. Empirical results concerning the superiority of the Alternative strategies have been produced.
1 INTRODUCTION
Evidence-Based Medicine (EBM) is described as “the
conscientious, explicit, and judicious use of current
best evidence in making decisions about the care
of individual patients” (Sackett et al., 1996). From
the perspective of public health workers and policy-
makers (Sheridan and Julian, 2016), it is more about
having evidence or data on the impact of diagnosis
and treatment at the population level. In this case,
the impact of the cost factor is decisive. Clinicians
need to access to different kinds of knowldege to take
the decision which is the most adequate according
to the patient’s state of health, environment and
comorbidities. The patient’s individual preferences
are also very important in order to ensure adherence
to treatment.
a
https://orcid.org/0000-0001-6149-3345
b
https://orcid.org/0000-0002-6245-5516
c
https://orcid.org/0000-0002-9921-0977
This paper addresses an important challenge that
EBM raised, that is providing means and/or tools for
evidence-based decision making. Tools for public
health workers and policy makers are particularly
targeted. This allows physicians or policy-makers to
formulate clinical recommendations and guidelines
on the principles of EBM. Sillico modelling methods
have proven to be very helpful while exploring
(whilst more cheaply) the impact of therapeutic
strategies. This concerns as well the individual
level ((Gao, 2019), (Troche et al., 2000)), where
the aim is to provide a personnalized prescription,
as well the population level ((Patel et al., 2021),
(Kotecha et al., 2021)). In the later case, the aim is
to consider collective benefits of the population in
terms of efficiency and cost. In both approaches,
balancing risk and benefit is an important question.
The existing approaches are based on meta-analysis
(Gao, 2019), randomized clinical (Duffy J and RJ,
2017), and/or on specific mathematical modelling
((Cottura et al., 2020), (Gumel et al., 2002)). Most
of them are disease-specific or dedicated to sub-
1036
Abchiche-Mimouni, N., Nzali, M. and Gueyffier, F.
A Knowledge-Based Approach for Evaluating Impact of Therapeutic Strategies.
DOI: 10.5220/0011894300003393
In Proceedings of the 15th International Conference on Agents and Artificial Intelligence (ICAART 2023) - Volume 3, pages 1036-1046
ISBN: 978-989-758-623-1; ISSN: 2184-433X
Copyright
c
2023 by SCITEPRESS – Science and Technology Publications, Lda. Under CC license (CC BY-NC-ND 4.0)

problems of a disease. From another perspective,
since the first well known medical expert system
MYCIN, developed by Shortliffe (Shortliffe, 1976)
(to help physicians when prescribing antimicrobial
drugs) medical applications in Artificial Intelligence
(AI) have been continually developed. AI has been
extensively employed in medicine by modelling
expertise thanks to Knowledge-Based systems and/or
by treating medical datasets with Machine Learning
algorithms (Nayyar et al., 2021). However, KBS AI
methods have not been used for the evaluation of
therapeutic strategies. Yet, healthcare applications
are ”knowledge-intensive” (Schreiber et al., 1999)
i.e, knowledge and expertise play a key role.
The present work fills this gap by proposing a
knowledge-based platform for modelling and simu-
lating therapeutic strategies with a virtual population.
Such a platform is proposed to help physicians and
policy makers to respectively formulate individual-
ized clinical decisions and, recommendations and
guidelines on the principles of EBM. The simulation
allows to illustrate and quantify the benefits and/or
the impact of a therapeutic strategy. Moreover, it
allows to compare different therapeutic strategies.
The approach has been designed in collaboration
with physicians who helped during the modelling
process of the therapeutic strategies and during
the experiments. It has been instantiated with an
application in Hypertension management, where two
therapeutic strategies and a given hypertensive virtual
population are used. The first therapeutic strategy
is the one which is consistent with the European
official guidelines for Hypertension management
((Graham and AL., 2007), (Fagard and AL., 2013),
(Unger et al., 2020)). Such a strategy is generally
in accordance with what is -supposed- to be put
into practice by physicians. It is named as Classical
strategy. An Alternative strategy is able to consider
alternative factors (risk, age, sex...) either for the
diagnostic or the prescription.
In the present work, two therapeutic strategies
(Classical and Alternative) for Hypertension manage-
ment have been simulated and evaluated, allowing
to quantify their benefits. The gain is measured for
each strategy (e.g. in terms of blood pressure level
decreasing, number of treated individuals), therefore
enabling the quantification of the impact in terms
of public health. The use of a virtual population
allows one to consider different assumptions, through
different settings, on large sizes of data cheaply and
safely (Richard J. Chen, 2021),(Ivanny, 2018). The
knowledge describing the strategies have been mod-
elled by means of production rules in order to make
it possible to modify the strategies in a declarative
way, i.e., without modifying the application program.
Because it does not require advanced programming
action, the physicians are able to introduce the
strategies in the system by themselves. Physicians
can also modify the implemented strategies and the
parameters of the simulation.
The next section of this paper presents the nec-
essary background for modelling Hypertension man-
agement. Section 3 describes the material and meth-
ods. Section 4 presents a Use-case showing the us-
ability and preleminary results of the approach in Hy-
pertension management. Section 5 provides a discus-
sion according to the contributions and related work.
Finally, the conclusion summarizes the contribution
of this paper and proposes some improvements and
perspectives for the future.
2 KNOWLEDGE MODELING
The considered domain application is related to Hy-
pertension management. This is a major risk factor
behind cardiovascular diseases, which is the largest
causes of death in the world (Roth and al., 2020).
For this reason, it is well studied and documented,
resulting in a large source of expertise and data. The
availability of home kits for self-measurement allows
for collecting patients data easily. Official guidelines
(Fagard and AL., 2013) offer clinicians guidance on
Hypertension management using the best scientific
evidence. Clinicians acquire some expertise from
their everyday practice which is also important.
Other sources of knowledge derived from physiology
or medical genetics may also be available
1
.
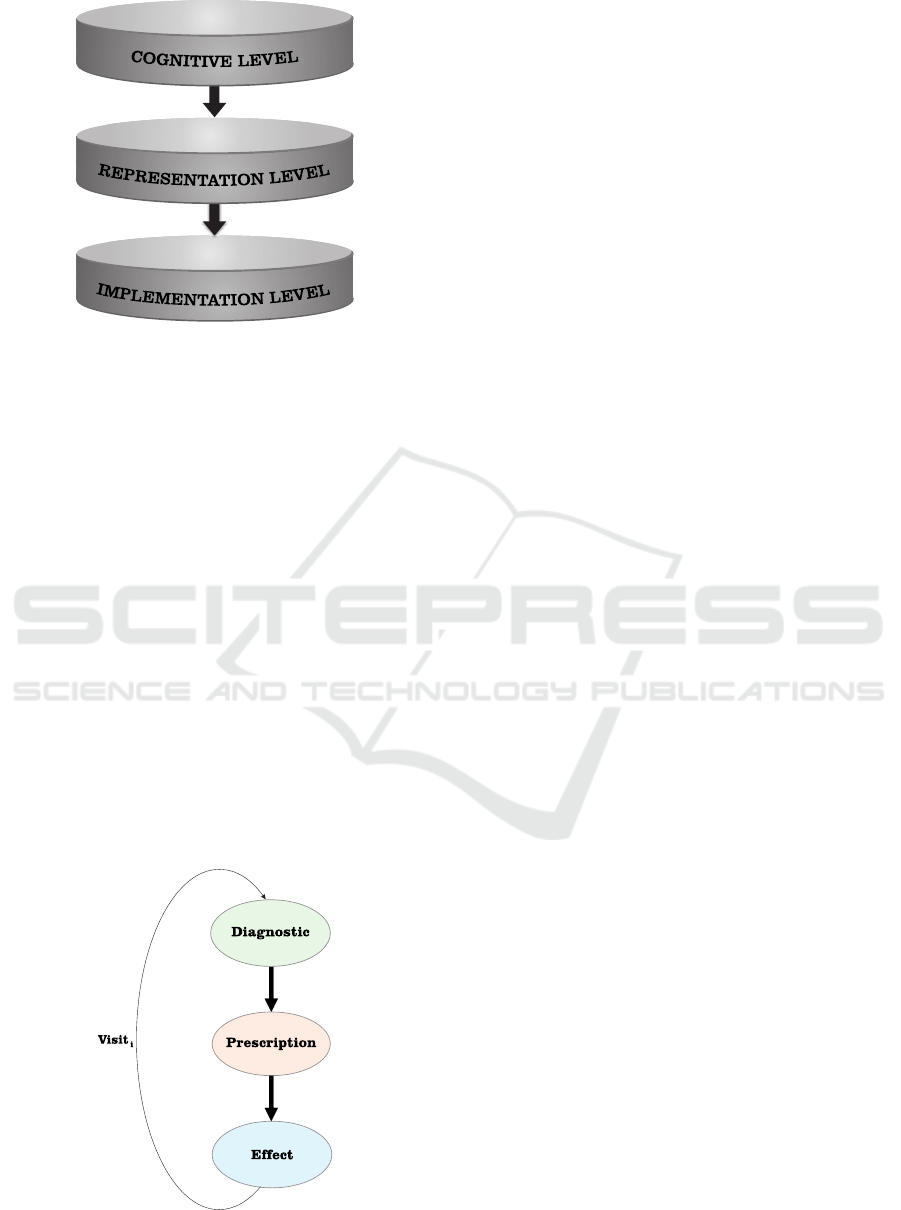
Different levels of knowledge representation can
be considered while describing complex domain
knowledge. The most popular is the one proposed
in Richter (59), based on three different levels (see
Figure 1). The first level is the Cognitive level. It
contains the expression of the expertise in human and
informal way. The second is the Representation level
which implies the use of formal (logical) languages
for expressing the knowledge. The third level is
the Implementation level, which is machine-oriented
(uses data structures and programs). As shown in Fig-
ure 1, there is a hierarchical relationship between the
three levels, meaning that the Cognitive level requires
1
It is well known that Hypertension is often associated
with other diseases. But, for simplification reasons, this will
not be considered in this work.
A Knowledge-Based Approach for Evaluating Impact of Therapeutic Strategies
1037
For young persons, consider BB first
...
IF (age < 50) THEN Choose BB
...
(defrule RR(< age 50)=>(assert (Treatment BB)))
...
Figure 1: Three-levels modelling.
a translation to be expressed into the Representation
level, which itself is translated into Implementation
level. Other proposed methodologies (e.g. (Schreiber
et al., 1999)) are more sophisticated, in terms of rep-
resentation levels and modelled concepts. To simplify
the discussions with the experts, this three-level mod-
elling method has been adopted. As it will be shown
in Section 3, the Cognitive level is used to express a
set of therapeutic strategies a in Hypertension domain
in a form close to natural language. The Representa-
tion and the Implementation levels are used to formal-
ize these knowledge. Figure 1 shows an example that
expresses the fact that the physicians use in general
Beta Blokers drugs for young poeple.
2.1 Therapeutic Strategies
A Therapeutic Strategy (TS) is defined according to
three dimensions: Diagnostic, Prescription and treat-
ment Effect (DPE). Each dimension represents a par-
Figure 2: DPE Cycle visit.
ticular step of the global therapeutic process. Figure 2
shows the DPE cycle which is associated to a medical
visit (Visit
i
).
2.1.1 Diagnostic
It is the way of deciding whether an individual is el-
igible for treatment (i.e., the individual is considered
to be hypertensive) or not. For example, a Classical
strategy consists in considering only the Blood Pres-
sure (BP) level to classify an individual as hyperten-
sive. This is generally decided based on several visits
to the doctor. An average of the measures is calcu-
lated and used for the decision. Instead of relying
solely on the pressure level of BP for deciding that
an individual is hypertensive, it also considers indi-
vidual factors such as the level of risk of developing a
stroke. The study of the individual’s profile as to the
evolution of the BP and the habits of the person, may
also provide elements of individualization of the diag-
nosis. Moreover, it is already known that the age and
sex can be taken into account ((Osude et al., 2021),
(Schoepflin et al., 2021)).
2.1.2 Prescription
It consists in choosing an adequate drug for a hyper-
tensive individual or in changing the current treatment
if it is judged ineffective. The way of choosing the
drug can be based on some predefined criteria (e.g.
gender, age). The Classical strategy considers that the
treatments have different effects due to unknown rea-
sons. So, the choice of a treatment can be assimilated
as being random. As for the Diagnostic, an Alterna-
tive strategy considers different parameters (e.g. risk)
for choosing a drug. It is also possible to combine
drugs.
2.1.3 Treatment Effect
Not much is known about the prediction of effect
of hypertensive drug on BP that would be patient
specific. We used the results from the IDEAL trial
(Gueyffier et al., 2015), completing those from
the Dickinson’s study (Dickerson et al., 1999),
supporting that BP reduction is positively corre-
lated with the age for Diuretics (DI) and Calcium
Antagonists (CA), and negatively correlated with
the age for Beta Blockers (BB) and, in general, for
Angiotensin-Converting Enzyme Inhibitors (ACEI).
Beyond the link with age, the residual variability
has been considered as random noise. In order to
model the benefit of a drug, expressions (1) and
(2) were used to quantify the treatment effect at
the individual level. The expressions 1 and 2 have
ICAART 2023 - 15th International Conference on Agents and Artificial Intelligence
1038
been inspired from obtained results in (Gueyffier
et al., 2015) concerning the AC inhibitors and the
DI. The extrapolation to CA and BB is justified by
the correlations observed in (Dickerson et al., 1999).
The new BP is calculated differently depending on
the group of the drugs and the age of the individual.
Indeed, the drugs are classified into two groups: (1)
DI, CA, and (2) BB, ACEI, and Sartans (SAR). It is
known that SAR have similar effect than ACEI and
BB. The first group is more efficient for aged persons,
with an effect increasing from 3 to 5% of BP with
age, and the second one is better for young persons
with an effect decreasing from 5 to 3% with age.
The age of the individuals of the population is
greater than 35 and less than 65 years. For the first
group, the expression is:
F = 0.03 + 0.033 ∗(age − 35) ∗ 0.02 (1)
For the second group, the expression is:
F = 0.03 + 0.033 ∗ (65 − age) ∗ 0.02 (2)
The effect of the treatment E is calculated with: F +r,
where r is a randomly generated number with a spe-
cific normal distribution. To define a general TS, it is
sufficient to specify each of the three dimensions de-
scribed above. onsidering particular criteria will fo-
cus on a particular strategy. For that purpose, it is
possible to rely on knowledge extracted from recent
scientific literature or on empirical acquired knowl-
edge by physicians during their hospital practices. In
this work, we relied on the expertise of the doctors we
partnered with.
3 MATERIAL AND METHODS
The aim of the proposed approach is to provide a
knowledge-based platform for simulating and eval-
uating TSs on a Realistic Virtual Population (RVP).
The simulation consists in launching a number of vis-
its for each individual accordding to the DPE cycle
(see Figure 2).
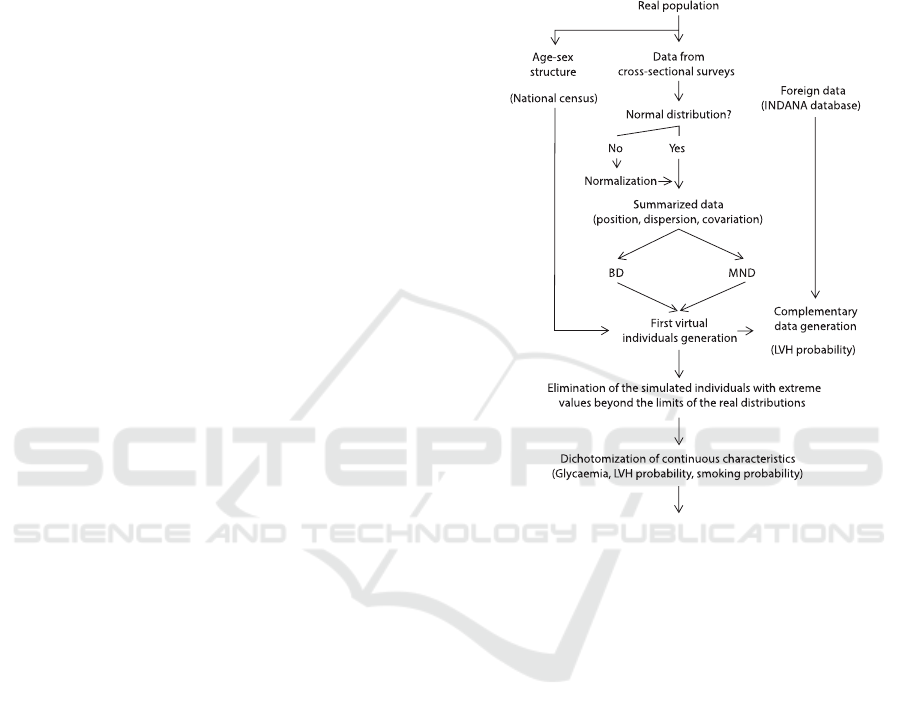
3.1 Virtual Population
Because of the difficulty in accessing a real dataset,
due to ethical and financial considerations, synthetic
data are being increasingly used ((Schoepflin et al.,
2021), (Richard J. Chen, 2021)). In our case, syn-
thetic data were built based on official French demo-
graphic statistics and summarized data from represen-
tative observational studies. For that purpose, we used
the algorithm that had been developed in (Ivanny,
2018). This was used in (T. and A., 2002) to gener-
ate a hypothetical population that reproduced a gen-
eral practitioner patient list to test the cost effective-
ness of different screening strategies. The Algorithm
(see Figure 3) allows generating a RVP of a given
number of indivuals. The individuals have the same
Realis!c Virtual Popula!on
Figure 3: Realistic Virtual Population Algorithm. genera-
tion.
age, sex and cardiovascular risk factors profile as the
French population aged 35-65 years. For each indi-
vidual, an identifier is automatically assigned. The re-
maining individual characteristics are: sex, age, sys-
tolic arterial pressure, diastolic arterial pressure, total
cholesterol, hdl cholesterol, blood sugar, smoking or
non-smoking, and diabetes mellitus. The algorithm
is based on a specifc variance-covariance matrix. We
used it in the proposed approach to generate an RVP
for simulating different TSs. The approach has been
validated with Hypertension application. When dif-
ferent TSs are simulated, their efficiency can be eval-
uated in terms of BP evolving, the evolution of the
number of treated individuals, the distribution of pre-
scription drugs and, the rate of reducing the risk.
Moreover, the public health impact of employing a
particular strategy can be quantified depending, on,
for example, of number of treated individuals. Com-
paring the outputs of the TSs allows quantifying and
comparing their benefits. The platform is based on
the architecture showed in Figure 4. It is composed
A Knowledge-Based Approach for Evaluating Impact of Therapeutic Strategies
1039

Figure 4: Platform Architecture.
of a rule-base that models the TSs and a Fact-base
for representing the RVP. The User Interface allows
setting the different parameters and configurations of
the application (e.g. the number of visits planned for
each individual composing the VRP, the thresholds
for BP). The Controller is in charge of controlling
a DPE cycle visit for each individual of the RVP. It
also treats the requests coming from the User Inter-
face. The Inference Engine triggers the rules (from
TSs rule-base) according to their relevance as defined
by the Controller. Each of these components is de-
scribed hereafter.
3.2 TSs Rule-Base
For structuring the TSs, we have opted for the pro-
duction rules formalism. This choice is motivated by
different reasons. It is close to the expert reasoning
which is often in the ”IF-THEN” form. Additionaly,
it is expressed in a textual form that is easier to
understand. So, it is easy for the experts to adhere to
such a formalism. Adding or modifying a production
rule simply consists of adding production rules or
overwriting the existing ones. The processing and
control of the rules are independent of the rules
themselves. So, the same Inference Engine is used
to process different Rule-bases. The user does not
need to know about how the system triggers nor
compiles the rules. The most common rules form is
the IF Conditions T HEN Action one, meaning that
if Conditions are satisfied then Action is executed.
Other types of rules like the m o f n rules where,
given n Conditions, the Action is executed if m
conditions from n (m ≤ n) are satisfied. Also, the
rules can be labeled with a confidence degree or a
strength.
For modelling the TSs, the rules are grouped
in packages depending on which phase of the DPE
Cycle they are part of. Their general form is:
PR: i f (pr
1
) (pr
2
) ... (pr
i
) ...and (pr
n
)
then Action, where:
PR is the name of the production rule and,
pr
i
(1 <= i <= n) is a premise that expresses a pa-
rameter constraint, pr
i
= (x
i
op α
i
), where x
i
is the
name of the i
th
parameter, α
i
is its value, and op ∈
{<, >, =, <=, >=} is an operator comparison. Ex-
amples of simplified rules are shown in Tables 1. The
Diagnostic rule (a) is used to decide whether the indi-
vidual is hypertensive if his/her Systolic Blood Pres-
sure (SBP) is higher than 140. The prescription rule
(b) chooses the BB drug if the individual is under 50
years old. The Effect rule (c) calculates the drug ef-
fect for a treated individual who is over 50 years old.
Table 1: Examples of production rules.
i f (PAS > 140) then (Hypertensive True) (1)
i f (Hypertensive True)(age < 50)
then (Drug BB)(Treaded True) (2)
i f (Treated True)(age > 50)
then (Calculate − BP post −treat) (3)
3.3 RVP Fact-Base
The RVP is a set of individuals where a list of char-
acteristics is instantiated for each individual. Each
individual is represented as a Fact-base in the form:
(c
1
v
1
) (c
2
v
2
) ... (c
i
v
i
) ... (c
n
v
n
), where: n is the
number of characteristics and, v
i
is the value of the
characteristic named c
i
. Table 2 shows examples.
Table 2: Examples of facts from RVP base.
(id 1) (sexe 1) (age 43.60) (pas 111.09)
(pad 70.87)(cto 1.96)(hdl 0.45) (glyc 1.17)
(dm 79.19)(tab 60.16) (hvg 172.75)
(id 2) (sexe 2) (age 43.38) (pas 142.80)
(pad 98.362)(cto 2.34)(hdl 0.29) (glyc 0.90)
(dm 87.75)(tab 72.63) (hvg 167.76)
(id 3) (sexe 1) (age 37.0) (pas 125.60)
(pad 80.57)(cto 2.22)(hdl 0.36) (glyc 0.740)
(dm 72.01)(tab 55.71) (hvg 169.92)
ICAART 2023 - 15th International Conference on Agents and Artificial Intelligence
1040

3.4 User Interface
The User Interface allows for adjusting the simula-
tion settings, such as the parameters defining a strat-
egy, the virtual population to employ (by uploading
associated text files) and the desired parameters to be
extracted as outputs. It is dedicated to the interaction
between the system (Controller component) and the
user. Its usefulness is threefold:
1. loading the TSs and the RVP, with adequate pa-
rameter values.
2. launching the results to extract from the simula-
tion.
3. displaying the results (curves, histograms).
Here is a parameter shortlist which can be set for each
execution session: the number of visits, the threshold
values for SBP, DBP, and risk, and, the equation coef-
ficients for calculating the treatment effect. Here are
some outputs examples:
• Histograms for measuring the optimal drug.
• Curves for measuring the BP evolution.
• The diagnostic rate which represents the numbers
of individuals considered hypertensive divided on
the number of individuals of the RVP.
• The success rate is the ratio between the number
of individuals on treatment for whom the BP is
under control, and the number of individuals in
treatment.
3.5 Controller
The Controller is in charge of two primary tasks. The
first task consists of launching the number of visits
for each individual of the RVP, and monitoring their
execution according to the DPE cycle. The Controller
acts as a metalevel by giving a focus to the Inference
Engine. The focus is successively on the Diagnosis
rules package, then the Treatment rules package, and
finally, the Effect rules package. Thus, all individuals
are simulated. The second task launches the calcula-
tions of the TSs results needed by the user. The two
tasks are performed through production rules. For that
purpose, the Controller adds adequate facts in the Lo-
cal Memory making it possible to trigger the appro-
priate rules.
3.6 Local Memory
The Local Memory contains the facts and the rules
used by the User Interface and the Controller. The
rule R1 is an example of a production rule, from
Local Memory, that expresses that it is to launch the
Diagnostic phase of the DPE cycle.
R1: i f (DPE Diag)(Individual ?p) then
(process diag ?p)
The fact F1 (respectively F2) is a fact, from Local
Memory, that expresses that it is to calculate the
success rate (respectively to switch to the Diagnostic
step of DPE Cycle):
F1: (calculate success rate), F2: (DPE Diag).
3.7 Inference Engine
The Inference Engine is the core component of the
platform. It triggers the rules, allowing their actions
to be executed. The Action part of a rule consists of
adding new facts in the working memory or the exe-
cution of a function. This provides great flexibility in
what can be done with such rules. This is the reason
why the Inference Engine component is used for all
the automated processes of the platform. For the
implementation purpose, we have used CLIPS
2
lan-
guage, which is a rule-based programming language
and scripting environment. Such a language is useful
for creating Expert Systems and other programs
where a heuristic solution is easier to implement
than an algorithmic solution. CLIPS provides a list
of functions that can be executed in the Action part
of the rules. It also allows defining functions for
application needs. The CLIPS formalism is based
on Propositional Logic and First Order Predicate
Calculus. A CLIPS knowledge base is composed of
facts which are true or false, and rules, which are
triggered according of their relevance by an instance
the CLIPS engine. Any proposition (as they are used
in Propositional or first order Logic) can be repre-
sented as a CLIPS fact. For instance, an individual
whose Id is 35, and SBP is expressed as 145mmHG,
the two facts (SBP 145) and (Id 35) are asserted.
But, if we want to deal with different person’s SBP,
one can use a structure (Individual) with two slots
(Id and SBP) that describe the Individual entity. The
facts become: (Individual (Id 35)(SBP 145)). This
corresponds very well with the familiar concept of
an object with its attributes. The facts (SBP 145)
and (Id 35) are represented as ordered facts whereas
the proposition (Individual (Id 35)(SBP 145)) is a
compound proposition, which is more conveniently
represented by an unordered fact.
2
http://www.clipsrules.net/, accessed on January 11,
2023.
A Knowledge-Based Approach for Evaluating Impact of Therapeutic Strategies
1041

The simple rule R1 should be triggered if any
patient has a SBP equal to 145.
(de f rule R1 (Individual (Id ?x)(SBP 145)) =>
(printout ?x has a high Systolic Blood Pressure))
We can also write the rule R2 that deals with a
false proposition: (de f rule R2 (not (SBP 145)) =>
(printout SBP value is not 145 !))
Obviously, to express the TSs, we need more
complex rules expressions. Let’s take the following
sample from official guidelines (Graham and AL.,
2007) for Hypertension management: ”The decision
to start hypertensive treatment should be based on
two criteria, the level of systolic being greater than
140 and diastolic blood pressure greater than 90”.
The translation of this guideline into a CLIPS rule
(R3) could be as follows:
(de f rule R3
(Individual (Id ?id)(> SBP 140)(> DBP 90)
(> NB Mesures 3)
=> (Hypertensive ?id Yes))
The individuals of the RVP are automatically
compiled into facts in the CLIPS syntax. This has
been done thanks to a script written in AWK lan-
guage
3
. In Figure 4, the oval red dotted line form
regroups the components of the architecture that are
related to the Structure level. The oval green dotted
line form regroups the components of the Implemen-
tation level. As shown in Figure 4, the Inference En-
gine is at the junction between the two levels. To show
the feasibility and the usefulness of the approach, the
present work focused on a sub-set of Hypertension
knowledge.
4 USE-CASE
Our Use-case is related to the management of Hyper-
tension and associated cardiovascular risk. We chose
a small subset of european guidelines ((Graham and
AL., 2007), (Fagard and AL., 2013)). Two simple
TSs were defined to conduct the experiment of the
approach with a RVP such as described in section 3.1.
The two strategies, a Classical strategy and Aternative
strategy, were implemented. Their respective results
were quantified to evaluate the benefit of each one in
terms of optimal drug prescription, number of avoided
3
https://www.gnu.org/software/gawk/manual/, ac-
cessed on January 11, 2023.
cardiovascular accidents, decreasing BP levels, num-
ber of treated individuals, diagnosis rate success (e.g.
successful treatment ) and more generally, their suc-
cess rate (that can include elements such as the suc-
cessful diagnostic).
4.1 Therapeutic Strategy Setting
Each TS is defined by specifying each of the three
rules packages: (1) Diagnostic rules, (2) Prescription
rules and (3) Treatment Effect rules. Launching a
strategy consists of parametrizing the User Interface
items by changing the default value(s) assigned to
each parameter. The Classical strategy is based on the
BP threshold for the diagnosis. For the prescription,
it acts in a random way for choosing a drug, based
on the hypothesis that the prescriber believes that all
the drugs are similar and produce different effects for
different individuals without any known reasons. The
Alternative strategy considers the BP threshold, age,
gender, and cardiovascular risk when choosing an ad-
equate drug. For the prescription, it assumes that the
prescriber believes that the effect of the treatment de-
pends on individual parameters. Some drugs (ACEI,
SAR, BB) are more efficient for young people, and
some others (DI, CA) are more suitable for people
over 50. The same Treatment Effect rules were used
in order to be able to quantify the contrast between
the two strategies. The two strategies were simulated
with the same RVP.
4.2 Experimentation
A same RVP of 20.000 individuals was used to con-
duct the simulation of each strategy. This size is easy
to modifiy since the RVP is automatically generated
thanks to the algorithm described in (Figure 3). For
each strategy, ten visits were planned for each indi-
vidual of the RVP. At each visit, the number of suc-
ceeded treatments and the mean of the measured BP
were calculated. At the end of the simulation, we plot-
ted for each strategy, the curve representing the evo-
lution of the BP (Figure 5), the histograms represent-
ing the number of prescriptions (Figure 6 and 7), the
number of treated individuals at each visit (Table 3)
and, the absolute risk at each visit (Table 4). We eval-
uated the gain when official recommendations (Clas-
sical strategy) are respected. The conducted experi-
Table 3: Number of treated individuals.
Strategy v4 v6 v8 v10
Alternative 2407 2637 2836 2953
Classical 2397 2657 2626 2998
ICAART 2023 - 15th International Conference on Agents and Artificial Intelligence
1042

ments showed how we can quantify the efficiency of
a particular strategy according to selected parameter
values. The curves of Figure 5 represent the evolu-
tion of the mean of measured BP over the time for
individuals which are under treatment for each strat-
egy. The experiments were also used to quantify the
Classical strategy
Alterna!ve strategy
130
136
140
146
160
0 2 4 6 8 10
Average measured SBP
Number of treated individuals/visit
Figure 5: Blood presure evolving.
superiority of one of the two strategies under defined
hypothesis. Throughout the visits, a pressure differ-
ence of 1.5 mmHg is observed; showing that the al-
ternative strategy is slightly better than the classical
one. Indeed, the average BP of the population after
ten visits is greater for the Classical strategy than for
the Alternative strategy. Table 3 visualizes the num-
ber of treated individuals at each visit, allowing to
know the number of sick individuals in the RVP. Un-
like the diagnostic method based solely on BP, we see
that fewer patients were treated when the diagnosis
considers the risk. When the treatment is based on
BP, the goal is twofold: to reduce the BP and the risk
of an accident. Considering the reduction of the risk
of accidents at each visit makes it possible to visual-
ize the number of avoided accidents. Table 4 shows
that the risk is lower with the Alternative strategy (A),
than the Classicla one (C) meaning that the number of
avoided accidents is higher. Another way to quantify
the efficiency of the strategies is the way of choosing a
treatment. More precisely, it is the ability of a strategy
to identify the optimal treatment for each individual.
The optimal treatment is the one that gives the high-
Table 4: Absolute risk at each visit.
Strategy v5 v6 v7 v8 v9
A 0.022 0.026 0.021 0.015 0.013
C 0.0195 0.0194 0.0193 0.0194 0.0195
Drug
AC BB DI ACEI SAR
Frequency
100
200
300
400
500
600
700
800
900
1 000
1 100
1 200
1 300
0
Figure 6: Optimal treatments for people over 50 years with
Classical strategy.
Frequency
Drug
AC BB DI ACEI SAR
0
250
500
750
1 000
1 250
1 500
1 750
2 000
2 250
Figure 7: Optimal treatments for people over 50 years with
Alternative strategy.
est BP decrease during the visits. Figure 6 shows the
results of optimal treatments for individuals over 50
years during the simulation of the Classical strategy,
while Figure 7 shows the results of optimal treatments
for individuals over 50 years during the simulation of
the Alternative strategy.
We note the dominance of AC and DI drugs in
both strategies, but it is much clear in the Alternative
strategy. The dominance observed in the Alternative
strategy is, obviously, due to the fact that it is based on
an age-appropriate prescription. However, it is impor-
tant to reiterate that the simulation is neither used for
optimizing the treatment (such as it is done in (Ben-
nett and Hauser, 2013)) nor for discovering new fea-
tures of Hypertension or its treatment. The aim of the
simulation is to:
1. Illustrate the consequences of considering some
scientific facts, ignored in the current guidelines.
2. Estimate the extent of BP control improvement
through the application of new rules.
A Knowledge-Based Approach for Evaluating Impact of Therapeutic Strategies
1043

5 DISCUSSION
Thanks to the developed platform, a Classical and an
Alternative strategies were simulated with a Realis-
tic virtual population. Then, their results were an-
alyzed and compared. The conducted experiments
showed how we can quantify the efficiency of a par-
ticular therapeutic strategy according to selected pa-
rameters. The originality and the strengths of our
approach are numerous. The prescription, diagnos-
tic and drug effect rules are the input of the sys-
tem. These rules can be introduced and modified
by non-programmers people, allowing prescribers to
fully test their own rules. This is due to the fact that
the AWK script (used to compile the RVP) and, the
production rules are an inputs of the platform. The
structure of the facts can be modified by adapting
the script. Moreover, the expertise should be writ-
ten in XML language (CLIPS supports it), so it is
not necessary for the user to know about the syn-
tax of CLIPS rules and facts in order to proceed to
any modification. This allows adding new parame-
ters with new rules that will process these parame-
ters. Since all the expertise is written in production
rules, the platform can be applied to any other appli-
cation domain. Our approach provides a complement
to the statistical tools that often impose a rigid data
format and manipulation requiring the mastery of the
tool. In fact, the proposed platform used production
rules for modelling the therapeutic process, which is
close to human deduction reasoning, as employed by
physicians. Note that our platform allowed differents
kinds of experimentations that have not been reported
here. In this paper, we reported only a part of the
carried ones. The source code of the platform, de-
tails about how to parametrize an experimentation,
and a sample of the used data and expertise can be
found on: https://github.com/nabchiche/ISThMe.git.
To the best of our knowledge, this work is the first
that proposes an approach that combines such ad-
vantages. Existing approches are based on meta-
analysis (Gao, 2019), randomized clinical (Duffy J
and RJ, 2017), and/or on specific mathematical mod-
elling ((Cottura et al., 2020), (Gumel et al., 2002)).
Most of them are disease-specific or dedicated to sub-
problems of a disease. More recently, Machine Lean-
ing has gained in interest due to their prediction power
(Phan et al., 2022). Unfortunately, they suffer from
the Blax-box effect that make them unusable, espe-
cially when evidence is needed to take a decision,
such as in medicine.
6 CONCLUSION AND
PERSPECTIVE
We have presented an approach for studying and eval-
uating the efficiency of therapeutic strategies in Hy-
pertension management. The approach proposed a
platform where the knowledge describing the thera-
petic strategies had been modelled by means of pro-
duction rules. This makes it possible to modify the
strategies in a declarative way, i.e., without modify-
ing the source code of the application.
Current work concerns the addition of more com-
plex expertise so that one can deal with comorbidi-
ties. Hypertension is often associated with other dis-
eases (e.g., diabetes). Comorbidities can be consid-
ered by implementing the ability to use different ef-
fect models of drugs that consider comorbidity fac-
tors (e.g. by considering kinetic models ((Holford
and Sheiner, 1982), (Donnelly et al., 1992)). More-
over, it should be possible to consider the variability
of the BP according to the day-night rhythm or the
seasons ((Giles, 2006), (Chen and Yang, 2015)). In
the current version of the system, the knowledge base
related to the official guidelines had been manually
extracted. An open direction that would seem natu-
ral is to compile the expertise into rules and facts di-
rectly usable by CLIPS; so, the human intervention
would be minimal. For that purpose, the work done
in (Isern et al., 2007) could be a precious source of
inspiration. The authors provide a flexible framework
to follow the execution of clinical guidelines based
on an ontology and a multi-agent system. Another
idea to explore is the use text of mining techniques
for buildings production rules from clinical guide-
lines. The proposed approach would be very helpful
to implement a framework for benefit-risk appraisal
of medicines in order to provide transparent and re-
sponsible benefit-risk decision making model as de-
scribed in (Filip Mussen, 2009).
ACKNOWLEDGMENTS
We thank the National Association of Research and
Technology for funding this work, Ivanny Marchant
who helped to generate the VRP, and Nora Abchiche-
Habtoun for helping to produce high-quality images.
REFERENCES
Bennett, C. C. and Hauser, K. (2013). Artificial intelligence
framework for simulating clinical decision-making: A
ICAART 2023 - 15th International Conference on Agents and Artificial Intelligence
1044

markov decision process approach. Artificial Intelli-
gence in Medicine, 57(1):9–19.
Chen, L. and Yang, G. (2015). Recent advances in circa-
dian rhythms in cardiovascular system. Frontiers in
Pharmacology, 6.
Cottura, N., Howarth, A., Rajoli, R. K., and Siccardi, M.
(2020). The current landscape of novel formulations
and the role of mathematical modeling in their de-
velopment. The Journal of Clinical Pharmacology,
60(S1):S77–S97.
Dickerson, J., Hingorani, A., Ashby, M., Palmer, C., and
Brown, M. (1999). Optimisation of antihypertensive
treatment by crossover rotation of four major classes.
Lancet, 353:2008–2013.
Donnelly, R., Elliott, H., and Meredith, P. (1992). Antihy-
pertensive drugs: Individualized analysis and clinical
relevance of kinetic-dynamic relationships. Pharma-
cology & Therapeutics, 53(1):67–79.
Duffy J, Hirsch M, K. A. G. C. P. L. P. M. S. M. W. P.
K. K. Z. S. and RJ, M. (2017). Outcome reporting
across randomised controlled trials evaluating thera-
peutic interventions for pre-eclampsia. BJOG: An
International Journal of Obstetrics & Gynaecology,
124(12):1829–1839.
Fagard, R. and AL. (2013). 2013 esh/esc guidelines for the
management of arterial hypertension. European Heart
Journal, pages 1–72.
Filip Mussen, Sam Salek, S. W. (2009). Benefit-Risk
Appraisal of Medicines: A Systematic Approach to
Decision-making. Wiley-Blackwell.
Gao Q, Gao W, Xia Q, Xie C, Ma J, Xie L. (2019). Ef-
fectiveness of therapeutic strategies for patients with
neck pain: Protocol for a systematic review and net-
work meta-analysis. Medicine, 98(11):e14526.
Giles, T. (2006). Circadian rhythm of blood pressure and the
relation to cardiovascular events. Journal of hyperten-
sion. Supplement : official journal of the International
Society of Hypertension, 24:S11–6.
Graham, I. and AL. (2007). European guidelines on cardio-
vascular disease prevention in clinical practice: exec-
utive summary. European Heart Journal.
Gueyffier, F., Subtil, F., Bejan-Angoulvant, T., Baguet, J.,
Boivin, J., Mercier, A., Leftheriotis, G., Gagnol, J.,
Fauvel, J., Giraud, C., Bricca, G., Maucort-Boulch,
D., and Erpeldinger, S. (2015). Can we identify re-
sponse markers to antihypertensive drugs? first results
from the ideal trial. Journal of Human Hypertension,
pages 7–22.
Gumel, A., Zhang, X.-W., Shivakumar, P., Garba, M., and
Sahai, B. (2002). A new mathematical model for as-
sessing therapeutic strategies for hiv infection. Jour-
nal of Theoretical Medicine, 4.
Holford, N. H. and Sheiner, L. B. (1982). Kinetics of phar-
macologic response. Pharmacology & Therapeutics,
16(2):143–166.
Isern, D., S
´
anchez, D., and Moreno, A. (2007). Hecase2: a
multi-agent ontology-driven guideline enactment en-
gine. In CEEMAS 2007, volume 4696, pages 322–
324, Leipzig, Germany. Springer Verlag.
Ivanny, M. (2018). Optimization of sudden cardiac death
prevention in type 2 diabetes in France : a public
health simulation study on a realistic virtual popula-
tion. PhD thesis, UCB Lyon 1.
Kotecha, R. R., Hsu, D. J., Lee, C.-H., Patil, S., and Voss,
M. H. (2021). In silico modeling of combination sys-
temic therapy for advanced renal cell carcinoma. Jour-
nal for ImmunoTherapy of Cancer, 9(12).
Nayyar, A., Gadhavi, L., and Zaman, N. (2021). Chapter 2 -
machine learning in healthcare: review, opportunities
and challenges. In Singh, K. K., Elhoseny, M., Singh,
A., and Elngar, A. A., editors, Machine Learning and
the Internet of Medical Things in Healthcare, pages
23–45. Academic Press.
Osude, N., Durazo-Arvizu, R., Markossian, T., Liu, K., Mi-
chos, E. D., Rakotz, M., Wozniak, G., Egan, B., and
Kramer, H. (2021). Age and sex disparities in hyper-
tension control: The multi-ethnic study of atheroscle-
rosis (mesa). American Journal of Preventive Cardi-
ology, 8:100230.
Patel, K., Dodds, M., Gonc¸alves, A., Kamal, M. A., Rayner,
C. R., Kirkpatrick, C. M., and Smith, P. F. (2021).
Using in silico viral kinetic models to guide thera-
peutic strategies during a pandemic: An example in
sars-cov-2. British Journal of Clinical Pharmacology,
87(9):3425–3438.
Phan, A.-C., Phan, T.-C., and Trieu, T.-N. (2022). A sys-
tematic approach to healthcare knowledge manage-
ment systems in the era of big data and artificial in-
telligence. Applied Sciences, 12(9).
Richard J. Chen, Ming Y. Lu, T. Y. C. D. F. K. W. .
F. M. (2021). Synthetic data in machine learning for
medicine and healthcare. Nature Biomedical Engi-
neering, 5:493–497.
Roth, G. A. and al. (2020). Global burden of cardiovascular
diseases and risk factors, 1990–2019: Update from the
gbd 2019 study. Journal of the American College of
Cardiology, 76(25):2982–3021.
Sackett, D. L., Rosenberg, W. M. C., Gray, J. A. M.,
Haynes, R. B., and Richardson, W. S. (1996). Ev-
idence based medicine: what it is and what it isn’t.
BMJ, 312(7023):71–72.
Schoepflin, D., Holst, D., Gomse, M., and Sch
¨
uppstuhl,
T. (2021). Synthetic training data generation for vi-
sual object identification on load carriers. Procedia
CIRP, 104:1257–1262. 54th CIRP CMS 2021 - To-
wards Digitalized Manufacturing 4.0.
Schreiber, G., Akkermans, H., Anjewierden, A., de Hoog,
R., Shadbolt, N. R., Van de Velde, W., and Wielinga,
B. J. (1999). Knowledge Engineering and Manage-
ment: The CommonKADS Methodology. The MIT
Press.
Sheridan, D. J. and Julian, D. G. (2016). Achievements and
limitations of evidence-based medicine. Journal of the
American College of Cardiology, 68(2):204–213.
Shortliffe, E. (1976). Computer-Based Medical Consulta-
tions: MYCIN. Elsevier/North Holland, New York.
T., M. and A., R. (2002). Resource implications and health
benefits of primary prevention strategies for cardio-
A Knowledge-Based Approach for Evaluating Impact of Therapeutic Strategies
1045

vascular disease in people aged 30-74: mathematical
modeling study. BMJ, pages 325–197.
Troche, C. J., Paltiel, A. D., and Makuch, R. W. (2000).
Evaluation of therapeutic strategies: A new method
for balancing risk and benefit. Value in Health,
3(1):12–22.
Unger, T., Borghi, C., Charchar, F., Khan, N. A., Poulter,
N. R., Prabhakaran, D., Ramirez, A., Schlaich, M.,
Stergiou, G. S., Tomaszewski, M., Wainford, R. D.,
Williams, B., and Schutte, A. E. (2020). 2020 inter-
national society of hypertension global hypertension
practice guidelines. Hypertension, 75(6):1334–1357.
ICAART 2023 - 15th International Conference on Agents and Artificial Intelligence
1046
