
Assessing the Impact of Attacks on Connected and Autonomous
Vehicles in Vehicular Ad Hoc Networks
Kaushik Krishnan Balaji, Dimah Almani
a
and Steven Furnell
b
Cyber Security Research Group, School of Computer Science, University of Nottingham, Nottingham, U.K.
Keywords: Attacks, Blackhole, CAV, DDoS, Grayhole, MITM, VANET.
Abstract: The transportation sector is evolving rapidly towards more sustainable and safer solutions with the idea of
Connected and Autonomous Vehicles (CAVs) based upon Vehicular Ad-hoc Network technology. The
biggest challenge for CAVs is the security threats due to their open nature and internet connections, opening
a wide range of vulnerabilities. In this research, the impact of four cyber security attacks (Distributed Denial
of Service (DDoS), Man-in-the-Middle (MITM), Blackhole and Grayhole) is quantified in terms of network
and transportation performance metrics. The map is setup based on a busy urban area in a UK city, and a
combination of OMNeT++, Sumo and Veins software tools are used for modelling and simulating the attacks
on the network. The simulation is performed with and without the attacks for an accident scenario. MITM is
found to have maximum impact severity on the transportation operational efficiency and safety of the CAV
network. The dynamic rerouting algorithm of the network is identified as the most vulnerable attack vector,
experiencing maximum impact from all the attacks. A maximum packet loss of 82% is achieved by a DDoS
attack. These insights showcased the importance of analysing the impacts of security attacks on the
transportation efficiency of the CAV network, which is vital for building reliable and safer next-generation
mobility systems.
1 INTRODUCTION
Seen as a key element in the future of the
transportation sector, evolving from independent
manually operated vehicles to those that are able to
operate autonomously while communicating with
each other and via the wider Internet. CAVs have the
potential to save billions of people by preventing road
accidents, providing fast emergency services, and
alerting operators of impending hazards. All of these
features are achieved through a dedicated wireless
network that enables the communication between
vehicles (V2V) and infrastructures (V2I). This
communication technology is a Vehicular Ad-hoc
Network (VANET), a decentralized wireless network
capable of disseminating data through a hopping
mechanism. IEEE 802.11p - also known as Dedicated
Short-Range Communication (DSRC) or WAVE - is
the standard that defines the radio frequency channels
and the specifications for V2V, V2I and V2X
communication (Arena et al. 2020). VANET
a
https://orcid.org/0000-0001-6319-4840
b
https://orcid.org/0000-0003-0984-7542
technology focuses only on communication between
moving and stationary nodes and infrastructure.
CAVs are advancement over VANET technology
with additional sensors and powerful standalone
computational units capable of decision-making and
autonomous traversal. The CAV network is
connected to the Internet, which makes it prone to
cyber-attacks that exploit the vulnerability of
vehicles. Since these attacks may directly impact
human life, it is crucial to study the impact of these
attacks on CAV to develop a cyber-resilient
transportation network.
Much of the research on cyberattacks is focused
on the network efficiency of VANETs. They study
the impact of attacks on the routing protocols and how
to improve the efficiency of networks in terms of only
packet delivery ratio and data throughput without
considering safety and transportation efficiency.
There is a knowledge gap about how the impact of
attacks on the communication network influence the
traffic behaviour and safety of CAVs. This is vital
774
Balaji, K., Almani, D. and Furnell, S.
Assessing the Impact of Attacks on Connected and Autonomous Vehicles in Vehicular Ad Hoc Networks.
DOI: 10.5220/0011894200003405
In Proceedings of the 9th International Conference on Information Systems Security and Privacy (ICISSP 2023), pages 774-782
ISBN: 978-989-758-624-8; ISSN: 2184-4356
Copyright
c
2023 by SCITEPRESS – Science and Technology Publications, Lda. Under CC license (CC BY-NC-ND 4.0)

because despite development of any level of
prevention mechanisms, the attackers may always a
vulnerability to exploit. This study analyses the
impact of four classes of cyber attacks on the
transportation operations and safety of CAV network,
to provide better understanding of building effective
mitigation systems and plans.
We have investigated and simulated different case
scenarios based on such attacks in VANETs. The map
is set up in a busy urban area in a UK city. A
combination of OMNeT++, Sumo, and Veins
software tools are used for modelling and simulating
the attacks on the network. The simulation is
performed with and without attacks under some
accident scenarios. The analysis is performed with the
base scenario as a benchmark against attacks. The
result is quantified by compare and contrast method.
The main discussion begins with background on
CAV and VANET technologies and the attacks to
which they may be exposed. This is followed by some
discussion of prior works that have considered the
attack scenarios, and the opportunity to extend from
this. Section 4 then describes the approach taken in
this research, including the simulation tools and
parameters, and the attacks to be simulated. The
associated findings are then presented in Section 5,
looking at the impact of attacks under different
simulation conditions. Finally, Section 6 concludes
the discussion and highlights future research
opportunities.
2 BACKGROUND
CAV is an application of VANETs and differs in a
way that all nodes in CAV are considered to be
powerful standalone units with sensors, storage, and
networking capability. In VANETs, the nodes are
considered only as mobile access points. Since CAVs
use VANETs for networking, it is relevant to
investigate where the attacks occur in VANETs.
The VANETs consist of On-board Units (OBUs)
inside the vehicle, Road-Side Unit (RSUs) in the
roads which forms part of the infrastructure, and the
node which is the vehicle itself (Hamida et al. 2015).
These units interact to support Vehicle-to-Vehicle
(V2V) and Vehicle-to-Infrastructure (V2I)
communication. Using 802.11p, the vehicles can
share safety, service and network messages among
other vehicles within the range. Furthermore, the
RSU enables the message transmission to other
vehicles farther from the source vehicle Hence it is
vital to analyse and secure all possible cyber-attacks
which otherwise would lead to loss of life and
property.
Hamida et al. (2015) indicate that V2I
communication links RSU and OBU to Trusted Third
Parties (TTPs) such as service providers, government
authorities (police, emergency) and car
manufacturers providing various services like
entertainment media, software updates over the air, ad
services, etc. It is clear that CAVs will expand into all
forms of life, making the network's security the top
research priority. VANETs are designed to identify
the traffic congestion in the network and the ability to
reroute the vehicles to reduce traffic delay (Milojevic
& Rakocevic, 2013). This study primarily focuses on
the simulation of this dynamic rerouting feature of
VANETs by analysing the traffic delay and other
impacts caused by security attacks.
Cyber attacks targeting the VANET can take
various forms, as categorised and summarised in
Table 1 (noting that those marked with * denote
attacks that are selected for more specific study in the
experimental part of the paper) (Hasrouny et al.,
2017).
Table 1: Forms of attack in VANET contexts.
Attack type Description
Availabilit
y
Denial of
Service
(DoS)
The network is overloaded by
packet flooding to stop sending or
receiving legitimate messages
between vehicles and
infrastructure. The attack is
initiated b
y
onl
y
one vehicle.
Distributed
Denial of
Service
(DDoS)*
Carried out by many attackers in
the network by simultaneously
flooding the network. It is more
difficult to detect and can disrupt
the entire transportation network.
Jamming
Reducing the network capabilities
by creating noisy communication
signals and overloads increasing
the network interference.
Spamming
The network is flooded with
unwanted spam messages that take
up the bandwidth and reduce the
network efficiency by increasing
latency.
Blackhole*
The nodes create fake messages
claiming a short route to
destination and establish a trusted
connection into the network. Once
perpetrated, it deletes the packets
received creating a break in the
chain of route messages leading to
hu
g
e halts of vehicles.
Assessing the Impact of Attacks on Connected and Autonomous Vehicles in Vehicular Ad Hoc Networks
775

Table 1: Forms of attack in VANET contexts (cont).
Attack type Description
Identification / Authentication
Man in the
Middle*
The attacker enters the network as
an authenticated genuine node and
intercepts the messages to tamper,
delay, spoof and drop in the
network. Since the attacker can
intercept the messages, it provides
the root for all other kinds of
attacks.
Sybil The attacker creates many
identities in the network creating
an illusion of congestion to other
nodes thus creating malfunctioning
of network operations.
Replay The attacker replays an older
authentication message and enters
the network in disguise of an
authorized use
r
.
Wormhole A pair of attackers create a
message broadcast tunnel in the
network. Nodes that interact within
this tunnel will falsely think the
other nodes are nearby but not in
realit
y
.
Confidentiality/Pri
Eavesdropping The attackers enter the network as
legitimate nodes and gather
sensitive information about other
nodes in the network by
eavesdro
pp
in
g
on the messa
g
es.
Tracking The attacker continuously tracks
the location and direction of a
target node in the network.
Integrity
Spoofing Targeted at compromising the
sensors of the nodes by creating
fake signals to trick them. Sensors
widely targeted are GPS. Once the
sensors are compromised, they
generate false information of the
node and is spread in the network.
Grayhole* Similar to a blackhole attack but
differs in the way it deletes the
messages. The attackers selectively
delete messages from the network
to evade detection.
Non-repudiation
Impersonation The attacker obtains the
authentication details of other
vehicles and uses it to make
legitimate nodes send messages on
its behalf. Since it hides behind
normal node, it is difficult to
detect.
Repudiation
The attacker will use the authentic
user ID of others to perform the
attack making it difficult to prove
the attacker’s real identity.
3 RELATED WORK
While prior studies have considered attack scenarios,
there has yet to be work dedicated to evaluating the
impact on VANET efficiency.
Ahmad et al. (2018a) conducted a MITM attack
simulation on VANETs to determine its impact on the
network behaviour. This work analysed the impact of
varying the volume of nodes participating. The attack
included tampering messages, modification of
transmission time, and deletion. The study concluded
that the attack severely reduced the packet delivery
ratio. Loss of critical safety messages leads to poor
transportation safety.
Grover et al. (2013) conducted a similar
experiment by simulating GPS spoofing attacks on
VANETs to determine its effect on the packet
delivery ratio and vehicle speed. It produced similar
results with poor packet delivery ratio and increased
interference affecting the average speed of nodes
significantly. However, both works focused on the
impact of cyber-attacks created on the VANET
communication protocol operations with less regard
to the safety and traffic behaviour of the network.
Garip et al. (2015) and Ekedebe et al. (2015)
evaluated the impact of security attack on CAVs in
terms of performance metrics of network traffic
operations. Garip et al. simulated a botnet attack to
determine the delay created in the travel time of
nodes. The botnets created fake messages stating the
route is clear while it is very congested in reality.
The work of Garip et al. and Ekedebe et al
provided an idea of how to look at network
performance metrics of transportation behaviour. Our
study extends upon these works to fill the knowledge
gaps on the CAV network's safety and traffic flow
behaviour under different cyber-attacks.
4 METHODOLOGY
To evaluate the impact of the previous attacks on
CAVs, the requirements in the simulation step will be
set as follows:
Choose a suitable simulation tool that operates
VANET communications.
Design a working simulation environment of
VANET using CAV technology that supports
V2V, V2I and V2X communications.
Select security attack scenarios that affect
VANET technology.
Define a real-world map and user-defined vehicle
count, position, movement, and infrastructure
ICISSP 2023 - 9th International Conference on Information Systems Security and Privacy
776
Customize simulation parameters to test
different real-world scenarios seamlessly.
Output the statistical data for comprehensive
analysis of impact of the simulated attacks.
4.1 Simulation Platform and Tools
OMNeT++, Veins, and SUMO collectively satisfy all
the simulation goals. Objective Modular Network
Testbed (OMNeT++) is an extensible, modular,
component-based C++ simulation library and
framework primarily for building network simulators.
OMNeT++ is designed to simulate large-scale
communication networks. Events are generated at
discrete points in time. The system is simulated by
processing these events, which allows the simulation
of complex systems with high accuracy and realism.
OMNeT++ provides a wide range of features that
make it an ideal tool for network simulation. It
supports network protocols, including Ethernet, IP,
TCP/IP, and UDP/IP. It also provides a graphical user
interface (GUI) for creating and running simulations.
Vehicles in Network Simulation (Veins) is a
framework for modelling vehicular networks. It
creates realistic maps and network communication
protocols and defines how the vehicle or
infrastructure interacts. In addition, custom models of
security attacks are created inside the Veins
framework. The Simulator of Urban Mobility
(SUMO) is a traffic mobility framework used for
creating each vehicle's mobility patterns and routes in
a real-world map (Lopez et al., 2018).
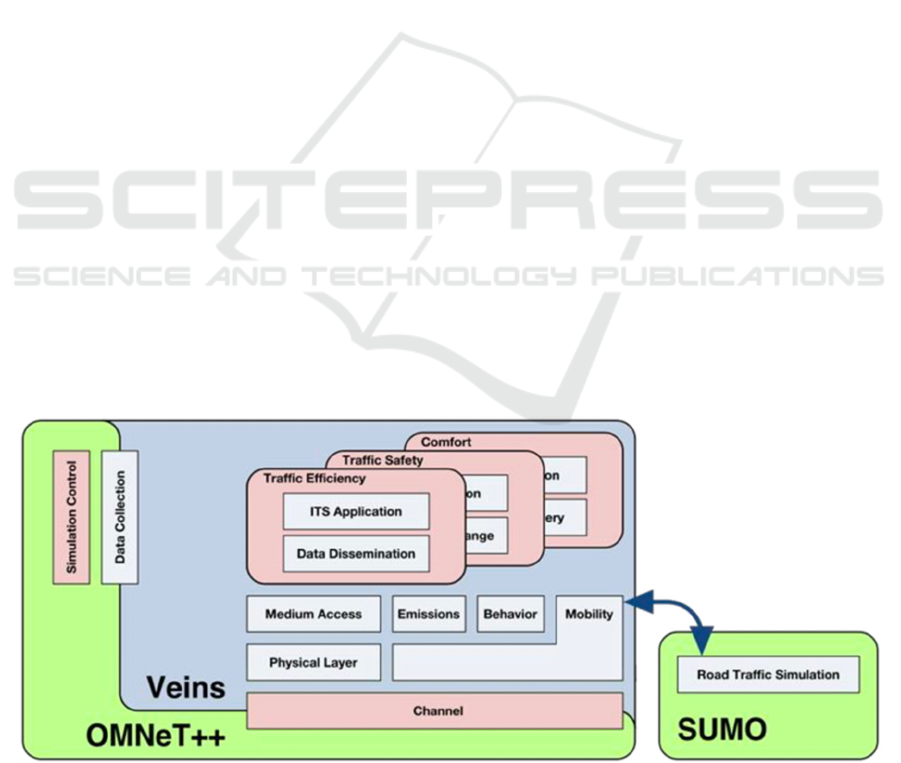
Figure 1 depicts how the various elements work
together. The first step of the simulation is to create a
traffic scenario using SUMO. Map, Number of
Vehicles, Position of RSU, Position of Attacker
Vehicles, Vehicle Routes and Speed are the
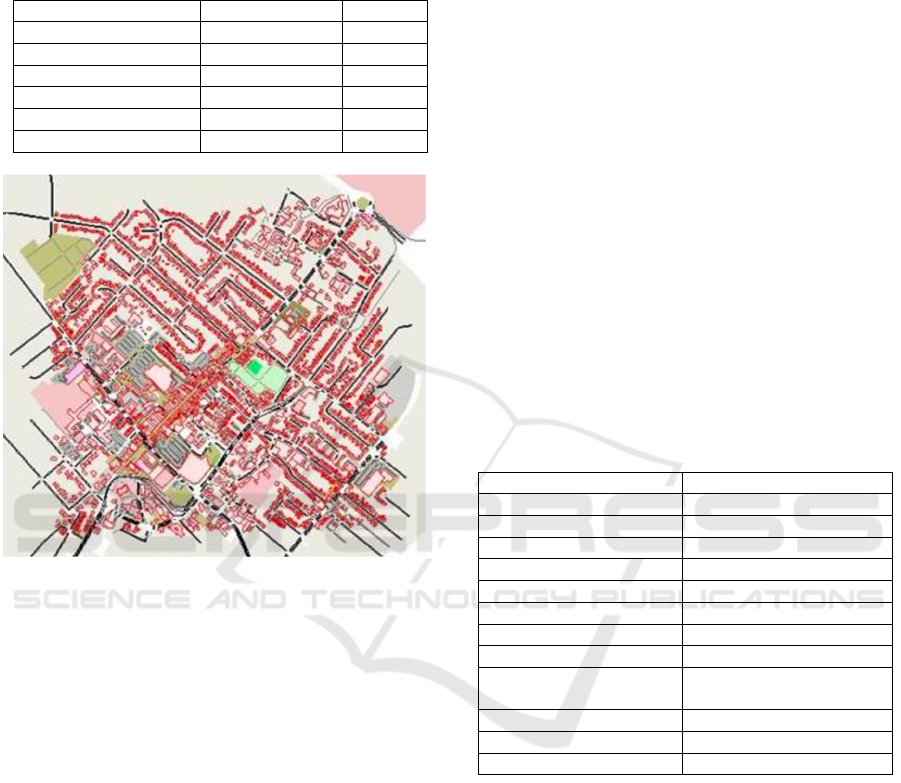
parameters modelled using SUMO. The chosen
context is an urban city area close to the authors’
university. A related map was downloaded from
OpenStreetMap and processed to a SUMO-
compatible format (using the JOSM tool to clean the
map and remove unwanted objects, and Gatcom
Sumo to build SUMO model files). The cleaned map
is converted to .net and .poly files using netConvert
and polyConvert tools of SUMO as seen in Figure 2.
The .net and .poly files contain network details of the
map like the latitude, longitude, traffic lights, speed
limit, obstacles etc.
Routes, traffic and SUMO configuration files are
then generated to enable OMNeT++ to run the
simulation with the Veins network framework. To
keep the simulation controlled for analysis purposes,
only one trip with a variable number of cars and a
single RSU is created. Three scenarios with varying
traffic density (10, 25 and 40 cars) are modelled to
determine how this affects network performance.
In the simulation, cars start to generate from the
same location every 500ms until the total count is
reached and they follow the Krauss Car-Following
mobility model (Song et al. 2014). The speed of the
cars is set to follow the speed limits of the map route.
In case of any emergency or accident, VANET
broadcasts safety messages to other nodes and RSUs
to warn of the incident and enable rerouting of other
vehicles to avoid further crashes and traffic delays.
For the purposes of this study, an accident is modelled
halfway along a main road route and the RSU is
positioned near the accident spot. The study focuses
on how the network reacts to the accident and how the
ideal performance is affected during different cyber-
attacks.
Figure 1: Simulation framework.
Assessing the Impact of Attacks on Connected and Autonomous Vehicles in Vehicular Ad Hoc Networks
777
A full list of the tools and versions used in the
simulation is presented in Table 2.
Table 2: Summary of tools in the simulation platform.
Tool type Tool Version
Network Simulato
r
OMNeT++ 5.6.2
Network Mobilit
y
Veins 5.2
Traffic Generato
r
SUMO 1.3.1
Ma
p
customisation GatCom Sumo 1.04
OpenStreetMap Edito
r
JOSM 18543
Operating System Windows 10 10
Figure 2: Final simulation map using SUMO.
4.2 Simulation Parameters
The purpose of the simulation is to quantify the
impact of the attacks on vehicular network
performance. Certain assumptions are made for the
simulation:
Obstacle detection and avoidance techniques are
not considered. Sensors such as Lidar, Radar,
and Cameras are used for these techniques in the
real world.
Vehicle mobility is fully autonomous without
intervention from the passengers, even during
an accident or emergency.
After the accident, the vehicle halts for 40
seconds. Although the real-world delay after an
accident is more, a lesser delay time is chosen
for the simulation to consume less computation
time. However, the assumption has a negligible
effect on the network study as with real-world
scenarios.
The simulation also assumes a certain volume of
vehicles: in each simulation scenario, traffic
flow and vehicle volumes were kept consistent.
This volume was created arbitrarily to represent
the urban environment at different stages of the
day.
Vehicles will work perfectly without any delay
or crash when there are no attacks.
The parameters adopted for the simulation are as
summarised in Table 3. When the simulation begins,
the cars start moving in the route generated and send
beacons to RSU once in range. The beacons are
WAVE Short Messages containing information about
direction and identification. At this point, the beacons
are just like “hello” to RSU which keeps a record of
the interaction of cars. When the first car meets with
an accident, it broadcasts safety-critical control
messages to RSU and other cars within range. It
identifies alternate routes and broadcasts the route
road ID. Cars outside the range of the accident car
will not receive the alternate route message. RSU will
inform those vehicles once in range. After a delay of
40 seconds, the cars start moving into the alternate
route. Without any attacks, all cars reach their
destination before the simulation time of 240 seconds.
Table 3: Simulation parameters.
Paramete
r
Setting(s)
Routing Protocol DSRC, WAVE
PHY IEEE 802.11
p
Mode Wireless
Communication Ran
g
e 600m
Packet size 132 bytes
RSU 1
Vehicles 10, 25, 40
S
p
ee
d
Ma
p
route s
p
ee
d
Threats MITM, DDoS,
Blackhole, Grayhole
Runtime 240s
Accident count 1
Attackers Variable %
As indicated in Table 1, four classes of attack
were selected for study. These are then simulated at
25%, 50% and 75% of attacker cars in the network, to
evaluate the network impact as attacks intensify. The
nature of each attack is described below, along with
associated pseudo-code in Table 4.
Man-in-the-Middle: Messages received from
normal cars during the accident contain alternate
route data. If tampered with (as assumed here),
rerouting is affected; traffic delays will increase
and may cause more accidents. In our study, the
randomly chosen attacker nodes check for
accident messages from normal cars. Once
detected, the alternate route ID in the message is
replaced with its current route ID and forwarded
ICISSP 2023 - 9th International Conference on Information Systems Security and Privacy
778
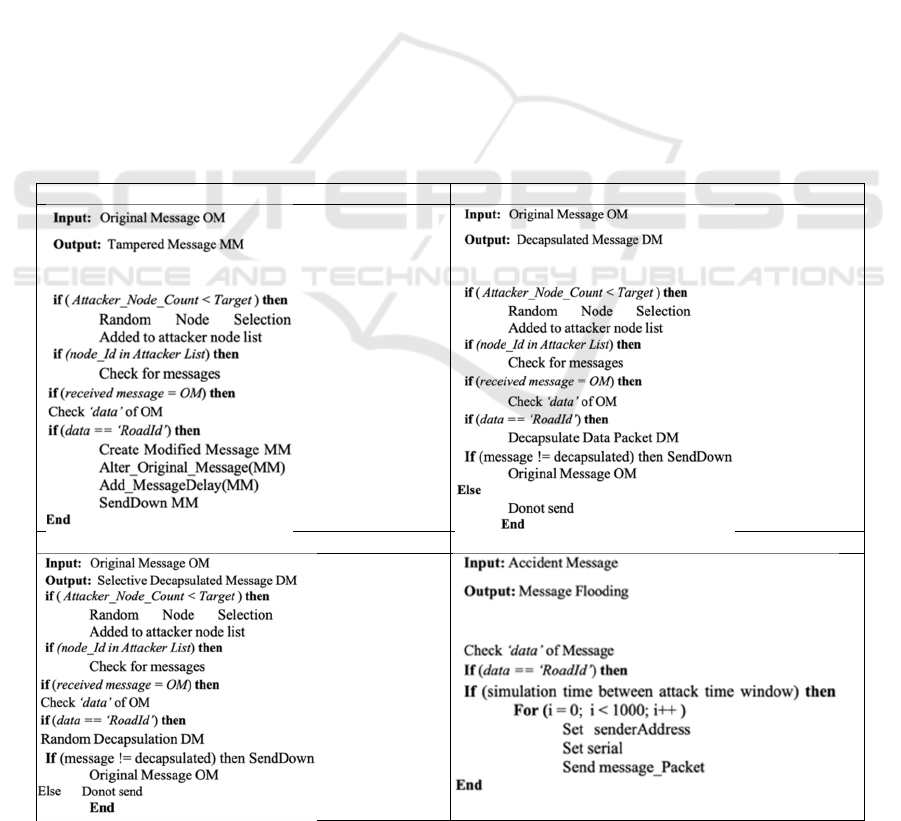
with random delay. When other nodes receive
this message, they will not know about the
accident or alternate route and will drive in the
predefined route leading to more traffic, delay
or crash.
Blackhole: Attacker cars delete messages
received from normal cars. Receiver cars will
not be aware of the accident and the alternate
route thus creating traffic and other issues.
Grayhole: Randomly selects the messages it
wants to delete so that it will not be detected by
the network.
Distributed Denial of Service: Attacker nodes
for DDoS attacks are created separately as
‘Attacker’ cars instead of choosing randomly
from normal cars. Since the attack is flooding
the network with a large volume of packets, the
simulation computation time is too long if the
attacker is chosen randomly. As such, a fixed
number of 4 attackers are created and positioned
at the accident zone for the attack simulation.
Increasing the percentages of attacker cars as
seen in other attacks is not a computationally
viable solution. Instead, the attacker volume is
controlled via a flooding time window. The
attack will only happen within this window. For
example, 25% of attackers create an attack
window of 60 seconds which is 25% of total
simulation time. This window always starts at
the same time as the accident event. The 4
attacker cars then flood the network with 1000
packets of each received message until the
window ends. The packet rate is not pushed to
the network bandwidth limit as it crashes the
simulation software. However, the flooding rate
is sufficient to cause disruption.
All the attacks were simulated with three different
sets of cars (10, 25, 40) and three different attacker
percentages (25%, 50%, 75%) creating a total of 9
scenarios for each attack. After analysis it is found
that the attacker percentages did not have any impact
on DDoS, Blackhole and Grayhole attacks due to the
smaller simulated network. They showed drastic
impact when run for 1000 nodes with an extended
simulation time of 500s. However, due to the scope
and timeline of the research project, heavy network
simulation could not be performed as it required
Table 4: Adversary models for the four simulated attacks.
MITM attac
k
Blackhole attac
k
Grayhole attac
k
DDoS attac
k
Assessing the Impact of Attacks on Connected and Autonomous Vehicles in Vehicular Ad Hoc Networks
779
significant computation time and processing leading
to frequent crashes of the system. The intended
research outcome can be inferred from a smaller
simulation network with negligible inaccuracy. For
the purposes of the results reported here all scenarios
were simulated with different numbers of vehicles
(10, 25, 50) and a fixed proportion of 25% attackers.
The latter is in line with the proportion used by other
studies, such as Ahmad et al. (2018a, 2018b).
5 RESULTS
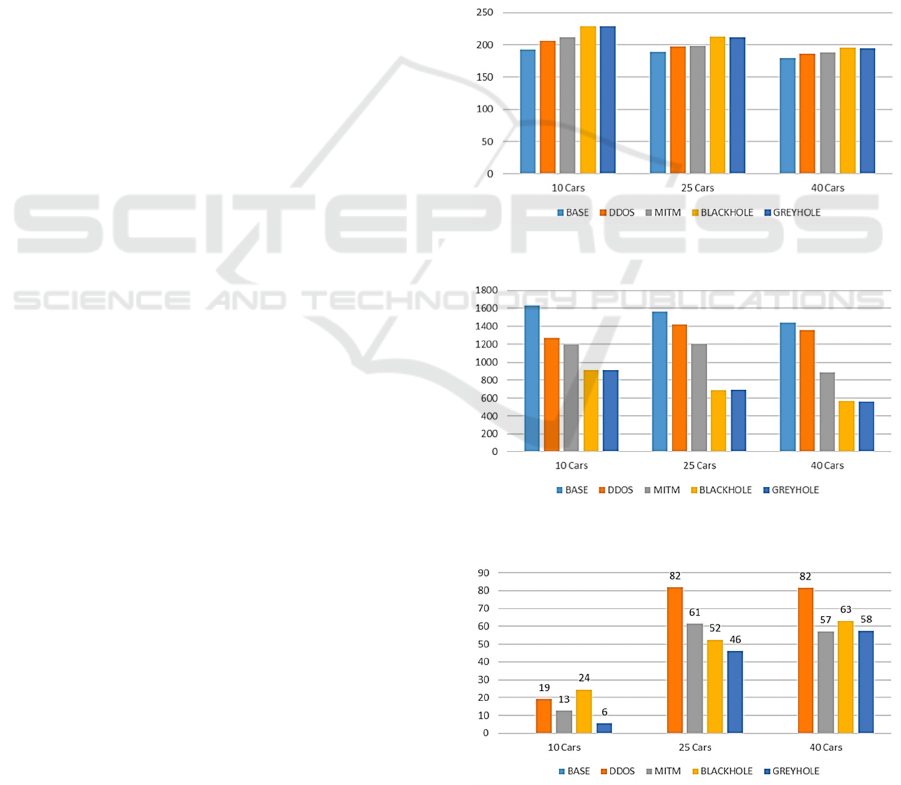
The main results are depicted in Figures 3 to 7,
contrasting the impacts of different attacks against
simulation scenarios involving different numbers of
vehicles. Figure 3 illustrates the average simulation
time and indicates (as expected) that any of the attack
scenarios serve to increase this over the time taken to
run the base simulations of the attack-free scenarios.
When looking at overall performance, it is evident
that the attacks have a considerable impact on the
travel time of vehicles (see Figure 4). All of the
attacks have delayed the time taken by vehicles to
reach the destination when compared to the base
scenario. DDoS and MITM attacks have similar
impact levels, whereas the travel delay caused by
Blackhole and Grayhole attack is high in all three
scenarios. Hence the network suffers maximum delay
due to Blackhole and Grayhole attacks.
The number of cars also influences the delay,
which is inversely proportional to the vehicle density
in the network. When the number of vehicles
increases, the time it takes to reach the destination
decreases. This is the advantage of the CAVs network
over the traditional transportation system. In the real
world, when the number of cars increases, it leads to
congestion. However, the increased number of nodes
increases the possibility of messages being delivered
to receivers, increasing dynamic routing efficiency.
Packet loss affects the efficiency of the network
(see Figure 5). The packet loss was not significantly
affected at 10 cars compared to 25 and 40 car
networks. The node density is directly proportional to
the packet loss ratio during security attacks. The
DDoS attack has produced maximum damage to the
network, with almost 30% more loss than all the other
attacks. The attack was targeted to crash the network
affecting the availability of resources, which is
evident from these results. Hence, DDoS gets a high
impact score and severely damages network
efficiency. The patterns of other attacks fluctuate for
each scenario, with similar percentages of packet loss.
Unsurprisingly, DDoS was also the most
impactful attack in causing network latency (see
Figure 6). The busy network time for MITM,
Blackhole and Grayhole is almost the same as the
base scenario. Therefore, these attacks do not target
the network's resources, so their impact here is low.
All the cars reached the destination in the base
scenario, so the number of unfinished cars count
value here is 0 and is therefore not visible in the graph
(Figure 7). Meanwhile, the unfinished cars count
during the attacks is directly proportional to the
number of cars in the network. It steadily increases
from 10 cars to 40 cars. Blackhole and Grayhole
achieved 100% results with maximum impact on the
network. However, this seems unrealistic for a real
life outcome and hence these results are set aside as a
limitations of the simulation software.
Figure 3: Average Simulation Time (seconds).
Figure 4: Average Distance Travelled (metres).
Figure 5: Packet Loss Ratio (%).
ICISSP 2023 - 9th International Conference on Information Systems Security and Privacy
780
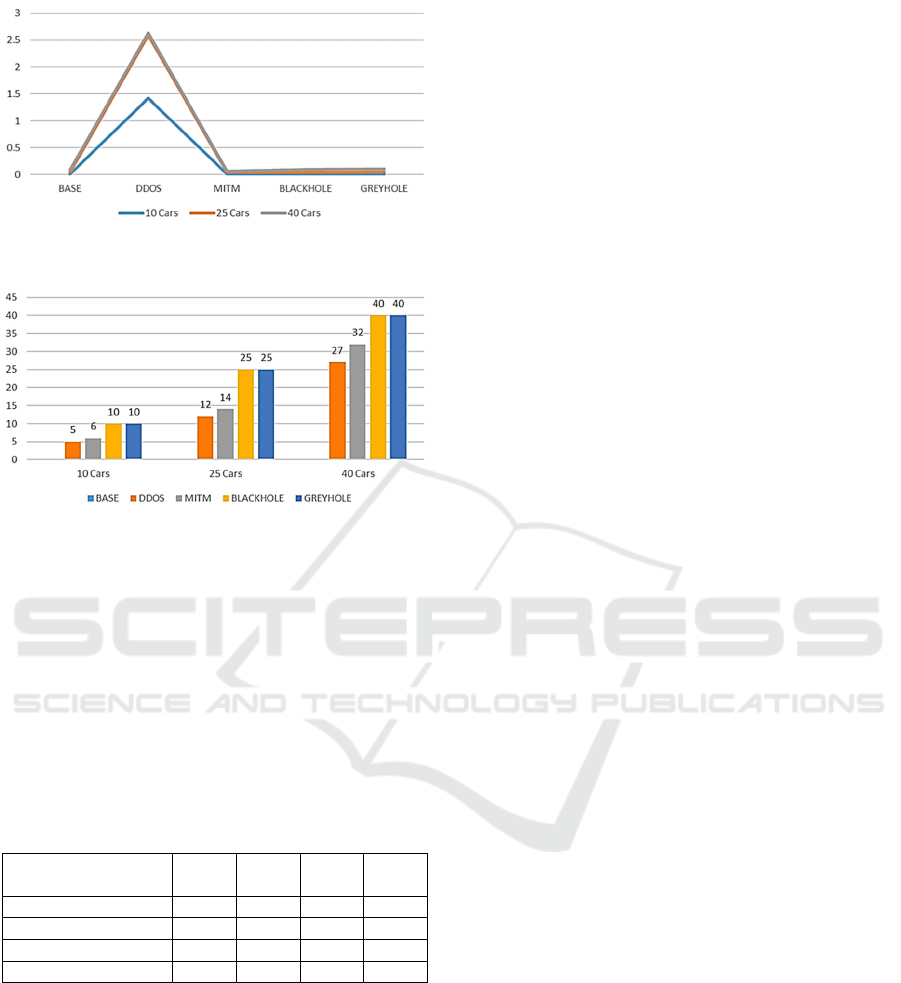
Figure 6: Network Busy Time (seconds).
Figure 7: Unfinished Cars Count.
The unfinished cars determine the overall
efficiency of the network in terms of transportation
and safety. Hence it can be considered to have direct
relationship with efficiency of the CAV network. It
can be observed that the MITM attack has more
unfinished cars than DDoS, and so concluded that
MITM is more severe and dangerous for CAVs.
Table 5 summarises the impacts of the different
attack types on the overall operation of the CAV
network.
Table 5: Summary of impacts from different attacks.
DDoS MITM
Black
hole
Gray
hole
Transportation Dela
y
Low Me
d
High High
Packet Loss Ratio Hi
g
hMe
d
Me
d
Me
d
Network Latenc
y
Hi
g
h Low Low Low
Unfinished Vehicles Hi
g
hHi
g
h N/A N/A
MITM attack has the maximum impact on the
safety and transportation efficiency as it disrupts the
rerouting algorithm with tampered messages. The
more MITM attackers the more processing delay of
the network in dynamic rerouting. The risk level of
MITM is high as it directly affects safety. DDoS is
medium as it only affects the emergency services due
to unavailability of the network whereas MITM leads
to further collisions and long halts. Blackhole is low
as it can be easily detected. Grayhole is medium due
to its evasive nature. The number of attackers does
not influence the impact inflicted by DDoS,
Blackhole and Grayhole attack as they all produced
identical results. It only influenced the impact for
MITM attack. DDoS attack consumes maximum
network resources, where the usage for other attacks
remained on par with the base scenario. DDoS also
produced the maximum packet loss. Finally, the CAV
network suffers maximum transportation delay due to
Blackhole and Grayhole attacks
6 CONCLUSIONS
The success of CAVs clearly depends upon trust in
the technology. This will only build based on the
safety and reliability of the transportation services
provided. Hence it is important to focus on building
systems that are resilient to attacks that seek to exploit
the network and communications infrastructure.
This study is a steppingstone for safer future
transportation. Four types of attacks were modeled,
and their impact quantified for safety, network and
transportation efficiency. MITM is identified as the
most severe attack with high risk of affecting the
safety operations. More focus should be given to the
network rerouting algorithm, which is identified as
the most vulnerable feature of CAV by the attacks.
REFERENCES
Ahmad, F., Adnane, A., Franqueira, V., Kurugollu, F. and
Liu, L., 2018a. Man-In-The-Middle Attacks in
Vehicular Ad-Hoc Networks: Evaluating the Impact of
Attackers’ Strategies. Sensors, 18(11), p.4040.
Ahmad, F., Franqueira, V.N.L. and Adnane, A. 2018b.
TEAM: A Trust Evaluation and Management
Framework in Context-Enabled Vehicular Ad-Hoc
Networks, IEEE Access, vol. 6, pp.28643-28660, doi:
10.1109/ACCESS.2018.2837887.
Arena, F., Pau, G. and Severino, A., 2020. A Review on
IEEE 802.11p for Intelligent Transportation Systems.
Journal of Sensor and Actuator Networks, 9(2), p.22.
Ekedebe, N., Yu, W., Song, H. and Lu, C., 2015. On a
simulation study of cyber attacks on vehicle-to-
infrastructure communication (V2I) in Intelligent
Transportation System (ITS). Proc. SPIE 9497, Mobile
Multimedia/Image Processing, Security, and
Applications. https://doi.org/10.1117/12.2177465
Garip, M.T., Gursoy, M.E., Reiher, P. and Gerla, M., 2015.
Congestion Attacks to Autonomous Cars Using
Vehicular Botnets. 2015 Network and Distributed
System Security Symposium, San Diego, 8-11 Feb.
Grover, J., Laxmi, V. and Gaur, M., 2013. Attack models
and infrastructure supported detection mechanisms for
Assessing the Impact of Attacks on Connected and Autonomous Vehicles in Vehicular Ad Hoc Networks
781

position forging attacks in vehicular ad hoc networks.
CSI Transactions on ICT, 1(3), pp.261-279.
Hamida, E., Noura, H. and Znaidi, W., 2015. Security of
Cooperative Intelligent Transport Systems: Standards,
Threats Analysis and Cryptographic Countermeasures.
Electronics, 4(3), pp.380-423.
Hasrouny, H., Samhat, A., Bassil, C. and Laouiti, A., 2017.
VANet security challenges and solutions: A survey.
Vehicular Communications, 7, pp.7-20.
Lopez, P., Wiessner, E., Behrisch, M., Bieker-Walz, L.,
Erdmann, J., Flotterod, Y., Hilbrich, R., Lucken, L.,
Rummel, J. and Wagner, P., 2018. Microscopic Traffic
Simulation using SUMO. 21st International
Conference on Intelligent Transportation Systems
(ITSC).
Milojevic, M. and Rakocevic, V., 2013. Distributed
vehicular traffic congestion detection algorithm for
urban environments. 2013 IEEE Vehicular Networking
Conference, Boston, MA, 16-18 December 2013.
Song, J., Wu, Y., Xu, Z. and Lin, X. 2014. Research on car-
following model based on SUMO. 7th
IEEE/International Conference on Advanced Infocomm
Technology.
ICISSP 2023 - 9th International Conference on Information Systems Security and Privacy
782
