
A Self-Configuration Controller To Detect, Identify, and Recover
Misconfiguration at IoT Edge Devices and Containerized Cluster System
Areeg Samir
a
and H
˚
avard Dagenborg
b
Department of Computer Science, UIT The Arctic University of Norway, Norway
Keywords:
Markov Decision Process, Hierarchical Hidden Markov Model, Self-Configuration, Detection, Recovery,
Misconfiguration, Performance, Threat, Edge Computing, Cluster, Containers, and Medical Devices.
Abstract:
Misconfiguration of IoT edge devices and containerized backend components can lead to various complica-
tions like performance degradation, non-compliant data flows, and external vulnerabilities. In this paper, we
propose a self-configurable cluster controller that uses the hierarchical hidden Markov model to detect, iden-
tify, and recover from misconfiguration at the container and network communication level. Our experimental
evaluations show that our controller can reduce the effects of misconfiguration and improves system perfor-
mance and reliability.
1 INTRODUCTION
Misconfiguration in edge devices and core backend
components can impact the workload and how data
flows within and across systems and services. This
might lead to ineffective resource utilization and per-
formance degradation or, more alarmingly, enable
unauthorized access. For critical systems like the ones
used in healthcare, avoiding misconfigurations is par-
ticularly important. For example, at the edge level,
a misconfiguration in the Conexus telemetry proto-
col (e.g., CVE-2019-6538) could affect the scores
of Medtronic and PolySomnoGraphy heart-rate mon-
itors and allow unauthorized changes to a patient’s
device. At the cluster level, misconfiguration (e.g.,
CVE-2019-5736, CVE-2022-0811) might occur due
to network rules, root/less privileged user access,
wrong pod label specifications, or forgetting to en-
force network policies after writing them. To address
these challenges in a shared multi-clustered environ-
ment, like those often found in healthcare, systems
need to manage the workload and the flow of infor-
mation from edge devices to the system and within
the system clusters.
Several recent works have looked at workload and
information-flow management (Moothedath et al.,
2020), (Kraus et al., 2021), (Sklavos et al., 2017),
(Luo et al., 2020), (M
¨
akitalo et al., 2018), (Guo et al.,
2019). However, more work is needed on correlating
a
https://orcid.org/0000-0003-4728-447X
b
https://orcid.org/0000-0002-1637-7262
the misconfiguration of medical edge devices and sys-
tem clusters to its observed performance degradation
and identifying its reasons for optimizing the system’s
information flow and performance.
In this paper, we propose a self-configurable con-
troller that detects, identifies, and recovers from mis-
configurations and limits their impact on the work-
load and faulty flow of information of edge devices
and container-based clusters. The proposed controller
is in accordance with the common misconfigurations
of Azure, Docker, and Kubernetes security reported
in 2022 by CVE, the National Institute of Standards
and Technology (NIST) NIST SP 800-190, OWASP
Container Security Verification Standards
1
, OWASP
Kubernetes Security Testing Guide
2
, and OWASP
A05:2021
3
– Security Misconfiguration. Our pro-
posed controller is based on Hierarchical Hidden
Markov Models (HHMMs) (Fine, 1998) and Markov
Decision Processes (MDPs) (Derman, 1970), which
are useful for modeling a wide range of security and
optimization problems. We used HHMMs to char-
acterize the dependency of misconfiguration in a hi-
erarchical structure by mapping the observed perfor-
mance anomalies to hidden resources and identifying
the root causes of the observed anomalies to improve
reliability. We chose MDP to determine the optimal
1
https://owasp.org/www-project-container-security-
verification-standard/
2
https://owasp.org/www-project-kubernetes-security-
testing-guide/
3
https://owasp.org/Top10/A05 2021-Security Misconf
iguration/
Samir, A. and Dagenborg, H.
A Self-Configuration Controller To Detect, Identify, and Recover Misconfiguration at IoT Edge Devices and Containerized Cluster System.
DOI: 10.5220/0011893700003405
In Proceedings of the 9th International Conference on Information Systems Security and Privacy (ICISSP 2023), pages 765-773
ISBN: 978-989-758-624-8; ISSN: 2184-4356
Copyright
c
2023 by SCITEPRESS – Science and Technology Publications, Lda. Under CC license (CC BY-NC-ND 4.0)
765
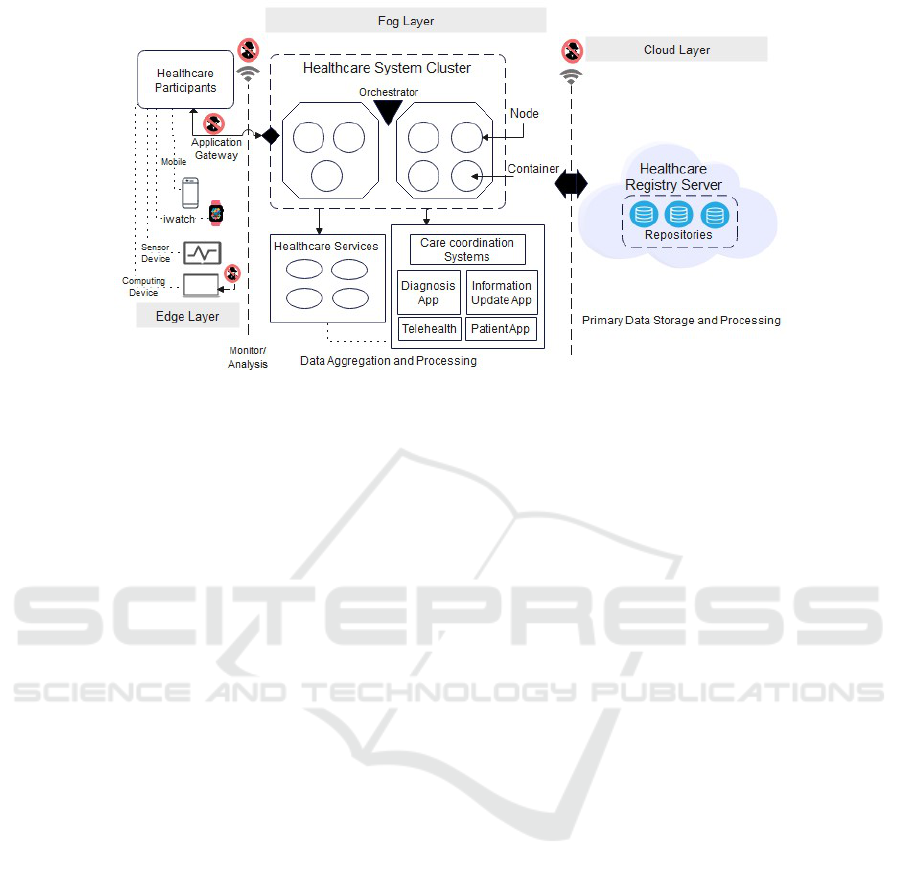
Figure 1: An example of a multi-cluster architecture for edge-based fog/cloud computing typically found in the healthcare
industry.
recovery policy as the performance of running med-
ical edge devices and the system’s containers-based
clusters at a particular time instant is uncertain, and
the model is memoryless. The controller adapted the
Monitor, Analysis, Plane, Execute, and Knowledge
(MAPE-K) adaptive control to optimize the control
over the system under observation.
2 MAPPING FAILURES TO
FAULTS
To analyze and classify the various misconfiguration,
failures, and faults, we use the ISO-27001 risk man-
agement framework. As a use case for our discus-
sions, we consider the multi-cluster environment of
modern medical organizations consisting of various
IoT devices and containerized services organized in a
fog-like architecture, as illustrated in Figure 1. We
focused on the most common security issues and
technical concerns for IoT edge devices, especially
medical heart-rate devices and container-based clus-
ters reported in literature studies and in the indus-
try, like Azure, Kubernetes, and Docker. We targeted
the data transmission and the configuration connec-
tivity of IoT edge medical devices to/from the sys-
tem. We consider a failure as the inability of any
such system component to perform its functions in ac-
cordance with specified requirements, both functional
and non-functional (e.g., performance). Faults are
system properties that describe an exceptional condi-
tion occurring in the system operation that may cause
one or more failures (IEEE Standard Classification,
2009). For instance, if the application gateway in Fig-
ure 1 has a fault, it may redirect edge-device traffic to
the wrong healthcare system cluster node or be used
to stage malicious activities (Jin et al., 2022).
Threats are malicious actions or interactions with
the system or its environment that can result in a fault
and, thereby, possibly in a failure (ISO/IEC/IEEE
15026, 2019). Any abnormal flow of information oc-
curring during an execution of a component is consid-
ered a fault or anomaly. Such faults can occur due to
a misconfiguration. Such abnormal flows character-
ized stealthy threat strategies conditioned on the sys-
tem model, while normal flows defined active defense
strategies, which enabled misconfiguration detection.
Observed failures were analyzed along three di-
mensions: risk identification (observed behavior),
risk assessment, risk treatment (recovery), and risk
severity (in percentage) relating to the system perfor-
mance in terms of the objectives that were not met by
the observed metrics and benchmarks. We used Key
Performance Indicators (KPIs) to determine whether
the motoring metrics met the maintenance goals and
the system’s performance (e.g., resource utilization,
latency, response time, network congestion, through-
put). The higher the value, the more severe impact on
the system’s performance will be.
Sudden Stop of Edge Device. Risk Identification:
the edge device, after running successfully, stopped
for a specific period (e.g., a minute). In such a case,
the logs indicated that the device failed to connect
to the IoT hub over AMQP and WebSocket, and the
edge device existed. Risk Assessment: a host network
misconfiguration prevented the IoT edge agent from
reaching the network. The agent attempted to con-
nect over AMQP (port 5671) and WebSockets (port
ICISSP 2023 - 9th International Conference on Information Systems Security and Privacy
766

443) as the edge device runtime set up a network for
each module to communicate, either using a bridge
network or NAT. Risk Treatment: protect the IoT Hub
resources against attack by reconfiguring network-
related resources (e.g., firewall configuration). Risk
Severity: 70%. Risk Type: Conf
1
.
Spike Traffic Received by System. Risk Identifica-
tion: system services are not working properly, its re-
sources are excessively saturated Risk Assessment: a
Distributed Denial of Service attack (DDOS) prevents
access to the system’s network. Risk Treatment: se-
cure the routing protocol and enforce policy on the
traffic entering or leaving the system’s default net-
work namespace. Risk Severity: 98%∼99%. Risk
Type: Conf
2
.
Connectivity Error. Risk Identification: IoT Edge
modules that connect to cloud services, including the
runtime modules, stop working and return network
failure. Risk Assessment: IP packet forwarding is dis-
abled, and modules connected to cloud services aren’t
working. Risk Treatment: enable IP packet forward-
ing, specify multiple DNS servers and public DNS
server in case the device cannot reach any of the IP ad-
dresses specified, and check port configuration rules.
Restart the network service and docker service. Risk
Severity: 99%. Risk Type: Conf
3
.
Empty Configuration File. Risk Identification: the
device has trouble starting modules defined in the de-
ployment. Only the edge agent is running but continu-
ally reporting empty configuration files. Risk Assess-
ment: the device may be having trouble with DNS
server name resolution within the private network.
Risk Treatment: specify the DNS server in container
engine settings, and restart the container. Risk Sever-
ity: 20%∼30%. Risk Type: Conf
4
.
Edge Hub Failure. Risk Identification: the edge
Hub module fails to start. Risk Assessment: some
process on the host machine has bound a port that the
edge Hub module is trying to bind. The IoT Edge hub
maps ports 443, 5671, and 8883 for use in gateway
scenarios. The module fails to start if another process
has already bound one of those ports. Risk Treatment:
stop the process using the impacted ports or change
the create options in a deployment file. Risk Severity:
20%∼30%. Risk Type: Conf
5
.
Unable to Access Module Image. Risk Identifica-
tion: the edge agent logs show a 403 error as a con-
tainer fails to run. Risk Assessment: the IoT edge
agent doesn’t have permission to access a module’s
image as registry credentials are incorrectly specified.
Risk Treatment: reconfigure the credentials of a con-
tainer registry. Risk Severity: 20%∼30%. Risk Type:
Conf
6
.
Unable to Access Registry. Risk Identification: the
edge device voltage increased and decreased, which
generated errors as the attack gained root privileges.
Risk Assessment: the IoT edge agent doesn’t have
permission to access a module’s image, as registry
credentials are incorrectly specified. Risk Treatment:
reconfigure the credentials for accessing the registry.
Specify the correct name of the registry. Risk Sever-
ity: 40%∼70%. Risk Type: Conf
7
.
Data Leakage. Risk Identification: sensitive med-
ical data was leaked. Risk Assessment: deploying
high-sophisticated malware leading to the theft of
sensitive medical data involving compromising sen-
sitive medical information. Risk Treatment: recover
weak passwords and misconfigured endpoints. En-
hance data encryption. Risk Severity: 40%∼70%.
Risk Type: Conf
8
.
Privilege Escalation Flaw. Risk Identification:
sensitive medical data was leaked. Risk Assessment:
a docker Engine function option (e.g., users-remap)
gives access to remapped root and allows privilege
escalation to the root level. Risk Treatment: con-
figure user namespace remapping. Risk Severity:
80%∼90%. Risk Type: Conf
9
.
Privilege Escalation Flaw and Redeployment Fail.
Risk Identification: sensitive medical data were
leaked. Risk Assessment: an Azure function
(e.g., SCM RUN FROM PACKAGE) gave access to
remapped root and allowed privilege escalation to the
root level. Risk Treatment: function configuration
(e.g., SAS token) and redeployment. Risk Severity:
80%∼90%. Risk Type: Conf
10
.
3 SELF-CONFIGURATION
CONTROLLER
In this section, we described our controller, which
consists of (1) Monitoring that collected the perfor-
mance data of such as CPU, memory, and network
metrics; (2) Detection and Identification that detected
misconfiguration and identifies its type; (3) Recovery
that selected the optimal recovery policy.
3.1 Monitor System Under Observation
We checked the normality of flow and workload for
the components under observation by utilizing spear-
man’s rank correlation coefficient to estimate the dis-
sociation between the emitted observations (failures)
and the amount of flow. To achieve that, we wrote an
A Self-Configuration Controller To Detect, Identify, and Recover Misconfiguration at IoT Edge Devices and Containerized Cluster System
767

algorithm to be used as a general threshold to high-
light the occurrence of abnormal flow in the man-
aged components (more details, see (Samir and Pahl,
2019)). The controller checked the configuration set-
tings against the benchmarks of Azure Security, CIS
Docker, and Kubernetes. For any mismatch between
the settings and the requirements of secure deploy-
ment in components, the controller reevaluates the de-
ployment of the impacted component, applies the re-
quired configuration, and redeploys the component.
Otherwise, the controller proceeds with the deploy-
ment.
3.2 Misconfiguration Detection and
Identification
The Hierarchical Hidden Markov Model (HHMM)
is a generalization of the Hidden Markov Model
(HMM), where the states that are hidden from the ob-
server might emit visible observation sequences that
constitute observation space.
The system under observation has a hierarchical
structure, and it consists of one or more clusters Cl
j=1
root state that has an internal state N
j=2
i
(node) with
horizontal transition i (states at the same level), and
vertical transition j (sub-state). The sub-state C
j+1
i
represents containers (e.g., C
3
1
at vertical level 3 and
horizontal level 1), and the production state S
j
i
rep-
resents services that emit Observation Space OS
n
=
{L
CPU
, L
Memory
, ···, L
Responsetime
} that is associated to
the computing resources saturation L
CPU
. The State
Space SP is mapped to Cluster Space ClS, which con-
sists of a set of Ns, containers C, and services S. The
edge direction indicates the information flow between
states.
The model vertically calls one of its sub-states
N
2
1
= {C
3
1
, C
3
2
}, N
2
2
, N
2
3
= {C
3
3
, C
3
4
} with “vertical
transition χ ” and j index (superscript), where j =
{1, 2, 3}. Since node N
2
1
is the abstract state, it
enters its child HMM sub-states containers C
3
1
and
C
3
2
. (C
3
1
, C
3
2
, C
3
3
), and C
3
4
have deployed services
S
4
1
, S
4
2
, S
4
3
, S
4
4
respectively. Since (S
4
1
, ···, S
4
4
) are pro-
duction states, they emit observations and may make
the horizontal transition with horizontal index i (sub-
script), where i = {1, 2, 3, 4}, from S
4
1
to S
4
4
. Once
there is no other transition, S
4
2
transits to the end state
S
4
eCid
, which ends the transition for this sub-state, to
return the control to the calling state C
3
2
. Once the
control returns to the state C
3
2
, it makes a horizontal
transition (if it exists) to state C
3
1
. Once the horizon-
tal transition finishes, the transition goes to the End
state C
3
eNid
to make a vertical transition to State N
2
1
.
Once all the transitions under this node are achieved,
the control returns to N
2
3
. The observation O
n
refers to
the failures observations sequence (high CPU utiliza-
tion, slow network traffic, and slow response time),
which might reflect workload fluctuation. This fluc-
tuation is associated with a probability that reflects
the state transition status from AF (Abnormal Flow)
to NL (Normal Flow) at a failure rate ℜ, which indi-
cates the number of failures for a S, C, N, or Cl over
a period of time. We used the Baum-Welch algorithm
to train the model by calculating the probabilities of
the model parameters. The algorithm’s output is used
to train the Viterbi algorithm to find the abnormal in-
formation flow path of the detected states under mis-
configuration. Once all the recursive transitions are
finished, we obtained a hierarchy of abnormal flow
path AF
seq
= {Cl, N
2
2
, N
2
3
, C
3
3
, S
4
3
} that is affected by
the component under misconfiguration (N
2
2
).
The model’s output is used to identify the type
of misconfiguration (hidden states) given the obser-
vation (observed failures) emitted from the system
components. The observations are compared with the
risk severity to infer the misconfiguration type. For
each misconfiguration, we initialized the model states
Con f
i j
and observations F
{1,···,T }
parameters through
a misconfiguration state graph length Con f Leng and
observations of length T . The probability of oc-
currence Con f
i j
was calculated assuming that the
misconfiguration started at the initial state Con f
1
.
The probabilities of Con f
i j
and observations F
{1,···,T }
were stored in matrix Con f Mat[Con f Leng, T ]. We
computed the F probability by summing the previ-
ous forward path probability from the previous time
step t − 1 weighted by their transition probabilities
Con f prob
Con f
′
,Con f
, and multiplied by the observa-
tion probability F prob
Con f
(F
t
). We sum over the
probabilities of all possible hidden misconfiguration
(Con f
i j
, ···, Con f
N j
) that could generate the obser-
vation sequence F
{1,t+1,···,T }
. Each Con f represented
the probability of being in Con f
j
after seeing the first
F
t
observations. In case of a misconfiguration, we
checked its type (Con f
1
, Con f
2
, Con f
3
, Con f
n
) con-
sidering the Risk Type for that state; otherwise, the
model returns to check the next state. The model re-
sults were stored in Knowledge storage to enhance the
future of detection.
We focused on the most common misconfigura-
tion types reported about the edge cluster and cloud
layer according to National Vulnerability Database,
Cybersecurity & Infrastructure Security Agency,
Common Attack Pattern Enumeration and Classifi-
cation, OWASP Top 10 Security Risks, ENISA Top
15 Threats, and AT&T Cybersecurity. To enhance
the identification process, we created pre-defined mis-
configuration description profiles with common mis-
ICISSP 2023 - 9th International Conference on Information Systems Security and Privacy
768

configuration types and stored them in the knowledge
storage.
We extended HHMM with controlling labels
made up of tags, each of which stands for a certain
integrity issue (such as private data) and outlines the
information flow permitted. Thus, a tag model is de-
fined to deliver a policy formulation.
We further created an information access con-
trol list to control the access to the system compo-
nents. The list identified a set of access variables for
each participant, such as roles, actions, access to the
API, authorizations they hold, permissions, permis-
sion boundaries, and conditions.
The permission boundary defines the maximum
permissions granted to participants and roles by utiliz-
ing an enumeration-type action with two values (true
and false). If the action of permission is true, then the
permission is allowed; otherwise, it is rejected. More-
over, we assumed that if no information flow policy is
specified in the domain, the inbound and the outbound
flow will be set if the policy has any outbound rules.
The policies in the observed system do not conflict as
they are addictive.
3.3 Misconfiguration Recovery
We used the MDP to model the recovery as a set of
states (identified misconfiguration type) and actions
that can be performed to control the system’s behavior
through an agent. The agent interacted with the envi-
ronment by choosing the optimal actions to maximize
a long-term measure of total reward without knowing
about past situations.
The agent at state St
t
chose an action A
t
from the
action space AS, (A
t
∈ A(S
t
)), where A(St
t
) was the
set of actions (a
1
, ···, a
n
) (Risk Treatment) available
in state St
t
at time t. Here, the a
1
denoted that the
system’s component (containers deployed services)
is terminated when a container escapes vulnerability
and allows an attacker to obtain host root access. The
a
2
denoted that the system’s component is reconfig-
ured and redeployed. Here, the affected configuration
is updated and redeployed. The a
3
denoted that the
system’s component was reconfigured and the whole
cluster was restarted. The a
4
denoted that no ac-
tion was applied because the status of the component
couldn’t be obtained. Depending on the action taken,
the starting state, and the subsequent state P
A
S
, the
agent receives a numerical reward R
t+1
∈ ℜ ⊂ R to
maximize the reward (performance). Then, the sys-
tem returns a new state St
t+1
from the state space SP
at time t.
The state space includes three possible situations,
1) the state is at the initial status (misconfigured) St
Int
,
2) successful recovery St
SR
, 3) the recovery fail St
RF
,
and 4) recovered state St
R
. Hence, if the state is St
Int
,
then one recovery action from the actions in AS is ap-
plied. If the action is applied successfully, the state
transits to St
SR
, which indicates the success of recov-
ery. Here, the state is marked as recovered St
R
other-
wise, the state turns to St
RF
, and another action is ap-
plied to recover the state P : S × S × A 7 −→ [0, 1] until
the state is recovered with the probability of transition
P(St1, St2, A1) = 1 from state St1 to state St2 upon
using action A1. If the recovery isn’t applied suc-
cessfully, the state is marked as non-recovered with a
probability of failure P(St1, St2, A1) = F, and a con-
stant failure rate FR, which results in an exponential
failure distribution as shown in (1).
The reward could be a set of possible rewards with
a reward probability R
A
S
: (1) positive value, which
refers to a successfully applied recovery action that
enhanced the observed metrics. (2) negative value
refers to non-successful applied recovery action that
declined the observed metrics. The reward function
R represents the gain for using action A1 in state S
as R : S × A 7 −→ R. The gain of the reward is de-
termined by defining the performance function based
on the action chosen at each time slot t, denoted by
PerSC
t
= Q
SC
. The Q
SC
denoted the system’s com-
ponent performance at t, and Q
ED
denoted the edge
device’s performance at t. The greater the value of
Q, the better a chosen action for a state with a policy
π. To control the importance of immediate and future
rewards for each state, we used a discount factor of D
to maximize the cumulative reward we got from each
state.
F
(t)
= FR × exp
−FR(t+t
′
)
(1)
The controller stops the iteration as soon as there
is no more policy enhancement. We enhanced the
controller performance during the selection process
of the optimal policy as shown in (2) by taking the
best action over all actions considering the converge
of the expected return sequence upsilon
w
and the op-
timal returned policy upsilon
optimal
, ∀s ∈ S.
υ
w+1
(s) = max
a
∑
s
′
,r
p(s
′
, r|s, a) × [ευ
w
(s
′
) + r]
(2)
4 EVALUATION
To evaluate the controller, we ran several experiments.
Our setup consisted of three VM instances (2 VM for
the heart rate monitor application and 1 VM for the
controller). Each VM is equipped with 3 VCPUs and
2 GB VRAM; and runs Ubuntu 22.10 and Xen 4.11.
A Self-Configuration Controller To Detect, Identify, and Recover Misconfiguration at IoT Edge Devices and Containerized Cluster System
769

Agents are installed on each VM to collect and trans-
fer monitoring data for external storage and process-
ing. The VMs are connected through a 100 Mbps
network. For each VM, we deployed three contain-
ers. A K8s cluster, consisting of one master node and
three worker nodes, was deployed using Kubeadm,
running K8s version 1.19.2. All nodes have 4 VC-
PUs and 8GB RAM, and all were deployed on the
same machine to eliminate variations in network de-
lay. We created 30 namespaces, each with 4 microser-
vices (pods) used for performance measurements, and
assigned the same number of network policies. The
number of created policies was 900, which were or-
dered, managed, and evaluated.
4.1 Data Collection and System
Monitoring
The installed agents collect data about CPU, Mem-
ory, Network, filesystem changes, information flow
(i.e., no. of flows issued to component), patient health
information, device operation status, the device id,
and service status from the system components. The
agents exposed log files of system components to
the storage to be used in the analysis. Edge devices
with similar functionality are grouped and allocated
to a respective group (pool of heart monitor edge de-
vices). We used the Datadog tool to obtain a live data
stream for the running components and to capture the
request-response tuples and associated metadata. The
collected data are grouped and stored in a time series
database. We used the ”Logman” command in Ku-
bernetes and Docker to trace remote procedure call
(RPC) events to forward container logs as event trac-
ing in the window. The gathered data are stored in
real-time/historical storage to enhance future detec-
tion.
The dataset is divided into a 50% training set and
50% testing set. We used NNM iSPI Performance to
collect data about the information flow from the sys-
tem under observation (e.g., device id, device type,
max/mean/min size of the packet sent, total packets,
max/mean/min amount of time of active flow, dura-
tion of flow). We stored the configuration files of
the components in the GitOps version control to sim-
plify the rollback of configuration change. We wrote
our configuration files using YAML. We managed the
configurations, deployments, and dependencies using
kubectl and Skaffold.
After training the models on the gathered data,
we noticed at the cluster level a sudden increase in
request latency and the request rate falling, which
caused excessive consumption of resource usage
(CPU, memory, network). This occurred because of
Table 1: Detection Evaluation.
Metrics HHMM CRFs DBMs
RMSE 0.2003 0.4860 0.2600
PFD 0.3065 0.3976 0.3948
Recall 94.49% 91.69% 93.62%
Accuracy 93% 92% 92%
the deployment of the incorrectly configured version
(pod replacement) that allows root access to the host
as the privileged and hostPID were true. Moreover, a
critical improper access control occurred at the edge
level due to no encryption to secure the communica-
tion protocol, and the protocol lacks authentication
for legitimate devices.
4.2 The Detection Assessment
The performance of the detection model is evaluated
by Root Mean Square Error (RMSE) and Probabil-
ity of False Detection (PFD), which are the com-
monly used metrics for evaluating detection accuracy.
The RMSE measures the differences between the de-
tected value and the observed one by the model. A
smaller RMSE value indicates a more effective detec-
tion scheme. The PFD measures the number of the
normally detected component which has been miss-
detected as anomalous by the model. A smaller PFD
value indicates a more effective detection scheme.
The efficiency of the model is compared with Con-
ditional Random Fields (CRFs) and Deep Boltzmann
Machines (DBMs); see Table 1. We noticed that
the computation of CRFs is harder than the HHMM.
The results show that the performance of the pro-
posed detection is better than the CRF, as it correctly
identified true positives (TP) of abnormal flow and
misconfiguration with 94% recall and 93% accuracy.
The DBMs achieved promising results; however, the
learning procedure was too slow.
4.3 The Recovery Assessment
This section evaluates the controller by measuring the
reliability of recovery, deployment, and performance
of the controller. We used Mean Time to Recovery
(MTTR) to measure the average time the recovery
process takes to recover a component after observing
a failure on the monitored metrics. The failures refer
to a component that cannot meet its expected perfor-
mance metrics. A higher MTTR indicates the exis-
tence of inefficiencies within the recovery process or
the component itself. We conducted two scenarios.
The first one corresponds to the selection of the opti-
mal policy. The second relates to selecting a random
policy, where the agent randomly selects one or more
ICISSP 2023 - 9th International Conference on Information Systems Security and Privacy
770

actions with uniform distribution. For each scenario,
we aimed to assess the average time the recovery pro-
cess took to recover a container and an edge device.
In the first scenario, the MTTR for the edge device
was 20 s, and the MTTR to recover the container was
approximately 43 s with a grace period of 80 s (default
30 s in Kubernetes) for service image size (110 MB)
with service image number 30. For the second sce-
nario, the MTTR for the edge device was 53 s, and
the MTTR to recover the container was roughly 71
seconds under the same settings. We noticed that the
container and the edge device function normally after
that interval in both scenarios regarding the assigned
rewards. The result of the first scenario led to a sig-
nificantly short recovery time as the average achieved
rewards through the optimal policy were remarkably
higher than the random policy. Moreover, we found
that for some actions, such as function configura-
tion and configuring user namespace remapping, the
more rewards are assigned during the recovery pro-
cess, the average time decreases as the detection time
is short, demonstrating a significant difference in the
controller performance. However, to recover from
failure efficiently, the average recovery time increased
when the failure rate increased.
We measured the Overall Accuracy of Recovery
(OAR). The OAR measures the average rate of suc-
cessfully recovered components to the total number of
failures emitted by all components. When computed
over multiple runs, the OAR was around 97.66%,
which means that the trained recovery policy could
not handle a small number of failures. The accuracy
was still more than 96%, though the unhandled fail-
ures decreased dramatically with more training data.
We verified the ability of the controller using a
long time-span dataset (from 1 July 2021 to 1 Novem-
ber 2022). For some misconfiguration types (e.g.,
CVE-2019-5736, CVE-2022-0811, CVE-2019-6538,
CVE-2021-21284, CVE-2019-9946, and CVE-2020-
10749), the trained recovery policy enhanced the
performance of the system resources. The results
show that the average amount of resource consump-
tion (CPU, memory, network), with no misconfig-
uration, was approximately the same, with respec-
tive values varying around 30%∼60% (normal behav-
ior). Resource consumption due to misconfiguration
increased and was over 98% (overloaded resources),
demonstrating the impact of improper configuration
on the system resources. The recovered misconfigu-
ration impacted the saturated resource as the values of
the monitored resources varied around 38.4%∼64.6%
(normal behavior). The controller performance was
almost the same, with a minor recovery time devi-
ation of around 100 seconds for some failure types,
like container privileged access and wrong pod label.
The deviation returned to the correlation with the fail-
ure in the system. Hence, we used the sequence of
failures occurring during the recovery process to re-
flect the type of failure, which represents the failures
that share the same observations corresponding to a
unique fault. If the container privileged access and
wrong pod label sequence of failures occurred, we fo-
cus on the container privileged access failure to rep-
resent its failure type and relate it to its fault, which is
Privilege Access Escalation Management. We choose
the initial failure that occurred as it is representative
enough of the observations to which it belongs, which
allows us to save the recovery time without trying
many recovery actions. We found that some failures
in the test set, such as CVE-2022-0811, are not cov-
ered by the training set, which might impact accuracy.
The result stated that the controller performed better
with the increase in the training dataset size.
5 RELATED WORK
Several studies have addressed workload and in-
formation flow management in dynamic environ-
ments. Sorkunlu (2017) identified system perfor-
mance anomalies by analyzing the correlations in the
resource usage data. Wang (2018) proposed a model-
based approach to correlate the workload and the re-
source utilization of applications to characterize the
system status. In the work of Moothedath et al.
(2020), an information-flow tracking model was de-
veloped for detecting suspicious flows in the system
and performing security analysis for unauthorized use
of data. A formal model that optimizes the runtime
performance of data-flow applications focusing on de-
tecting the latency variation in IoT is developed by
Luo et al. (2020).
Many literature studies have used Markov mod-
els and their derivations to detect anomalous behav-
ior. For instance, Sohal (2018) used Markov models
to categorize and identify malicious edge devices, and
Sukhwani (2014) implemented various techniques to
detect network anomalies and intrusions. Faults can
also be detected in real-time embedded systems by
describing the healthy and faulty states of a system’s
hardware components (Ge, 2015). In contrast, Borgi
(2018) proposed an intrusion-detection solution that
collects data at the system level. This solution track
information flows to find links between related and
unrelated attacks at the network level and to recog-
nize the reconstructed attack campaigns using HMM.
However, the previously mentioned literature
studies provided limited scope for dynamically in-
A Self-Configuration Controller To Detect, Identify, and Recover Misconfiguration at IoT Edge Devices and Containerized Cluster System
771

tegrating different policies to manage medical edge
devices’ and clusters’ configurations. In particu-
lar, existing frameworks have paid limited atten-
tion to the critical role of efficient recovery man-
agement (Alessandro, 2022), (CISKubernetes, 2022),
(Darryl, 2022), (Fairwinds, 2023), (Joe, 2022), (Kyle,
2020). Hence, this paper: (1) mapped the observed
performance degradation (failure) to its hidden abnor-
mal flow of information (fault) and misconfiguration
type (error) and (2) selected the optimal recovery pol-
icy with optimum actions to optimize the performance
of the system under observation.
6 CONCLUSIONS AND FUTURE
WORK
Securing workloads and information flow against
misconfiguration in container-based clusters and edge
medical devices is an important part of overall system
security. This paper presented a controller that ana-
lyzes the misconfiguration, maps the observation to
its hidden misconfiguration type, and selects the op-
timal recovery policy to maximize the performance
of defined metrics. In the future, we will integrate
streaming from different edge devices, expand the re-
covery mechanism, and conduct more experiments.
ACKNOWLEDGEMENT
This research was funded in part by The Research
Council of Norway under grant numbers 274451 and
263248.
REFERENCES
Moothedath, S., Sahabandu, D., Allen, J., Clark, A., Bush-
nell, L., Lee, W., and Poovendran, R. (2020). Dy-
namic Information Flow Tracking for Detection of
Advanced Persistent Threats: A Stochastic Game Ap-
proach. In arXiv:2006.12327.
Kraus, S., Schiavone, F., Pluzhnikova, A., and Invernizzi,
A. C. (2021). Digital Transformation in Healthcare:
Analyzing The Current State-of-Research. Journal of
Business Research, 123:557–567.
Sklavos, N., Zaharakis, I. D., Kameas, A., and Kalapodi, A.
(2017). Security & Trusted Devices in the Context of
Internet of Things (IoT). In The proceedings of 20th
EUROMICRO Conference on Digital System Design,
Architectures, Methods, Tools (DSD’17), pages 502–
509.
Luo, Y., Li, W., and Qiu, S. (2020). Anomaly Detec-
tion Based Latency-Aware Energy Consumption Opti-
mization For IoT Data-Flow Services. Sensors, 20:1–
20.
M
¨
akitalo, N., Ometov, A., Kannisto, J., Andreev, S., Kouch-
eryavy, Y., and Mikkonen, T. (2018). Safe and Se-
cure Execution at the Network Edge: A Framework
for Coordinating Cloud, Fog, and Edge. IEEE Soft-
ware, 35:30–37.
Guo, M., Li, L., and Guan, Q. (2019). Energy-Efficient and
Delay-Guaranteed Workload Allocation in IoT-Edge-
Cloud. IEEE Access, 7:78685–78697.
Fine, S., Singer, Y., and Tishby, N. (1998). The Hierarchical
Hidden Markov Model: Analysis and Applications.
Machine Learning, 32:41–62.
Derman, C. (1970). Finite State Markovian Decision Pro-
cesses. Academic Press, New York
Sorkunlu, N., Chandola, V., and Patra, A. (2017). Track-
ing System Behavior from Resource Usage Data. In
The proceedings of IEEE International Conference on
Cluster Computing (ICCC), pages 410–418.
Wang, T., Xu, J., Zhang, W., Gu, Z., and Zhong, H.
(2018). Self-Adaptive Cloud Monitoring with On-
line Anomaly Detection. Future Generation Com-
puter Systems, 80:89–101.
Sohal, A.S., Sandhu, R., Sood, S.K., and Chang, V. A.
(2018) Cybersecurity Framework to Identify Mali-
cious Edge Device in Fog Computing and Cloud-of-
Things Environments. Computer Security, 74:340–
354.
Sukhwani, H., Sharma, V., and Sharma, S. (2014). A Sur-
vey of Anomaly Detection Techniques and Hidden
Markov Model. International Journal of Computer
Applications, 93:975–8887.
Ge, N., Nakajima, S., and Pantel, M. (2015). Online Diag-
nosis of Accidental Faults for Real-Time Embedded
Systems Using a Hidden Markov Model. Simulation,
91:851–868.
Borgi, G. (2018). Real-Time Detection of Advanced Per-
sistent Threats Using Information Flow Tracking and
Hidden Markov. Doctoral Dissertation.
Alessandro, M. (2022). Nearly One Million Exposed
Misconfigured Kubernetes Instances Could Cause
Breaches. https://www.infosecurity-magazine.co
m/news/misconfigured-kubernetes-exposed/
CIS Kubernetes Benchmarks. (2022). Securing Kubernetes
An Objective, Consensus-Driven Security Guideline
For The Kubernetes Server Software. https://www.ci
security.org/benchmark/kubernetes
Darryl, T. (2022). ARMO: Misconfiguration Is Number 1
Kubernetes Security Risk. https://thenewstack.io/arm
o-misconfiguration-is-number-1-kubernetes-securit
y-risk/
Fairwinds. (2023). Kubernetes Configuration Benchmark
Report. https://www.fairwinds.com/kubernetes-con
fig-benchmark-report
Joe, P. (2020). Common Kubernetes Misconfiguration Vul-
nerabilities. https://www.fairwinds.com/blog/kuberne
tes-misconfigurations
Kyle, A. (2020). Major Vulnerability Found in Open Source
Dev Tool For Kubernetes. https://venturebeat.com/se
curity/major-vulnerability-found-in-open-source-dev
-tool-for-kubernetes/
ICISSP 2023 - 9th International Conference on Information Systems Security and Privacy
772

Jin, X., Katsis, C., Sang, F., Sun, J., Kundu, A., and Kom-
pella, R. (2022). Edge Security: Challenges and Is-
sues. In arXiv:2206.07164.
IEEE. (2009). IEEE Standard Classification for Software
Anomalies (IEEE 1044–2009). In IEEE Std 1044-
2009 (Revision of IEEE Std 1044-1993), 2010:1–23.
ISO. (2019). Systems and Software Engineering — Sys-
tems and Software Assurance — Part 1: Concepts and
Vocabulary (ISO/IEC/IEEE 15026-1:2019).
Samir, A. and Pahl, C. (2019). A Controller Architec-
ture For Anomaly Detection, Root Cause Analysis
and Self-Adaptation for Cluster Architectures. In The
Eleventh International Conference on Adaptive and
Self-Adaptive Systems and Applications (ADAPTIVE),
pages 75–83.
A Self-Configuration Controller To Detect, Identify, and Recover Misconfiguration at IoT Edge Devices and Containerized Cluster System
773
