
Ultra-Sensitivity Widefield, Confocal Surface Plasmon
Interferometry Using Sequential Coding
Suejit Pechprasarn
College of Biomedical Engineering, Rangsit University, Pathum Thani, Thailand
Keywords: Surface Plasmon Resonance, Confocal Microscope, Molecular Binding, Optical Instrumentation.
Abstract: Interferometry has been a standard technique for optical phase measurement. Most single-molecule sensitivity
measurements and imaging tools rely very much on the interferometric measurement of dual optical beams.
We have developed an embedded confocal interferometric microscope and demonstrated by theoretical
calculation that the system can achieve single molecule detection sensitivity. Of course, several challenges
need to be addressed to achieve such ultra-sensitivity. The confocal surface plasmon microscope is a beam
scanning system, and it also suffers from thermal variations due to long data acquisition time. Here we propose
a widefield quantitative confocal surface plasmon interferometric microscope configuration using orthogonal
coding. The proposed system sequentially illuminates a plasmonic sample with multiple focal points in the
sample plane based on an orthogonal code such as a Hadamard code. The images of the illumination sequences
are then captured and processed with the known Hadamard input sequence. Here we show that employing the
Hadamard time coding in the confocal surface plasmon interferometry enables us to (1) perform widefield
imaging, (2) higher signal-to-noise compared to the beam scanning system, (3) high sensitivity, (4) good
spatial resolution and (5) more stable compared to the confocal surface plasmon microscope.
1 INTRODUCTION
Doctors and biomedical scientists have been facing
more challenging diseases in these recent years.
Bacteria, germs, and viruses have become more
tolerant and resistant to chemicals and antibiotic
drugs (Boolchandani, D’Souza, & Dantas, 2019).
Fever and flu, such as COVID-19, have been severe
healthcare issues worldwide (Fricker Jr & Rigdon,
2018; Organization, 2020). Not only that, but there
are also symptoms and illnesses related to the aging
society; of course, one of the majority is
neurodegenerative diseases (Barnham, Masters, &
Bush, 2004), such as Alzheimer’s disease. The
number of patients diagnosed with the disease is
increasing yearly, and there is still no promising and
reliable early-stage diagnostic tool (Venazzi et al.,
2018). There is an increasing demand for highly
sensitive biosensors to tackle such situations and, of
course, for early-stage diagnosis of server illnesses.
From the literature review, the following are the
critical demands for next-generation diagnostic tools,
which can be summarized as:
1. In vitro imaging capability to understand the
physical interactions between cells, drugs, and
morphology of mutant bacteria or viruses (Xiao,
Parchur, Gilbertson, & Zhou, 2018).
2. Biosensing capability, besides imaging
capability ability to identify the presence of
genes or proteins, is also the key. This character
is where fluorescence labeling plays a crucial
role (Ounkomol, Seshamani, Maleckar,
Collman, & Johnson, 2018).
3. Highly sensitive, one of the hot topics in
biomedical sensors is single molecule detection
due to the high demand in the healthcare sector
(Zanchetta, Lanfranco, Giavazzi, Bellini, &
Buscaglia, 2017).
4. Quantitative imaging not only gives out imaging,
but it needs to be also able to perform a
quantitative measurement, such as showing
interaction strengths and binding kinetics
(Guerri et al., 2018).
5. High throughput screening different kinds of
binding arrays (Songa & Okonkwo, 2016).
6. Label-free, although fluorescence techniques
have their unique advantage, there are key issues
in those techniques, including photobleaching
and phototoxicity. They may also not represent
the natural behavior of the specimen due to the
96
Pechprasarn, S.
Ultra-Sensitivity Widefield, Confocal Surface Plasmon Interferometry Using Sequential Coding.
DOI: 10.5220/0011892300003408
In Proceedings of the 11th International Conference on Photonics, Optics and Laser Technology (PHOTOPTICS 2023), pages 96-101
ISBN: 978-989-758-632-3; ISSN: 2184-4364
Copyright
c
2023 by SCITEPRESS – Science and Technology Publications, Lda. Under CC license (CC BY-NC-ND 4.0)

perturbation of the considerable molecular
weight of the fluoresce dyne (Zanchetta et al.,
2017).
7. Automatic feedback control system and self-
calibration (Hameed, Alrayk, & Obayya, 2016),
for example, automatic z-control for long-period
imaging, reference channel in the measurement
of binding kinetics.
Scientists and engineers are trying to provide
feasible solutions to medical needs. One of the
promising candidates that have been of interest to the
science community and healthcare sensor
manufacturers is surface plasmon resonance (SPR).
SPR is a confined electromagnetic wave
propagating along the surface of noble metals, such
as gold (Au), silver (Ag), and copper (Cu). The SPR
is sensitive to molecules and substances that bind to
the metal surface and appears as the change in wave
vector k
sp
of the surface plasmons (SP) (Nguyen, Park,
Kang, & Kim, 2015). The SPR measurement is
carried out for biosensing applications using a
uniform layer of thin gold film 50nm thick coated on
a high refractive index prism or glass substrate. A p-
polarized light with sufficient light momentum
illuminates the gold sensor from the glass side, as
shown in Fig.1. The analyte and binding site are on
the other side of the gold, the so-called Kretschmann
configuration.
Figure 1: Kretschmann configuration.
No labeling agent is required in such
measurement, and the SPR measurement is a label-
free technique. A dark band dip appears on the
reflectance curve, as shown in Fig.1. This is evidence
of SPR coupling, as the presence of the dark band is
due to the SPR loss mechanisms in the SPR coupling
process (Pechprasarn, Chow, & Somekh, 2018).
When the analyte binds to the binding site, this dark
band dip moves to a higher wave vector position.
Since the SPR is an electromagnetic wave
propagation and, of course, phase detection is also
possible.
It has been very well established that phase
detection gives better sensitivity (Ho et al., 2006;
Huang, Ho, Kong, & Kabashin, 2012) due to the
sharper phase response of the phase curve compared
to the intensity measurement. However, it does
require an interferometric system.
The interferometric system usually requires well-
controlled experimental conditions, such as
temperature control and vibration isolation. This
paper will demonstrate how the proposed widefield,
confocal surface plasmon can overcome the
variations by employing time-coded illumination
using the Hadamard code. The Hadamard sequence is
an orthogonal sequence enabling a widefield,
confocal imaging capability.
2 MATERIALS AND METHODS
2.1 Optical Microscope Simulation
We address the issues of scanning confocal surface
plasmon interferometric system by employing a
rotating diffuser for incoherent illumination and a
digital micromirror device (DMD) as shown in Fig.2.
The DMD is for controlling the pattern of image plane
illumination using Hadamard sequence intensity
coding. The incoherent illumination ensures no
interference effect between any close point spread
functions.
Figure 2: Schematic diagram of SPR microscope with
digital micromirror device for image plane illumination
control.
An example of 64x64 Hadamard sequences is shown
in Fig.3. It is essential to point out that Hadamard
sequences are a series of orthogonal codes consisting
of -1 and 1. Each row of the Hadamard matrix can be
employed to code an individual pixel on the DMD
chip.
Ultra-Sensitivity Widefield, Confocal Surface Plasmon Interferometry Using Sequential Coding
97
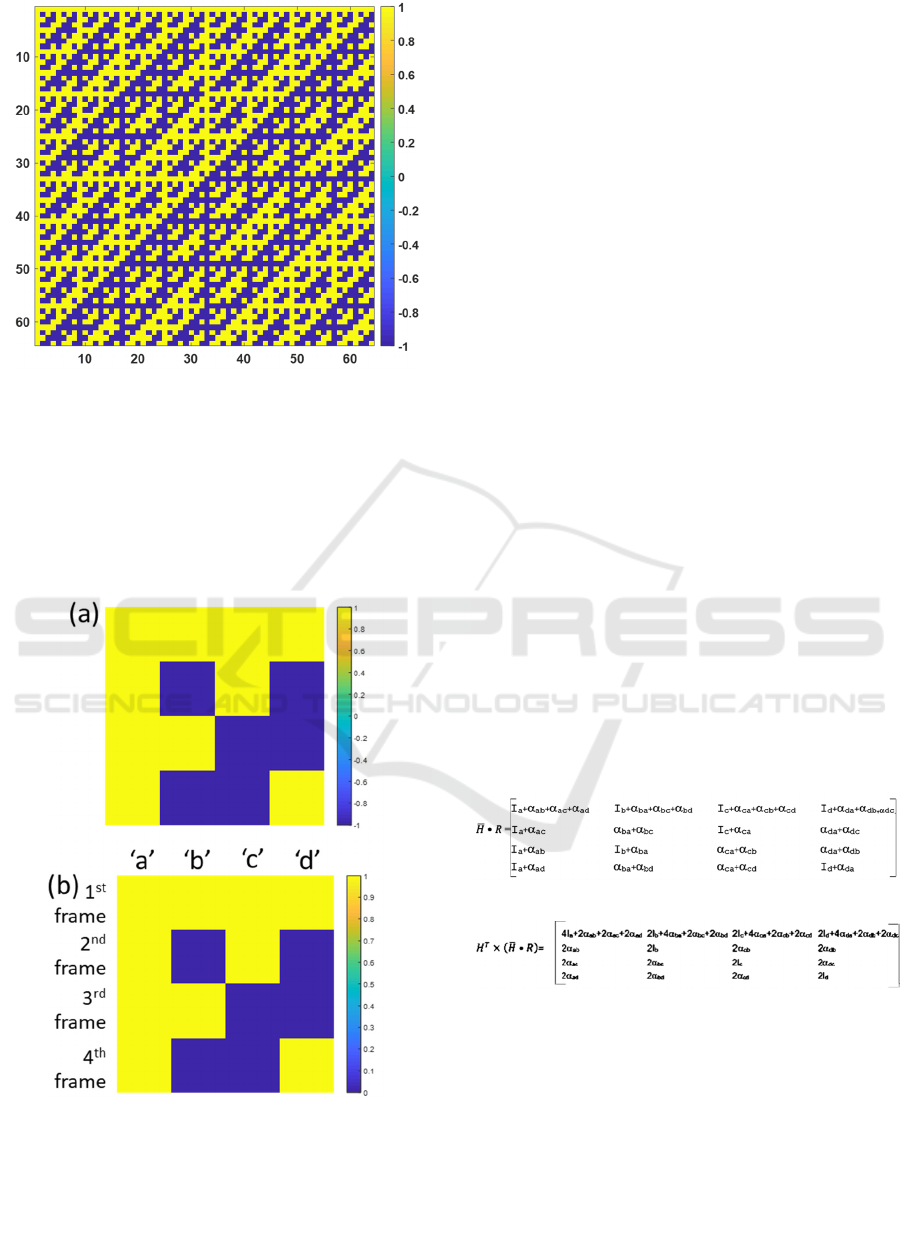
Figure 3: A 64x64 Hadamard matrix.
One significant difference between Hadamard’s
code and the optical illumination is that the camera in
the microscope system can only detect light intensity.
Therefore, the Hadamard code in this research is
adjusted to 0 and 1, as shown in Fig.3a here, called 𝐻
.
Moreover, the conventional Hadamard with -1 and 1
coding, as shown in Fig.3b, is called 𝐻.
Figure 4: Shows (a) the conventional Hadamard 𝐻 with -1
and 1 coding for a 4 by 4 matrix and (b) the adjusted
Hadamard 𝐻 with 0 and 1 coding for a 4 by 4 matrix.
To demonstrate the feasibility of the proposed
method, let us assume that we would like to measure
confocal responses of 4 measurement positions in the
image plane 𝐼
,𝐼
,𝐼
and 𝐼
, respectively. These 4
points in the image plane are separated by arbitrary
distances and directions leading to different crosstalk.
Let 𝛼
is the crosstalk from point ‘b’ leaking into
point’ a’. Therefore, there are 12 crosstalk terms
𝛼
,𝛼
, 𝛼
,𝛼
,𝛼
,𝛼
, 𝛼
,𝛼
, 𝛼
,𝛼
,𝛼
and 𝛼
for the 4 points.
An essential property of the orthogonal matrix is that:
𝐻
𝐻𝑛𝐼 (1)
Where 𝐻
is the transpose of the Hadamard
matrix
𝐻 is the Hadamard matrix
𝑛 is the Hadamard matrix dimension
𝐼 is the identity matrix
These are applicable to reconstruct the reflectance for
each spatial position coded using the Hadamard
sequence as:
𝐻
𝐻•𝑅𝑛𝐼•𝑅 (2)
Where R is the reflectance corresponding to each
spatial position in the image plane.
Having mentioned that it is impossible to capture -1
code, this is replaced by 0 in this research. The
orthogonal code cannot correctly cancel out all the
crosstalk. Here we propose a set of the simultaneous
equation to reconstruct the correct intensity for each
spatial position in the image plane without crosstalk
from the other illuminating pixels. In the case of the
4x4 pixel, the 𝐻
•𝑅 can be expressed as:
(3)
(4)
The diagonal elements and the first column of the
matrix shown in Equation (4) allow us to determine
𝐼
,𝐼
,𝐼
and 𝐼
. The other elements also enable us to
determine all the crosstalk terms.
The reflectance point spread function of 1.49NA
with a linearly polarized laser beam at 633 nm was
simulated for a 50nm plasmonic gold sample coated
on a standard coverslip to demonstrate the proposed
method. The sample is then illuminated using the
PHOTOPTICS 2023 - 11th International Conference on Photonics, Optics and Laser Technology
98
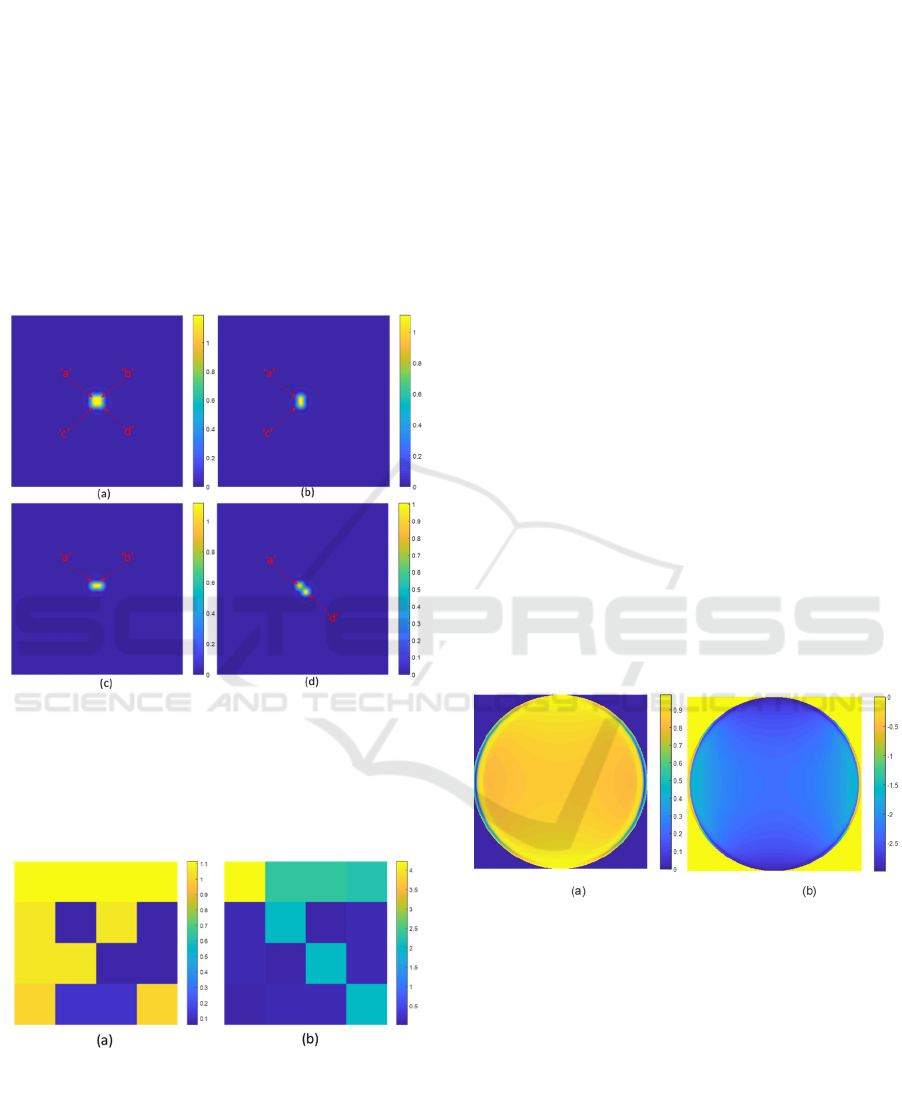
Hadamard code in Fig.4b, in which each row in
Fig.4b represents a camera frame. Assuming that the
intensity of the reflectance point spread function is 1
for each position in the image plane. Fig.5 shows the
4 simulated camera frames corresponding to the
Hadamard sequences in Fig.4b. Fig.6a shows the 𝐻
•
𝑅 matrix and Fig.6b shows the 𝐻
𝐻
•𝑅
matrix
calculated using Equation (3) and Equation (4),
respectively. The reflectance of the 4 measurement
positions can then be determined from the diagonal
matrix and the first column of the 𝐻
𝐻
•𝑅
matrix and found to be all 1 as defined in this
example.
Figure 5: Simulated reflectance from a 50 nm thick gold
sensor using (a) the 1
st
frame of the adjusted Hadamard
code in Fig.4b, (b) the 2
nd
frame of the adjusted Hadamard
code in Fig.4b, (c) the 3
rd
frame
of the adjusted
Hadamard code in Fig.4b and (d) the 4
th
frame of the
adjusted Hadamard code in Fig.4b.
Figure 6: Shows (a) 𝐻
•𝑅 and (b) 𝐻
𝐻
•𝑅
calculated
using Equation (3) and Equation
(4).
2.2 Optical Simulation Parameters
The system in Fig. 2 consists of a linearly polarized
laser at 633 nm wavelength (HeNe). The objective
lens is an oil immersion objective lens 1.49NA with
x100 magnification. The plasmonic sensor is a
uniform sensor made of 50nm gold coated on a
standard coverslip with 0.17mm thickness. The
refractive index of the coverslip is n
glass
of 1.52, and
the refractive index of the immersion oil noil of 1.52.
The complex refractive index of gold at 633 nm
wavelength is n
gold
of 0.1834+3.4332i (Johnson &
Christy, 1972). The gold sensor is coated with 10 nm
thick Bovine Serum Albumin (BSA) protein with a
refractive index of 1.4 (Chow, Pechprasarn, Meng, &
Somekh, 2016). A water environment with a
refractive index of 1.33 backs the sensor.
3 RESULTS
This section provides simulation results to
demonstrate how the widefield SPR phase
measurement can be achieved. The following is a list
of optical and physical parameters computed in the
simulation. These parameters can be realized under
standard optical experimental conditions. The system
configuration is the same as shown in Fig.2.
The back focal response (BFP) of the microscope
objective, as shown in Fig.7, is calculated by Fresnel
equations and a transfer matrix approach computed in
Matlab. Fig.7a shows the intensity response of the
BFP, and Fig.7b shows the phase response of the
corresponding BFP.
Figure 7: (a) Intensity response of the BFP and (b) phase
response of the simulated BFP.
The microscope point spread function for different z
defocus ranging from -6 microns to 2 microns, as
shown in Fig. 8 , was then computed by multiplying
defocus phase function exp(i2kzcosθ) to the BFP
response, where k is the wave vector given by
2πn
0
/λ. θ is the incident angle, and z is the axial
defocus distance of the sample stage.
Ultra-Sensitivity Widefield, Confocal Surface Plasmon Interferometry Using Sequential Coding
99
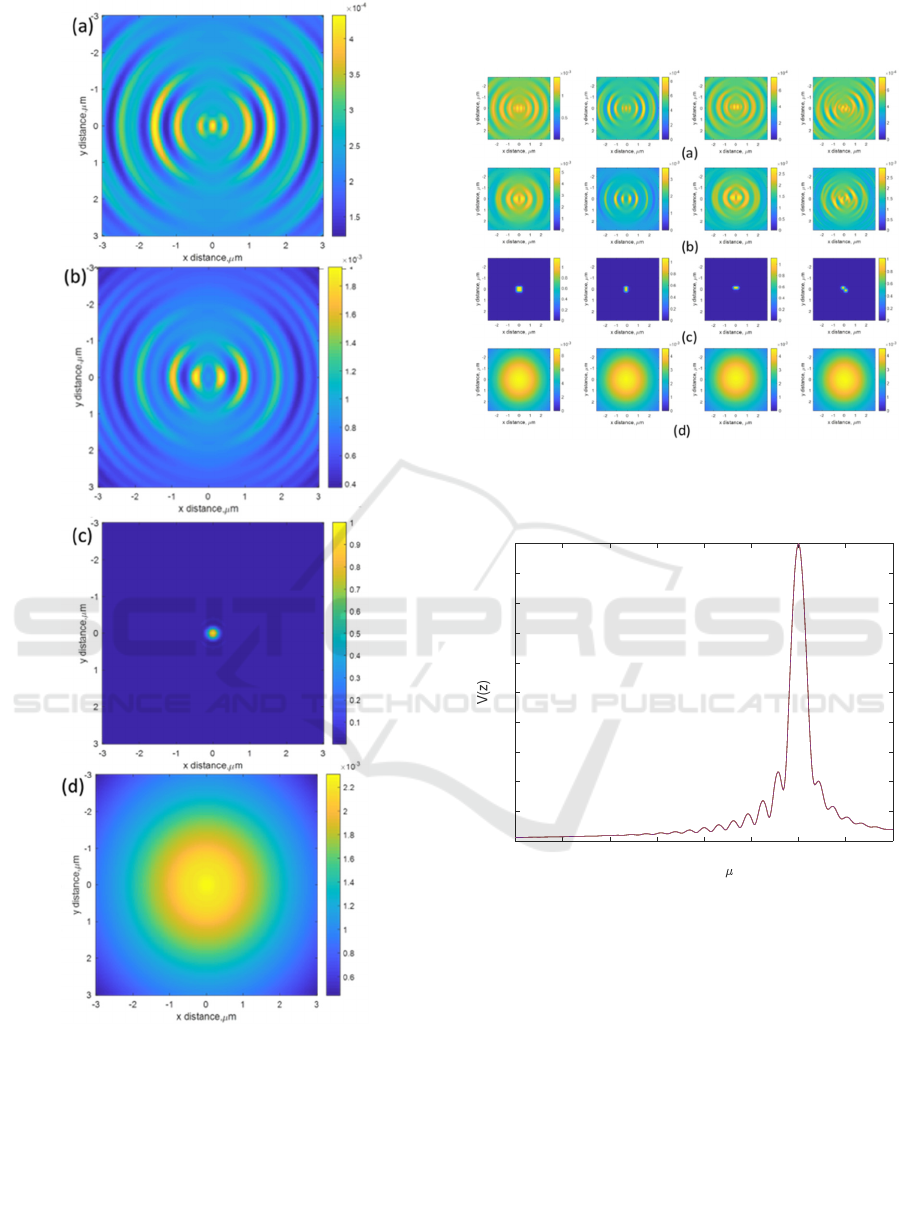
Figure 8: V(z) responses for (a) z of 6 microns (b) z
of 3 microns (c) z of 0 microns and (d) z of 2 microns.
The reflectance of 4 measurement positions separated
by 100 nm was then computed by convolution
calculation, as shown in Fig.9. The adjusted
Hadamard coding shown in Fig.4b was then applied
to the 4 measurement positions. Note that the 4
measurement positions were purely for illustration
here; the proposed method can be appliable with
much larger pixels.
Figure 9: (a) Reflectance at z of 6 microns, (b) reflectance
at z of 3 microns, (c) reflectance at z of 0 microns, and (d)
reflectance at z of 2 microns.
Figure 10: V(z) confocal responses of the 4 measurement
positions. Note that the 4 V(z) curves are the same.
Equation (4) was then applied to separate the
crosstalk effect. The V(z) confocal responses (Zhang,
Pechprasarn, & Somekh, 2012; Zhang, Pechprasarn,
Zhang, & Somekh, 2012) corresponding to the 4
measurement positions are shown in Fig.10. The V(z)
curves of the 4 measurement positions are
successfully reconstructed. They all have the same
amplitude, shape, and ripple period. Note that the
results in Fig.8 and Fig.9 were displayed in intensity,
whereas the V(z) curves in Fig.10 were plotted in the
square root of intensity.
-6 -5 -4 -3 -2 -1 0 1 2
z defocus, m
0
0.1
0.2
0.3
0.4
0.5
0.6
0.7
0.8
0.9
1
PHOTOPTICS 2023 - 11th International Conference on Photonics, Optics and Laser Technology
100

4 CONCLUSION
Here, we have proposed and analyzed an optical
widefield, confocal surface plasmon configuration
based on time-coded illumination. It is more robust
and has a better signal-to-noise ratio than a
conventional scanning confocal surface plasmon
microscope allowing multiple confocal scanning
point spread functions to scan over the sample
simultaneously. The crosstalk between the
overlapping point spread functions can be suppressed
and reconstructed using the property of orthogonal
coding in the image plane of the microscope objective.
The proposed method can be integrated with standard
microscope systems to provide widefield, confocal
imaging.
ACKNOWLEDGEMENTS
The authors would like to acknowledge the Research
Institute of Rangsit University for supporting the
research; and the College of Biomedical Engineering,
Rangsit University, for the computing power and
research laboratory used in this work.
REFERENCES
Barnham, K. J., Masters, C. L., & Bush, A. I. (2004).
Neurodegenerative diseases and oxidative stress.
Nature reviews Drug discovery, 3(3), 205-214.
Boolchandani, M., D’Souza, A. W., & Dantas, G. (2019).
Sequencing-based methods and resources to study
antimicrobial resistance. Nature Reviews Genetics,
20(6), 356-370.
Chow, T. W., Pechprasarn, S., Meng, J., & Somekh, M. G.
(2016). Single shot embedded surface plasmon
microscopy with vortex illumination. Optics Express,
24(10), 10797-10805.
Fricker Jr, R. D., & Rigdon, S. E. (2018). Disease
surveillance: Detecting and tracking outbreaks using
statistics. Chance, 31(2), 12-22.
Guerri, S., Mercatelli, D., Gómez, M. P. A., Napoli, A.,
Battista, G., Guglielmi, G., & Bazzocchi, A. (2018).
Quantitative imaging techniques for the assessment of
osteoporosis and sarcopenia. Quantitative imaging in
medicine and surgery, 8(1), 60.
Hameed, M. F. O., Alrayk, Y. K., & Obayya, S. (2016).
Self-calibration highly sensitive photonic crystal fiber
biosensor. IEEE photonics journal, 8(3), 1-12.
Ho, H., Law, W. C., Wu, S., Liu, X., Wong, S., Lin, C., &
Kong, S. (2006). Phase-sensitive surface plasmon
resonance biosensor using the photoelastic modulation
technique. Sensors and Actuators B: Chemical, 114(1),
80-84.
Huang, Y., Ho, H. P., Kong, S. K., & Kabashin, A. V.
(2012). Phase‐ sensitive surface plasmon resonance
biosensors: methodology, instrumentation and
applications. Annalen Der Physik, 524(11), 637-662.
Johnson, P. B., & Christy, R.-W. (1972). Optical constants
of the noble metals. Physical review B, 6(12), 4370.
Nguyen, H. H., Park, J., Kang, S., & Kim, M. (2015).
Surface plasmon resonance: a versatile technique for
biosensor applications. Sensors, 15(5), 10481-10510.
Organization, W. H. (2020). Coronavirus disease 2019
(COVID-19): situation report, 51.
Ounkomol, C., Seshamani, S., Maleckar, M. M., Collman,
F., & Johnson, G. R. (2018). Label-free prediction of
three-dimensional fluorescence images from
transmitted-light microscopy. Nature methods, 15(11),
917-920.
Pechprasarn, S., Chow, T. W., & Somekh, M. G. (2018).
Application of confocal surface wave microscope to
self-calibrated attenuation coefficient measurement by
Goos-Hänchen phase shift modulation. Scientific
reports, 8(1), 1-14.
Songa, E. A., & Okonkwo, J. O. (2016). Recent approaches
to improving selectivity and sensitivity of enzyme-
based biosensors for organophosphorus pesticides: A
review. Talanta, 155, 289-304.
Venazzi, A., Swardfager, W., Lam, B., Siqueira, J. d. O.,
Herrmann, N., & Cogo-Moreira, H. (2018). Validity of
the QUADAS-2 in assessing risk of bias in Alzheimer's
disease diagnostic accuracy studies. Frontiers in
psychiatry, 9, 221.
Xiao, L., Parchur, A. K., Gilbertson, T. A., & Zhou, A.
(2018). SERS-fluorescence bimodal nanoprobes for in
vitro imaging of the fatty acid responsive receptor
GPR120. Analytical Methods, 10(1), 22-29.
Zanchetta, G., Lanfranco, R., Giavazzi, F., Bellini, T., &
Buscaglia, M. (2017). Emerging applications of label-
free optical biosensors. Nanophotonics, 6(4), 627-645.
Zhang, B., Pechprasarn, S., & Somekh, M. G. (2012).
Surface plasmon microscopic sensing with beam
profile modulation. Optics Express, 20(27), 28039-
28048.
Zhang, B., Pechprasarn, S., Zhang, J., & Somekh, M. G.
(2012). Confocal surface plasmon microscopy with
pupil function engineering. Optics Express, 20(7),
7388-7397.
Ultra-Sensitivity Widefield, Confocal Surface Plasmon Interferometry Using Sequential Coding
101
