
Unsupervised Cardiac Differentiation Stage Portraying and Pseudotime
Mapping Based on Gene Expression Data
Sofia P. Agostinho
1,2,3 a
, Joaquim M. S. Cabral
1,3,4 b
, Ana L. N. Fred
1,2 c
and Carlos A. V. Rodrigues
1,3,4 d
1
Department of Bioengineering, Instituto Superior Técnico, Universidade de Lisboa, Lisbon, Portugal
2
Instituto de Telecomunicações (IT), Lisbon, Portugal
3
iBB —Institute for Bioengineering and Biosciences, Instituto Superior Técnico, Universidade de Lisboa, Lisbon, Portugal
4
Associate Laboratory i4HB – Institute for Health and Bioeconomy at Instituto Superior Técnico, Universidade de Lisboa,
Lisbon, Portugal
fi
Keywords:
Cardiac Differentiation, Unsupervised Machine Learning, Whole Transcriptome Visualization, Differentiation
Time Mapping.
Abstract:
This paper presents a reanalysis, of a previously published RNA-seq dataset, using several unsupervised learn-
ing algorithms to study, from a whole transcriptome point of view, the changes occurring during stem cell
cardiac differentiation. The main objectives of this work were to highlight differences in gene expression pat-
terns between differentiation stages and, to create a strategy to map bulk RNA-seq samples onto a pseudotime
axis to analyse, quantitatively, how the transcriptome is evolving in comparison to the real culture time. The
method here proposed effectively portrayed the transcriptomic changes that occurred throughout the differenti-
ation processes, with a visual representation of the entire transcriptome. The portraits revealed over-expressed
genes correlated with different biological processes and gene sets for each stage of the differentiation. The
time mapping results highlighted not only the abrupt changes in the transcriptome due to the activation and
inhibition of the Wnt signalling pathway, but also the fact that upon the effect of the Wnt inhibitor, and despite
the additional culture days, the transcriptome is not changing as fast as previously posing questions regarding
maturation strategies. Taken together the proposed workflow, was considered promising as a tool to compare
different differentiation protocols and maturation strategies.
1 INTRODUCTION
According to the World Health Organization, car-
diovascular diseases are the leading cause of death
worldwide, and are estimated to be the cause of 17.9
million deaths each year (WHO, 2021). However, de-
spite the recent developments, there is still a lack of
effective treatment for major heart damage.
Cellular therapies are seen as a solution to tackle
this need; nevertheless, it is estimated that around 10
9
cells are required in the case of a myocardial infrac-
tion (Burridge et al., 2012), posing the need for the
mass production of cardiac cells. In vitro cardiac dif-
ferentiation of human Pluripotent Stem Cells (hPSCs)
a
https://orcid.org/0000-0002-7254-7916
b
https://orcid.org/0000-0002-2405-5845
c
https://orcid.org/0000-0003-1320-5024
d
https://orcid.org/0000-0001-9645-1591
is a promising method to obtain large numbers of cells
that could be used in therapeutics.
Over the years, the study of the human cell’s tran-
scriptome has significantly allowed for a better under-
standing of cellular metabolism, gene regulation, and
characterisation of health or disease mechanisms (Van
Verk et al., 2013). As such, a transcriptome charac-
terization of the hPSCs differentiation into cardiomy-
ocytes is expected to bring new knowledge about the
process of differentiation itself and eventually aid in
the characterization of the maturity and identity of the
final cardiomyocytes produced.
The high dimensionality of transcriptomics data
and the possible increase in samples to be analysed, as
new differentiation methods are developed, require a
solution that can readily portray differences and sim-
ilarities in gene expression patterns between samples
without the need for an a priori statement of the con-
ditions to be compared, as well as a means to assess
Agostinho, S., Cabral, J., Fred, A. and Rodrigues, C.
Unsupervised Cardiac Differentiation Stage Portraying and Pseudotime Mapping Based on Gene Expression Data.
DOI: 10.5220/0011892200003414
In Proceedings of the 16th International Joint Conference on Biomedical Engineering Systems and Technologies (BIOSTEC 2023) - Volume 3: BIOINFORMATICS, pages 109-120
ISBN: 978-989-758-631-6; ISSN: 2184-4305
Copyright
c
2023 by SCITEPRESS – Science and Technology Publications, Lda. Under CC license (CC BY-NC-ND 4.0)
109

the maturity stage of cells produced under different
experimental conditions.
To handle the high dimensionality of transcrip-
tomics data, machine learning algorithms have been
used, in particular, unsupervised clustering has been
applied to group genes according to their expression
pattern and has allowed inferring biologically relevant
information such as co-expression and co-regulation
networks, or even the functional role of unknown
genes (D’haeseleer, 2005).
For the study of differentiation processes in an
unsupervised way, Self-Organizing Map (SOM) has
been shown to be effective and able to portray the
evolution of the transcriptome (Schmidt et al., 2020).
Likewise, among the SOM implementation used to
study transcriptomic data, the OposSOM package
(Löffler-Wirth et al., 2015) has been widely used and
has proved to be a good tool for answering various
biological questions.
Having this in mind, the primary objective of this
work was to analyse a previously published transcrip-
tomic dataset, from the perspective of the entire tran-
scriptome, recurring to the dimensionality reduction
and mapping capabilities of SOM.
Furthermore, given the fact that it is not only es-
sential to determine which genes are being expressed
and their role in the final product quantity and quality,
but also to infer how smooth or abruptly the transcrip-
tome is changing, the possibility to visualize the sam-
ples on an arbitrary timeline would aid in the compar-
ison of replicate batches or even protocols.
Inspired by the results obtained with the appli-
cation of trajectory inference methods to single-cell
data, and the subsequent pseudotrajectory and pseu-
dotime representations, we are here proposing a sim-
ple yet useful unsupervised method to visualize the
relationship between samples in a temporal fashion,
hereafter referred to as differentiation time mapping.
2 BACKGROUND
Although the heart is composed of a variety of cell
types, its functional units are the cardiomyocytes
which can perform a coordinate contraction, ulti-
mately allowing the blood to be pumped for the en-
tire body. When myocardial tissue is damaged, as in
the case of myocardial infarction, there is substantial
cardiomyocyte death. As adult cardiomyocytes are
unable to proliferate (Burridge et al., 2012), the dam-
aged tissue is replaced by fibroblasts that will form
scar tissue and impair the normal contractibility of the
heart. Additionally, unlike in other organs, there is
no strong evidence that a pool of cardiomyocyte pro-
genitor cells, capable of replacing the lost cardiomy-
ocytes, exists in the heart (Kempf et al., 2016) making
the regenerative capacity of this organ residual.
In this scenario, hPSCs are a promising tool
for generating human cardiomyocytes for regenera-
tive therapies. Moreover, both types of hPSC, hu-
man Embryonic Stem Cells (hESCs) and human in-
duced Pluripotent Stem Cells (hiPSCs), have already
been successfully differentiated into cardiomyocytes
(Branco et al., 2020). hPSC-derived cardiomyocytes
can be obtained through various experimental proto-
cols. However, all these protocols rely on the tem-
poral modulation of key signalling pathways that will
be responsible for the transitions from a pluripotent
state to a differentiated fate. The four major pathways
involved in this differentiation are BMP, FGF, Wnt
and TGFB/activin/NODAL (Burridge et al., 2015).
Firstly pluripotent cells are primed to a primitive
streak-like stage, followed by a cardiac mesoderm
stage by the activation of the previously mentioned
pathways. This can be done using factors such as
TGF-β, Activin A, BMP4 and the Wnt pathway ac-
tivator Wnt3a, or the small molecule CHIR99021
(Leitolis et al., 2019). At a later stage of the protocol,
the inhibition of the Wnt pathway with the antagonist
DKK1 promotes cardiac specification allowing for the
production of cardiomyocytes (Kempf et al., 2016).
Alternative small molecules for DKK1 are IWP2 and
IWP4 (Kempf et al., 2016; Burridge et al., 2015).
To evaluate the differentiation process it is com-
mon to quantify the percentage of cells expressing
sarcomeric markers, such as cardiac troponin (cTNT),
using flow cytometry (Kempf et al., 2016).
Although many differentiation protocols are de-
signed to be as specific and efficient as possible, due
to the inherent complex mechanisms behind the dif-
ferentiation, several types of cells can be obtained. In
this regard, single-cell analysis has been a powerful
tool for studying the different populations present in
the culture. Moreover, trajectory inference methods
are being used to disentangle the complexity of these
culture systems in a pseudotemporal fashion (Ruan
et al., 2019).
Single-cell trajectory inference methods, also
called pseudotemporal ordering methods, rely on
single-cell data from samples with heterogeneous cell
populations and/or different time points of a process,
to order the cells onto a trajectory topology with an as-
sociated value, the pseudotime, which quantifies how
far a cell is from the point of interest in the process
being modelled (Cannoodt et al., 2016; Saelens et al.,
2019). Different methods may allow different trajec-
tories, such as linear, bifurcating or branching, but
they usually follow two main steps: representation
BIOINFORMATICS 2023 - 14th International Conference on Bioinformatics Models, Methods and Algorithms
110

simplification and cell ordering (Saelens et al., 2019).
The first step is required so that the high dimen-
sionality gene space is simplified to be more ade-
quately handled in the next step and also to avoid
the inherent redundancy of genes with highly cor-
related gene expression patterns (Cannoodt et al.,
2016). For this part dimensionality reduction, clus-
tering or graph-based techniques are generally used
(Saelens et al., 2019). Although not performed in
all approaches, a dimensionality reduction in the
cells/samples dimension can also be made.
For the cell ordering step there are several options,
however, most methods use graph-based techniques
where graph nodes represent cells or groups of cells
and then path-finding algorithms, such as the Mini-
mum Spanning Tree (MST), the shortest path or the
longest connected path, are used to define the trajec-
tory and cells mapped to it (Cannoodt et al., 2016).
3 METHODS
Figure 1 presents an overview of the workflow, used
in this work, combining several unsupervised ma-
chine learning methods. In brief, after the pre-
processing, SOM is used to portray gene expression
landscapes for every sample and K-means is then used
to isolate clusters from the SOM representation. With
these clusters, biologically relevant information is re-
trieved with gene ontology over-representation and
gene set enrichment analysis. In parallel, differenti-
ation time mapping is done using K-NN graphs and
MST algorithm.
In the next subsections, the methods will be fur-
ther detailed; the corresponding software packages,
functions and parameters used are summarized in ta-
ble 1 in the Appendix. Furthermore, until a final ver-
sion of the workflow is made publicly available, the
code used in this study can be made available upon
request.
3.1 RNA-seq Data Pre-Processing
To start this workflow, raw read counts from all sam-
ples are required. Genes with less than 10 read counts
can be considered not expressed and so they are re-
moved. The filtering function applied removes all
genes that do not have at least 10 counts, adjusted
as counts per million, in n samples, with n being the
number of samples in the smaller class.
The gene set is then normalised using the TMM
method (Robinson et al., 2010) and raw counts were
divided by the corrected library size and log2 trans-
formed. Additionally, gene expression data is cen-
tralised so that log-fold changes concerning the en-
semble average of each gene are obtained. Equation
1, detail this procedure where e is the log expression
vector for one gene and ⟨∗⟩ denotes the average.
logFC = ∆e = e − ⟨e⟩
all samples
. (1)
This centralisation process is commonly used
when performing gene clustering (Löffler-Wirth et al.,
2015) and allows for the genes to be grouped based on
their variation between samples and not based on the
absolute expression value. For all steps of this work,
when referring to gene expression is the same as ∆e
and logFC values are always compared to the mean
expression of the gene over all samples.
Besides studying the individual replicates, the av-
erage gene expression for each group of replicate
samples was computed.
3.2 Self-Organising Map
To analyse in more detail the changes occurring in the
transcriptome and to visualise this high-dimensional
data, a SOM algorithm was used, namely, the one
available in the R package OposSOM (Löffler-Wirth
et al., 2015), since it is one of the most used packages
for the application of SOM to RNA-seq datasets.
The size of the grid chosen should provide a num-
ber of nodes one order of magnitude lower than the
original size of the dataset and the number of epochs
is experimentally defined so that the SOM grid has a
high gene-model correlation and a well-defined area
with the models with lower entropy and variance
(Löffler-Wirth et al., 2015).
3.2.1 SOM Expression Portraits
After training, genes are mapped onto the trained
grid. Each model of the SOM grid, or pixel of the
SOM portrait, will have several genes mapped onto
it forming a small cluster. The mean of this cluster
is computed and corresponds to a new entity named
metagene. From the metagene grid, individual sam-
ple transcriptomic portraits are plotted, as well as the
mean portrait formed with the mean expression of the
samples from the same class.
These portraits are essentially a topographic map
where each pixel is coloured accordingly with the ex-
pression value of the metagene for that particular sam-
ple, resembling a transcriptomic landscape of each
sample. In this work two colour scales are analysed:
the portrait scale, where, for each sample, the max-
imum and minimum values of expression are taken
to be the maximum and minimum on the colours;
and the absolute scale, where all portraits are in the
Unsupervised Cardiac Differentiation Stage Portraying and Pseudotime Mapping Based on Gene Expression Data
111
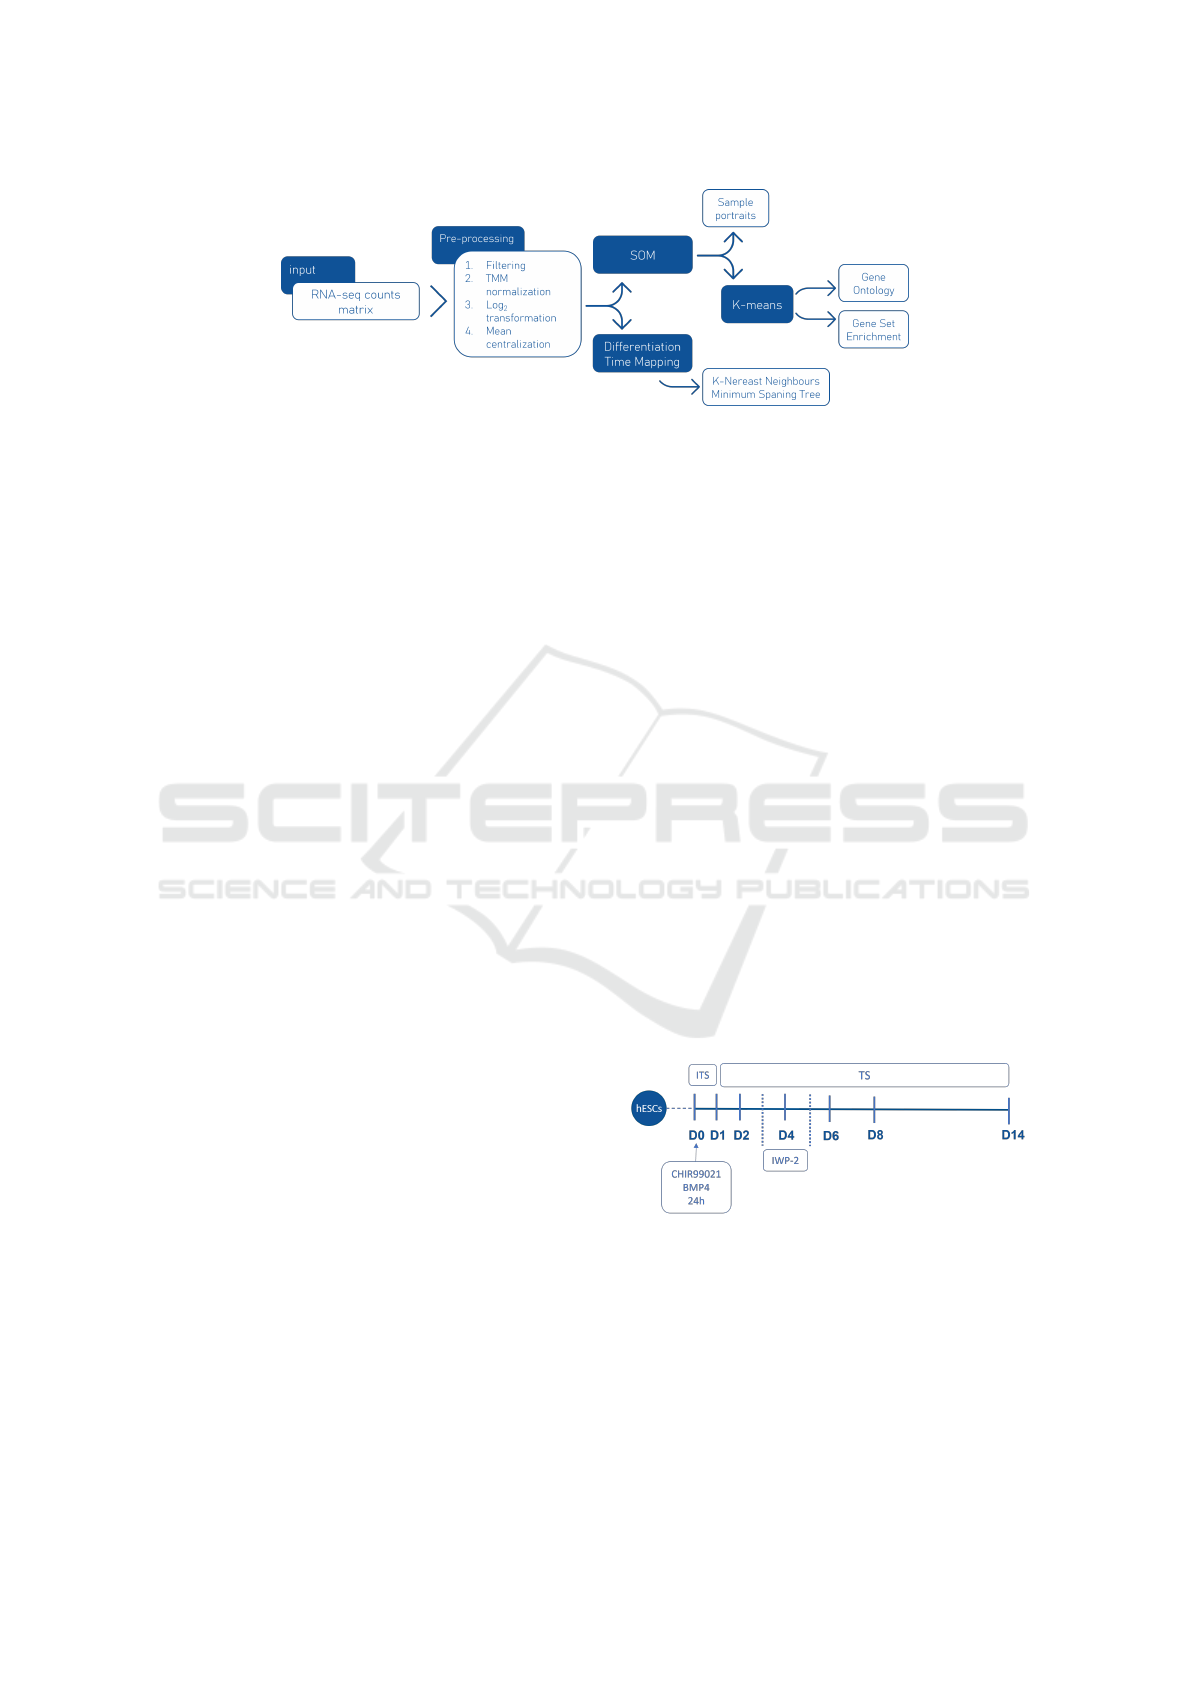
Figure 1: Overview of the methodology.
same colour scale and so, some portraits may not have
the maximum and minimum expression value over
the dataset. For both colour scales, the metagenes
with lower expression are represented in blue, the
ones with higher expression in red, and the intermedi-
ate values of expression are represented in shades of
green and yellow.
Additionally, genes that are commonly used as
markers to characterise different steps of the differ-
entiation process were located on the SOM grid and
their position overlayed with the mean portraits of the
corresponding differentiation day. The gene markers
used were previously presented in (Burridge et al.,
2012)
3.2.2 SOM Grid Partition by K-Means and
Cluster Analysis
To further analyze the over-expressed spots identified
on the SOM portraits, the K-Means algorithm was
used to divide the grid into 20 clusters, named A to
T. Since some parts of the SOM grid are composed of
practically invariant metagenes, some clusters were
excluded from further analysis as they were consid-
ered to have no significant expression for any sample.
To extract biological information about the genes
contained in each of the clusters in the study, Gene
Ontology (GO) over-representation and Gene Set En-
richment (GSE) analysis were made.
3.3 Differentiation Time Mapping
The differentiation time mapping method here pre-
sented is inspired by the time inference methods used
for single-cell data.
As in those methods, firstly, a dimensionality re-
duction technique will be used, in this case, the SOM
sample portraits will be used as a lower dimension-
ality representation of the differentiation time points.
Then a K-Nearest Neighbours (KNN) graph will be
created with the minimum number of neighbours nec-
essary to obtain a single graph containing all samples.
From this graph, a MST will be drawn. Based on the
MST distances a pseudotime value will be computed
so that it represents the cumulative time passed from
the start (hPSC) to the end of the differentiation pro-
cess.
4 RESULTS AND DISCUSSION
4.1 Dataset Description
For this work, the RNA-seq data set from Frank et
al. (Frank et al., 2019) was used, and is avail-
able through Gene Expression Omnibus(Barrett et al.,
2012) (GEO) Accession Number GSE115575. This
dataset is composed of samples throughout the differ-
entiation process of hESCs into cardiomyocytes using
the temporal modulation of the Wnt signalling path-
way and BMP4, in a 2D monolayer. Briefly, at day 0
cells were cultured in ITS medium with CHIR 99021
and BMP4. After 24 hours the medium was changed
to TS medium. On day 3, the Wnt inhibitor IWP-
2 was added and on day 5 the culture was changed
again to TS medium. This data set has 7 time points
as presented in figure 2 and the experiment was done
in triplicates.
Figure 2: Differentiation overview and RNA-seq time
points for Frank et al. data set.
4.2 Self-Organising Map Portraits
To analyze in detail the changes occurring in the
transcriptome and to visualize this high-dimensional
data, a Self-organising map (SOM) algorithm was
used. After the training process, detailed in section
BIOINFORMATICS 2023 - 14th International Conference on Bioinformatics Models, Methods and Algorithms
112
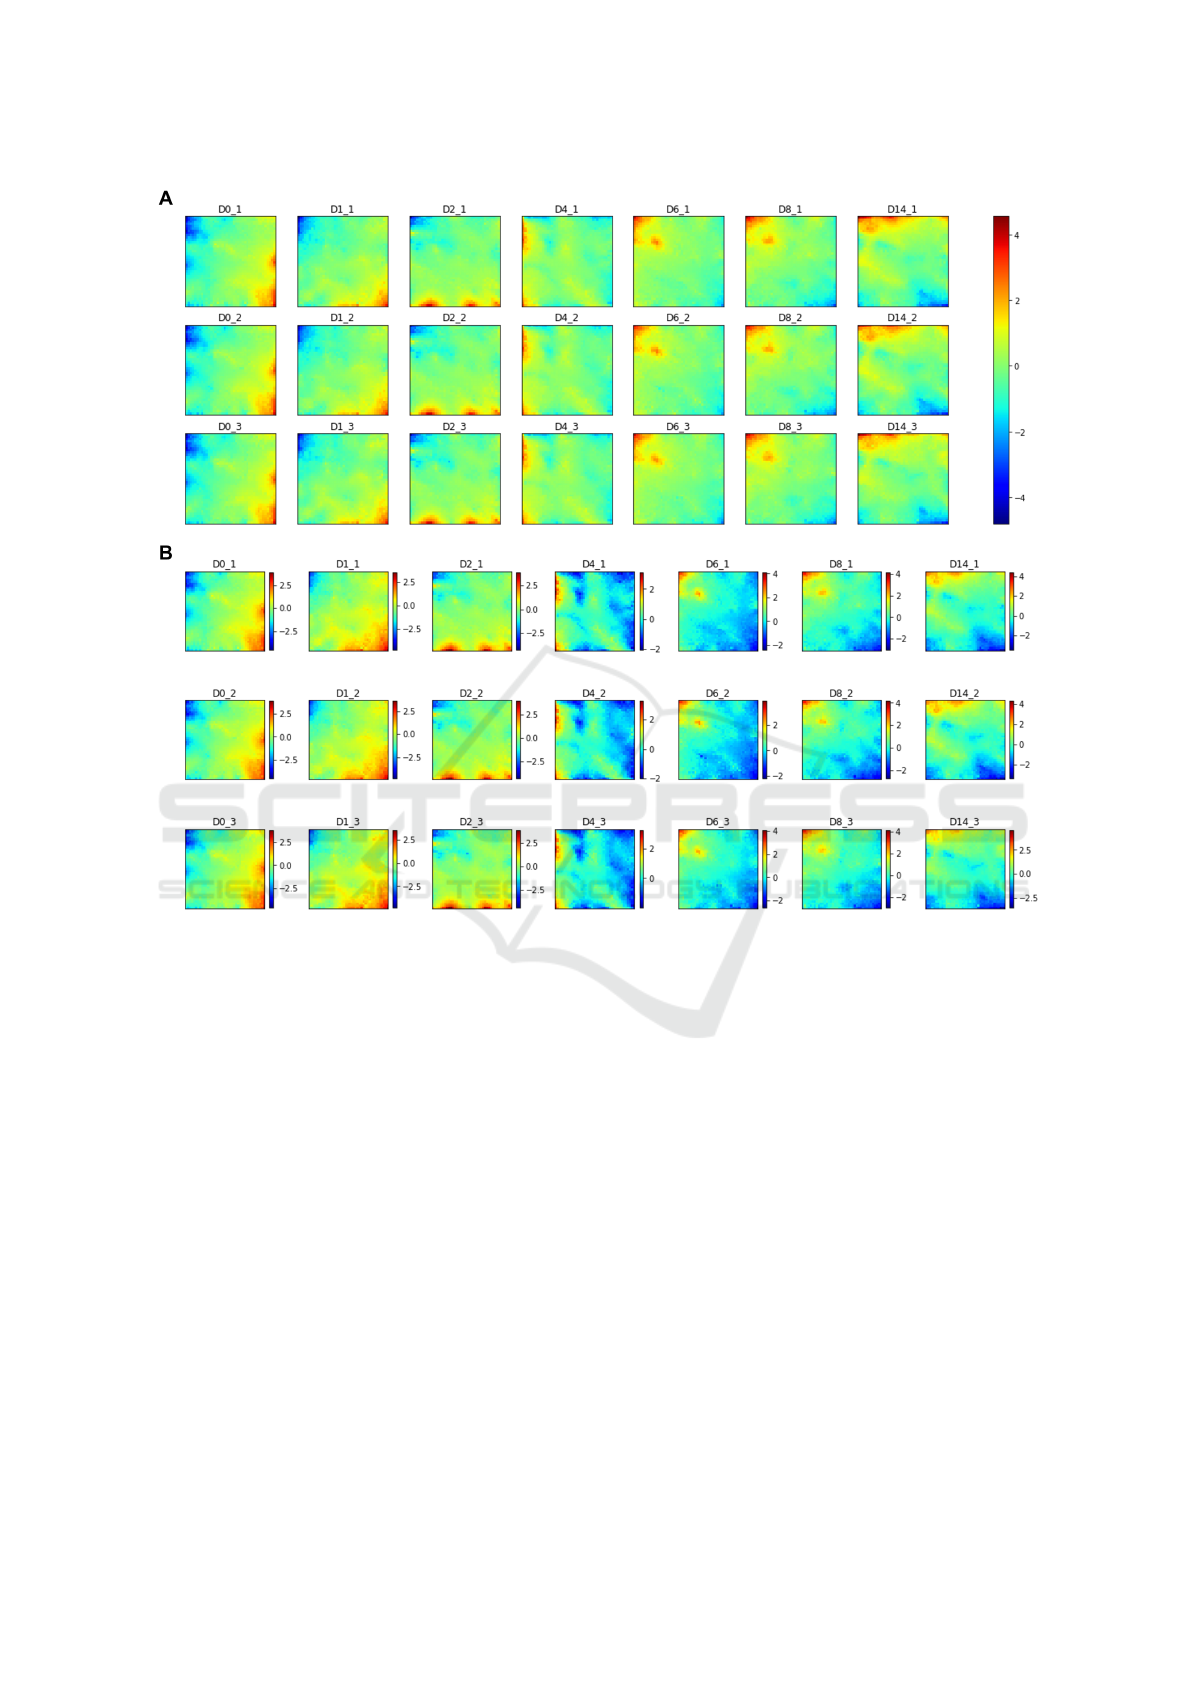
Figure 3: SOM sample portraits for all samples A on the absolute scale, B on the sample scale. Colour bars represent log
2
FC
values of expression.
3, SOM portraits were plotted in the sample and ab-
solute scales.
For the two scales, the results are very similar as
can be seen when comparing figure 3 A and B, with
the major difference being the presence, in the sam-
ple scale, of blue areas in all samples, whereas on the
absolute scale some of these areas are green. This in-
dicates that, although those metagenes are the least
expressed in those particular samples, from an overall
perspective, their expression is not an absolute mini-
mum. Moreover, from the individual SOM portraits,
it is possible to assess that the replicate samples are
highly similar to each other.
These portraits allow us to see an evolving tran-
scriptome, with the pluripotent state (day 0) being
characterized by a maximum expression in the meta-
genes located in the inferior right corner. A transition
then occurs with highly expressed genes spreading
along the inferior edge. With the evolution of the dif-
ferentiation process, the genes with higher expression
gradually move along the left edge in an upwards di-
rection until a state with the maximum expression on
the upper left corner of the portraits is achieved. From
day 8 to day 14, the major difference is the elongation
of the over-expressed area along the upper edge of the
portrait.
To understand if the SOM portraits, and the ar-
eas of higher expression, can be correlated with previ-
ously established knowledge of gene expression dur-
ing cardiac differentiation, commonly used marker
genes (Burridge et al., 2012) were searched and plot-
ted on the SOM grid as can be found in figure 4.
As expected, the Pluripotency markers are in the
inferior right corner. Mesoderm markers are dis-
tributed mainly on the lower edge of the grid and
this location overlaps the red spots in the portraits for
day 2. The overexpressed spots of day 4 also par-
tially overlap the Cardiac Mesoderm markers, how-
ever, some of the markers appear in the areas of higher
expression for day 2. This fact, although not ideal,
Unsupervised Cardiac Differentiation Stage Portraying and Pseudotime Mapping Based on Gene Expression Data
113
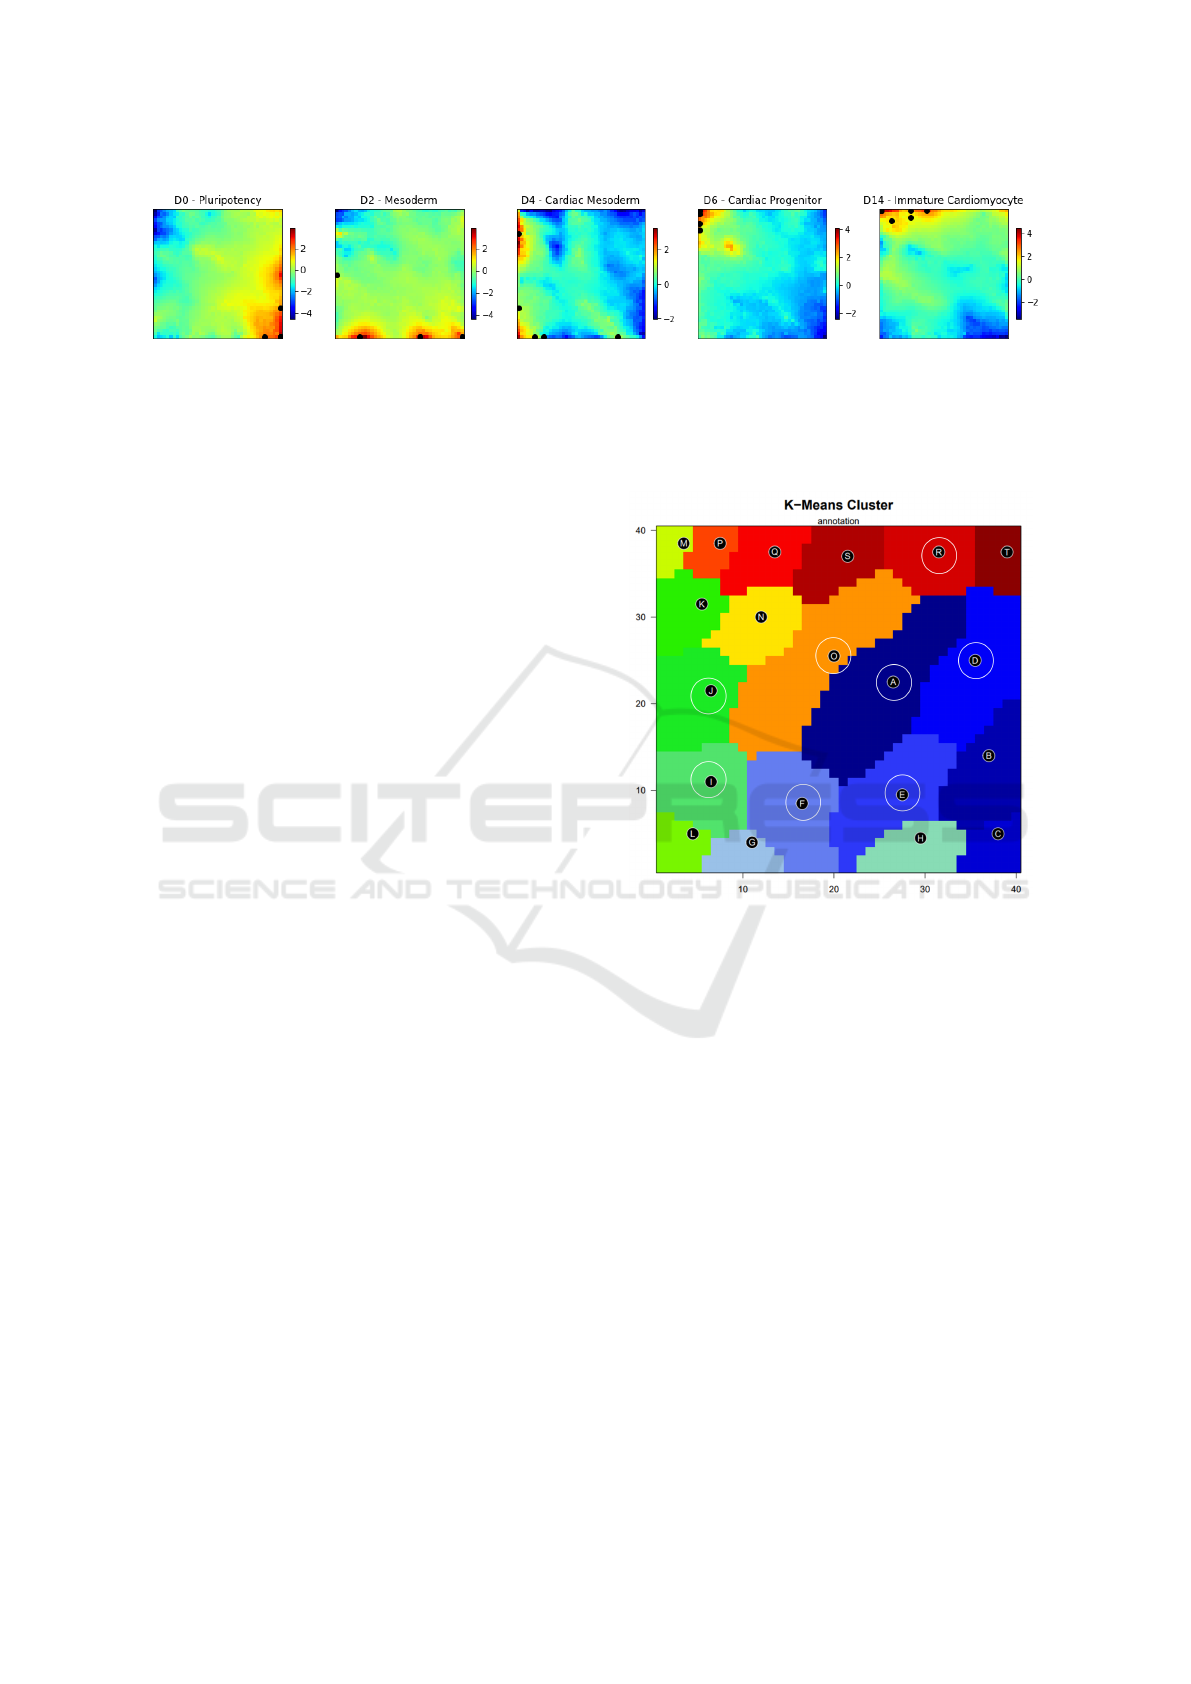
Figure 4: Common differentiation stage markers position in the SOM grid (black dots), Pluripotency - POU5F1 (40x1),
NANOG (40x1), SOX2 (40x1), LIN28A (35x1), ZFP42 (40x1), THY1 (40x9) Mesoderm - TBXT (40x1), ANPEP (8x1),
MIXL1 (27x1), ROR2 (1x19) Cardiac Mesoderm - MESP1 (9x1), KDR (1x10), KIT (32x1), CXCR4 (6x1), PDGFRA
(1x33) Cardiac Progenitor - ISL1 (1x34), NKX2-5 (1x40), GATA4 (1x36), TBX5(1x40), TBX20 (1x40), MEF2C (1x39)
Immature Cardiomyocyte - MYH6 (1x40), TNNT2 (1x40), TNNI3 (10x40), MYL2 (15x40), EMILIN2 (4x37), SIRPA
(10x38). Colour bars represent log
2
FC values of expression.
may be an indicator that by day 4 the cells in culture
are a mixture of cells from the cardiac mesoderm, but
also at a more differentiated stage.
Lastly, at day 6 cardiac progenitors were most
probably already formed as the markers overlap the
overexpressed area for this stage, and then, the Imma-
ture Cardiomyocyte markers appear distributed in the
top left corner of the grid, as the metagenes of maxi-
mum expression for day 14, supporting the evidence
for the presence of committed cardiomyocytes.
Interestingly, the correlations between the SOM
portraits of days 0, 2, 4, 6, and 14 and the position
of the different markers are also in concordance with
the expected expression time points for these mark-
ers presented in the work of Burridge and colleagues
(Burridge et al., 2012).
To study in more detail the over-expressed areas of
the grid, K-means was used to divide the metagenes
into clusters (details in table 1). The resulting par-
tition is presented in figure 5 as well as the clusters
considered to have a non-significant expression in any
sample, marked with circles.
Gene Set Enrichment (GSE) analysis and Gene
Ontology (GO) over-representation were made for the
12 significantly expressed clusters and the Top GSE
and Ontologies are presented in tables 2 and 3.
The first result worth mentioning is the fact that
clusters B and C present an over-representation of
ontologies related to DNA replication and ribosomal
RNA processing which are characteristic processes of
pluripotent stem cells. These clusters are highly ex-
pressed in the first 2 days of the culture and so, a more
detailed study of the genes involved in these ontolo-
gies and clusters may be useful to determine which
pluripotency-related genes are expressed and how fast
the transition for differentiation-related genes occurs.
Cluster G is one of the highly expressed clusters
by day 2, probably the Mesoderm stage. In fact,
one of the ontologies over-represented in this cluster
is mesoderm formation, however, the geneset enrich-
ment did not provide so straightforward results.
Figure 5: Representation of the K-means clusters on the
SOM grid with circles representing clusters removed from
further analysis.
Clusters K and L correspond to the area of highly
expressed genes in the Cardiac Mesoderm stage and
the geneset enrichment analysis resulted in similar
genesets for these clusters, nevertheless, only clus-
ter K presented ontologies related to the secondary
heart field specification, which may indicate that at
this stage the cells are not yet fully committed to a
cardiac fate.
Notably, clusters M, P and Q, which are over-
expressed at the end of the differentiation (days 8 and
14), presented an over-representation of genes from
several ontologies related to cardiac left ventricle for-
mation, cardiac conduction, contraction and calcium
ion signalling. Likewise, there is also an enrich-
ment in gene sets as the Z disc cellular compartment,
genes up-regulated in myoblasts when in presence of
insulin-like growth factors and also the gene set of the
hallmarks of myogenesis.
At last, clusters S and T which are more expressed
in the samples from day 14 show enrichment in genes
BIOINFORMATICS 2023 - 14th International Conference on Bioinformatics Models, Methods and Algorithms
114

present in several hypoxia gene sets. Interestingly, it
was already proposed that hypoxia-related genes may
play an important role in the balance between pluripo-
tency maintenance and hiPSC priming towards a dif-
ferentiated fate (Branco et al., 2019). However, re-
garding the ontology analysis, cluster S did not pro-
vide a significant over-representation in any ontology.
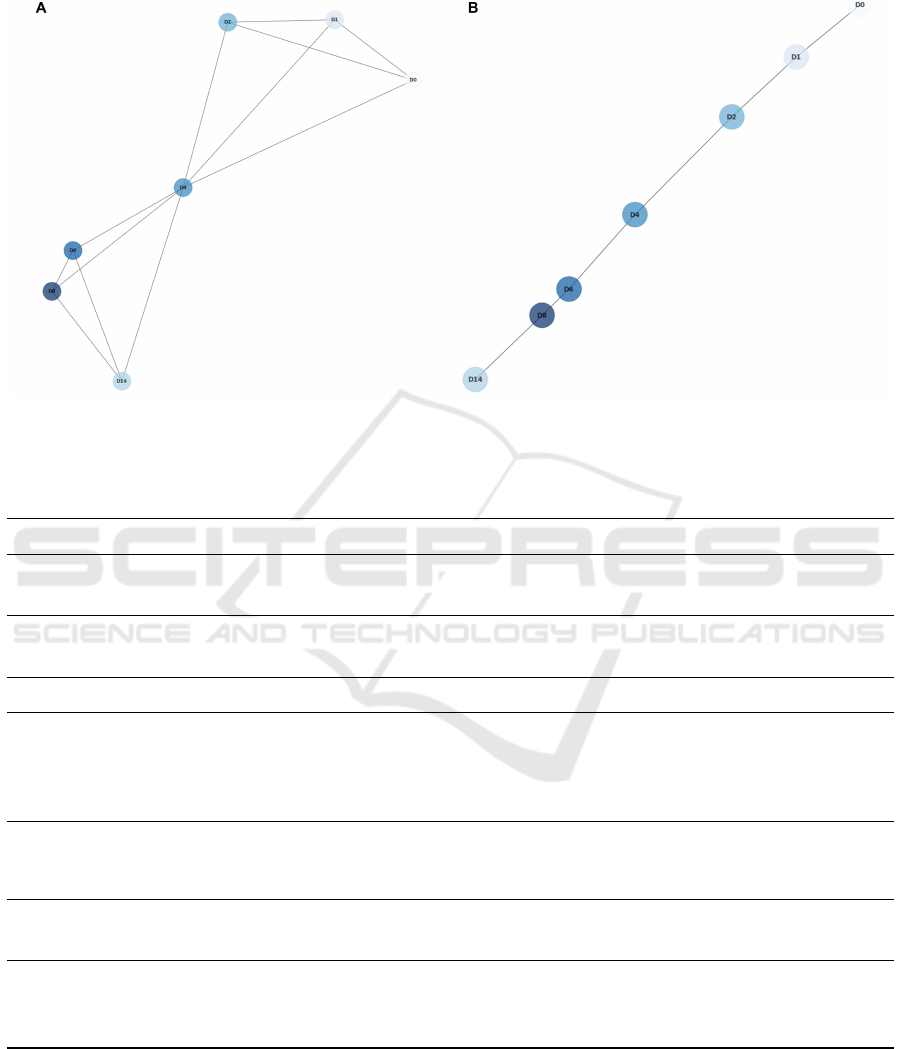
4.3 Differentiation Time Mapping
To infer the differentiation time between samples, in
an unsupervised way, firstly a 6-NN graph was cre-
ated (figure 6 A). From this graph, it is possible to
check, once again the high similarity between repli-
cate samples. Interestingly the MST (figure 6 B) ob-
tained shows a path between samples, fully agree-
ing with the days of differentiation and with replicate
samples being either on the main path in tight posi-
tions or in small branches.
For a more complex experiment, where different
protocols or uncorrelated conditions are under com-
parison, the samples positioned in the branch should
be projected onto the main path so that a pseudotime
relative to the starting point could be drawn. How-
ever, in our study, we chose to represent the pseudo-
time between days relative to the replicate samples’
average. For that, we recomputed the KNN graph
with the replicate samples’ average vectors, and half
of the neighbours, as well as the MST (figure 7).
The results were considered highly comparable with
the ones obtained for the individual samples and so,
a more informative representation of the pseudotime
and distances through the differentiation protocol is
shown in figure 6 C.
At day 0, cells, which have been maintained in
a pluripotency medium, were induced to undergo a
mesendodermal patterning of the primitive streak by
the activation of the canonical Wnt and BMP path-
ways (Kempf et al., 2016; Leitolis et al., 2019). These
drastic changes in culture conditions will be reflected
in the transcriptome and so, a considerably large dis-
tance between days 0 and 1 in the MST is seen. From
days 1 to 2 there are also quite significant changes in
gene expression, which can also be seen in the SOM
portraits, however, these changes seem to be less dras-
tic as the distance in the MST is smaller.
The major change in the whole process is occur-
ring between days 2 and 4. This was already expected
from the analysis of the SOM portraits; however, the
portraits did not provide a quantification of the over-
all change. This major shift in the transcriptome is a
consequence of the Wnt signalling pathway inhibitory
effect of IWP-2 which is provoking a cardiac commit-
ment of the previously established mesoderm (Kempf
et al., 2016; Leitolis et al., 2019). Likewise, the tran-
sition from day 4 to 6 is considerable and we envision
the removal of IWP-2 on day 5 as the main driver for
the change.
Interestingly, from day 6 to day 8 the transcrip-
tomic change is the minimum observed, as seen previ-
ously in the SOM portraits, and almost comparable to
the difference between replicate samples. Likewise,
the change between days 8 and 14 is proportionally
much lower than at the beginning of the differentia-
tion if we consider that 6 days have passed and only
17% of the overall change is occurring.
In light of these findings, we hypothesise the con-
cept of the differentiation pseudotime as useful for the
evaluation of the progression of the differentiation. In
general terms, although it is possible to obtain beat-
ing cardiomyocytes in vitro, they are generally highly
immature and lack morphological and physiological
features characteristic of adult and fully mature car-
diomyocytes (Leitolis et al., 2019; Burridge et al.,
2015). If we consider the last sample from the differ-
entiation protocol, but an in vivo fetal or even an adult
cardiomyocyte we would be able to assess, quantita-
tively, the amount of change needed for the transcrip-
tomes to be equal.
5 CONCLUSIONS
Since cardiovascular diseases are a major health is-
sue worldwide, the need for better and more effective
treatments is undeniable. Cellular therapies are ad-
vanced as promising alternatives to the current ther-
apy programs, and hPSCs are the perfect raw ma-
terial for the mass production of cardiomyocytes as
they can continuously self-renew. Despite the recent
advances in the field, hPSCs cardiac differentiation
still presents some limitations, and efficient and scal-
able protocols are still under development. During the
differentiation process, pluripotent cells are expected
to undergo significant gene expression changes, and
a study of this changing transcriptome may provide
a wealth of new information that will improve car-
diomyocyte production both quantitatively and quali-
tatively.
In this work, a whole transcriptome analysis
methodology is proposed, combining several unsu-
pervised machine learning approaches, to study the
transcriptional changes between days of differentia-
tion and to quantify the amount of change occurring
in the transcriptome, using the concept of pseudotime.
SOM provided a whole transcriptome visualiza-
tion of each sample, highlighting the differences and
similarities in transcriptional states. With this new
Unsupervised Cardiac Differentiation Stage Portraying and Pseudotime Mapping Based on Gene Expression Data
115
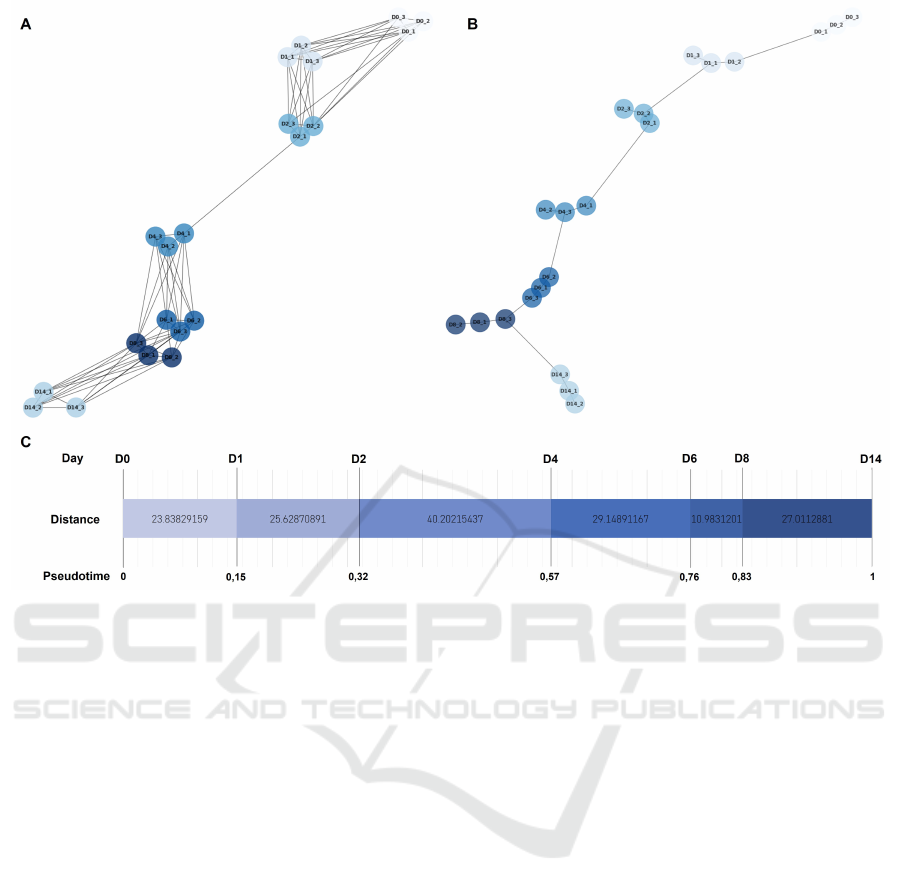
Figure 6: Considering all samples in the metagene representation A 6-NN graph B Minimum Spaning Tree. C Evolution dia-
gram of the transcriptomic changes during the differentiation experiments, from days 0 to 14. Euclidean distances computed
from the MST and cumulative pseudotime based on the Euclidean distance.
transcriptome representation and with the use of K-
means, 20 clusters were created, allowing the identi-
fication of over-expression gene sets biologically cor-
related with key steps of the differentiation process.
The creation of unsupervised pseudotime value
for bulk RNA-seq samples was, to our knowledge,
here for the first time proposed. With the differenti-
ation time mapping, it was possible to determine that
the majority of the transcriptomic changes occur dur-
ing the first 4 days of differentiation and that the Wnt
signalling pathway inhibitor is most probably respon-
sible for the most relevant transition during the dif-
ferentiation. The fact that the transcriptome seems to
not be evolving after day 6 raises some questions to
tackle in the future, namely if the culture conditions
are in fact promoting maturation and if the maturation
is achieved trough transcriptional changes or by other
mechanisms.
Unlike the commonly used approaches that focus
the transcriptomics analysis on a subset of genes con-
sidered to be differentially expressed or relevant for
the aims of the study, this unsupervised visualization
of the complete set of transcripts present throughout
the differentiation process has the potential to unveil
new relevant information that, by other means, would
not be discovered, ultimately improving our under-
standing of the differentiation processes. Taken to-
gether we envision the differentiation time mapping
concept to improve our capability to compare differ-
entiation protocols, final cardiomyocyte maturity and,
above all, quantify the transcriptomic changes and
compare them with real-time in culture.
Despite the new information uncovered through
this study, future work opportunities have been iden-
tified, namely the comparison of the differentia-
tion time mapping methodology proposed with other
established time inference methods developed for
single-cell data, a detailed analysis of the impact of
the SOM and K-means clustering on the time infer-
ence results, and the integration of more than one dif-
ferentiation strategy into the same analysis to assess
if the method can indeed be adequate to compare dif-
ferentiation protocols and/or maturation strategies.
ACKNOWLEDGEMENTS
The authors thank Fundação para a Ciência e a
Tecnologia (FCT), Portugal and Programa Opera-
cional Regional de Lisboa 2020 (PORL2020, 007317)
BIOINFORMATICS 2023 - 14th International Conference on Bioinformatics Models, Methods and Algorithms
116

through iBB – Institute for Bioengineering and Bio-
sciences (UIDB/04565/2020 and UIDP/04565/2020).
The authors acknowledge funding received from FCT
project “SMART” (PTDC/EQU-EQU/3853/2020),
and by IT - Instituto de Telecomunicações - research
grant BIM/Nº16/2022 - B-B01049.
REFERENCES
Barrett, T., Wilhite, S. E., Ledoux, P., Evangelista, C., Kim,
I. F., Tomashevsky, M., Marshall, K. A., Phillippy,
K. H., Sherman, P. M., Holko, M., Yefanov, A., Lee,
H., Zhang, N., Robertson, C. L., Serova, N., Davis,
S., and Soboleva, A. (2012). NCBI GEO: archive for
functional genomics data sets—update. Nucleic Acids
Research, 41(D1):D991–D995.
Branco, M. A., Cabral, J. M., and Diogo, M. M. (2020).
From human pluripotent stem cells to 3d cardiac mi-
crotissues: Progress, applications and challenges. Bio-
engineering, 7:92.
Branco, M. A., Cotovio, J. P., Rodrigues, C. A. V., Vaz,
S. H., Fernandes, T. G., Moreira, L. M., Cabral, J.
M. S., and Diogo, M. M. (2019). Transcriptomic
analysis of 3d cardiac differentiation of human in-
duced pluripotent stem cells reveals faster cardiomy-
ocyte maturation compared to 2d culture. Scientific
Reports, 9:9229.
Burridge, P., Keller, G., Gold, J., and Wu, J. (2012). Produc-
tion of de novo cardiomyocytes: Human pluripotent
stem cell differentiation and direct reprogramming.
Cell Stem Cell, 10:16–28.
Burridge, P. W., Sharma, A., and Wu, J. C. (2015). Ge-
netic and epigenetic regulation of human cardiac
reprogramming and differentiation in regenerative
medicine. Annual Review of Genetics, 49:461–484.
Cannoodt, R., Saelens, W., and Saeys, Y. (2016). Compu-
tational methods for trajectory inference from single-
cell transcriptomics. European Journal of Immunol-
ogy, 46:2496–2506.
D’haeseleer, P. (2005). How does gene expression cluster-
ing work? Nature Biotechnology, 23:1499–1501.
Frank, S., Ahuja, G., Bartsch, D., Russ, N., Yao, W., Kuo,
J. C. C., Derks, J. P., Akhade, V. S., Kargapolova,
Y., Georgomanolis, T., Messling, J. E., Gramm, M.,
Brant, L., Rehimi, R., Vargas, N. E., Kuroczik, A.,
Yang, T. P., Sahito, R. G. A., Franzen, J., Hescheler,
J., Sachinidis, A., Peifer, M., Rada-Iglesias, A., Kan-
duri, M., Costa, I. G., Kanduri, C., Papantonis, A.,
and Kurian, L. (2019). yylnct defines a class of di-
vergently transcribed lncrnas and safeguards the t-
mediated mesodermal commitment of human pscs.
Cell Stem Cell, 24:318–327.e8.
Hagberg, A. A., Schult, D. A., and Swart, P. J. (2008). Ex-
ploring network structure, dynamics, and function us-
ing networkx. In Varoquaux, G., Vaught, T., and Mill-
man, J., editors, Proceedings of the 7th Python in Sci-
ence Conference, pages 11 – 15, Pasadena, CA USA.
Kempf, H., Andree, B., and Zweigerdt, R. (2016). Large-
scale production of human pluripotent stem cell de-
rived cardiomyocytes. Advanced Drug Delivery Re-
views, 96:18–30.
Leitolis, A., Robert, A. W., Pereira, I. T., Correa, A., and
Stimamiglio, M. A. (2019). Cardiomyogenesis mod-
eling using pluripotent stem cells: The role of mi-
croenvironmental signaling. Frontiers in Cell and De-
velopmental Biology, 7.
Löffler-Wirth, H., Kalcher, M., and Binder, H. (2015). opos-
som: R-package for high-dimensional portraying of
genome-wide expression landscapes on bioconductor.
Bioinformatics, 31:3225–3227.
Mi, H., Ebert, D., Muruganujan, A., Mills, C., Albou, L. P.,
Mushayamaha, T., and Thomas, P. D. (2021). Panther
version 16: a revised family classification, tree-based
classification tool, enhancer regions and extensive api.
Nucleic Acids Research, 49:D394–D403.
Mi, H., Muruganujan, A., Huang, X., Ebert, D., Mills, C.,
Guo, X., and Thomas, P. D. (2019). Protocol up-
date for large-scale genome and gene function analy-
sis with panther classification system (v.14.0). Nature
protocols, 14:703.
Pedregosa, F., Varoquaux, G., Gramfort, A., Michel, V.,
Thirion, B., Grisel, O., Blondel, M., Prettenhofer,
P., Weiss, R., Dubourg, V., Vanderplas, J., Passos,
A., Cournapeau, D., Brucher, M., Perrot, M., and
Duchesnay, E. (2011). Scikit-learn: Machine learning
in Python. Journal of Machine Learning Research,
12:2825–2830.
Robinson, M. D., McCarthy, D. J., and Smyth, G. K.
(2010). edgeR: a Bioconductor package for differ-
ential expression analysis of digital gene expression
data. Bioinformatics, 26(1):139–140.
Ruan, H., Liao, Y., Ren, Z., Mao, L., Yao, F., Yu, P., Ye, Y.,
Zhang, Z., Li, S., Xu, H., Liu, J., Diao, L., Zhou, B.,
Han, L., and Wang, L. (2019). Single-cell reconstruc-
tion of differentiation trajectory reveals a critical role
of ets1 in human cardiac lineage commitment. BMC
Biology, 17:1–16.
Saelens, W., Cannoodt, R., Todorov, H., and Saeys, Y.
(2019). A comparison of single-cell trajectory infer-
ence methods. Nature Biotechnology, 37:547–554.
Schmidt, M., Loeffler-Wirth, H., and Binder, H. (2020). De-
velopmental scrnseq trajectories in gene-and cell-state
space—the flatworm example. Genes, 11:1–21.
Van Verk, M. C., Hickman, R., Pieterse, C. M., and Van
Wees, S. C. (2013). RNA-Seq: revelation of the mes-
sengers. Trends in Plant Science, 18(4):175–179.
WHO (2021). Cardiovascular diseases (cvds).
https://www.who.int/news-room/fact-
sheets/detail/cardiovascular-diseases-(cvds) (accessed
2022-05-16).
Unsupervised Cardiac Differentiation Stage Portraying and Pseudotime Mapping Based on Gene Expression Data
117
APPENDIX
Figure 7: 3-Nn graph (A) and Minimum Spaning Tree (B) considering all replicate samples’ average in the metagene repre-
sentation.
Table 1: Summary of the packages, tools and parameters used in the workflow.
Step Package/Tool Functions Parameters
RNA-seq
pre-processing
EdgeR (Robinson et al., 2010)
filterByExpr
logCPM prior count =3
SOM
OposSOM (Löffler-Wirth et al.,
2015)
grid size=40x40
Epochs=2
K-Means inbuilt in OposSOM k=20 (automatic)
GO
over-representation
PANTHER classification system
(Mi et al., 2021; Mi et al., 2019)
17.0 release
Fisher test
Homo Sapiens reference list
GO biological process com-
plete
GSE analysis inbuilt in OposSOM 6324 gene sets from GSEA
(Gene Set Enrichment Anal-
ysis) website
K-NN
Scikit-Learn (Pedregosa et al.,
2011)
kneighbors_graph
N=6, N=3
Euclidean distance
Graph construction
NetworkX (Hagberg et al., 2008)
Graph
kamada_kawai_layout
draw
MST minimum_spanning_tree
BIOINFORMATICS 2023 - 14th International Conference on Bioinformatics Models, Methods and Algorithms
118

Table 2: Top 3 GSE results for the 12 significantly expressed k-means clusters.
Cluster Gene set Category #in/all p-value
B
KRIGE_RESPONSE_TO_TOSEDOSTAT_24HR_DN GSEA C2 193 / 961 1e-41
LEE_BMP2_TARGETS_DN GSEA C2 169 / 860 3e-35
WEI_MYCN_TARGETS_WITH_E_BOX GSEA C2 150 / 759 1e-31
C
BENPORATH_ES_1 GSEA C2 102 / 366 1e-70
DUTERTRE_ESTRADIOL_RESPONSE_24HR_UP GSEA C2 53 / 310 1e-25
KOBAYASHI_EGFR_SIGNALING_24HR_DN GSEA C2 47 / 246 5e-25
G
negative regulation of protein processing BP 10 / 20 1e-13
negative regulation of interleukin-1 beta secretion BP 9 / 21 1e-11
sensory perception of smell BP 16 / 122 7e-11
H
FLORIO_NEOCORTEX_BASAL_RADIAL_GLIA_DN GSEA C2 87 / 182 8e-81
GOBERT_OLIGODENDROCYTE_DIFFERENTIATION_UP GSEA C2 124 / 539 9e-71
DUTERTRE_ESTRADIOL_RESPONSE_24HR_UP GSEA C2 96 / 310 1e-67
K
BENPORATH_EED_TARGETS GSEA C2 99 / 903 7e-29
BENPORATH_SUZ12_TARGETS GSEA C2 96 / 915 1e-26
BENPORATH_PRC2_TARGETS GSEA C2 73 / 564 8e-26
L
BENPORATH_SUZ12_TARGETS GSEA C2 49 / 915 2e-11
BENPORATH_PRC2_TARGETS GSEA C2 35 / 564 3e-10
regulation of cytokine production BP 10 / 41 2e-09
M
Z disc CC 28 / 135 7e-25
sarcomere organization BP 18 / 41 4e-23
KUNINGER_IGF1_VS_PDGFB_TARGETS_UP GSEA C2 21 / 77 1e-21
N
HSIAO_LIVER_SPECIFIC_GENES GSEA C2 28 / 221 3e-10
BENPORATH_ES_WITH_H3K27ME3 GSEA C2 66 / 989 6e-09
BENPORATH_PRC2_TARGETS GSEA C2 43 / 564 8e-08
P
Z disc CC 15 / 135 4e-09
extracellular matrix structural constituent MF 15 / 136 5e-09
collagen-containing extracellular matrix CC 23 / 341 7e-09
Q
NABA_MATRISOME GSEA C2 71 / 850 2e-14
HALLMARK_MYOGENESIS H 29 / 194 1e-12
extracellular region CC 121 / 2122 1e-11
S
MENSE_HYPOXIA_UP GSEA C2 18 / 96 2e-08
KRIEG_HYPOXIA_NOT_VIA_KDM3A GSEA C2 57 / 700 7e-08
vacuolar proton-transporting V-type ATPase complex CC 8 / 20 4e-07
T
HALLMARK_HYPOXIA H 33 / 191 3e-17
ELVIDGE_HYPOXIA_UP GSEA C2 31 / 169 4e-17
cell surface CC 60 / 650 2e-16
Unsupervised Cardiac Differentiation Stage Portraying and Pseudotime Mapping Based on Gene Expression Data
119

Table 3: Top Gene Ontologies results for the 12 significantly expressed k-means clusters.
Cluster Ontology Fold Enrichment p-value
B
purine nucleobase biosynthetic process 11.81 6.63e-5
ribosomal large subunit assembly 6.81 3.15e-5
rRNA processing 4.15 1.75e-14
C
double-strand break repair via break-induced replication 19.47 6.34e-7
DNA replication-dependent chromatin assembly 16.68 4.84e-5
regulation of DNA-templated DNA replication initiation 13.35 2.21e-5
DNA unwinding involved in DNA replication 12.13 1.63e-6
G
somite rostral/caudal axis specification 30.31 2.40e-6
regulation of short-term neuronal synaptic plasticity 17.12 1.65e-4
proximal/distal pattern formation 10.39 1.97e-4
mesoderm formation 7.17 9.09e-5
H
spindle assembly involved in female meiosis I 29.41 7.30e-5
mitotic spindle midzone assembly 16.04 1.12e-5
inner cell mass cell proliferation 12.61 3.23e-5
K
lung saccule development 14.25 4.76e-4
venous blood vessel morphogenesis 14.25 4.76e-4
secondary heart field specification 11.66 8.66e-4
L
cranial nerve development 7.37 8.32e-5
locomotory behavior 3.88 5.58e-5
axonogenesis 2.96 6.81e-5
M
regulation of muscle filament sliding speed 68.40 1.22e-3
atrioventricular node cell fate commitment 68.40 1.22e-3
cardiac left ventricle formation 68.40 1.22e-3
N
regulation of humoral immune response 6.37 3.26e-5
negative regulation of cytokine production 2.73 2.14e-5
P
cell-cell signaling involved in cardiac conduction 11.21 1.54e-4
cardiac muscle cell action potential involved in contraction 9.56 7.38e-5
regulation of heart rate by cardiac conduction 8.65 1.21e-4
Q
regulation of dendritic cell chemotaxis 14.02 9.15e-5
regulation of cardiac conduction 10.77 3.38e-6
regulation of release of sequestered calcium ion into cytosol by sarcoplasmic reticulum 10.44 1.01e-6
regulation of cardiac muscle contraction by calcium ion signaling 9.06 3.59e-5
S - - -
T
canonical glycolysis 16.65 1.19e-6
regulation of plasminogen activation 10.57 2.48e-4
BIOINFORMATICS 2023 - 14th International Conference on Bioinformatics Models, Methods and Algorithms
120
