
Semi-Automated Workflow for Computer-Generated Scoring of
Ki67 Positive Cells from HE Stained Slides
Dominika Petr
´
ıkov
´
a
1,2 a
, Ivan Cimr
´
ak
1,2 b
, Katar
´
ına Tobi
´
a
ˇ
sov
´
a
3
and Luk
´
a
ˇ
s Plank
3 c
1
Cell-in-fluid Biomedical Modelling & Computations Group, Faculty of Management Science and Informatics,
University of
ˇ
Zilina, Slovak Republic
2
Research Centre, University of
ˇ
Zilina, Slovak Republic
3
Department of Pathology, Jessenius Medical Faculty of Comenius University and University Hospital, Martin,
Slovak Republic
Keywords:
Hematoxylin and Eosin, Ki67, Clustering, Neural Networks, Digital Pathology.
Abstract:
The Ki67 positive cell score assessed by immunohistochemistry (IHC) is considered a good biomarker of cell
proliferation in determining therapeutic protocols. Manual estimation of Ki67 scores has several limitations as
it is time consuming and subject to inter-rater variability. Moreover, the IHC staining is not always available.
This could potentially be addressed by using neural network models to predict Ki67 scores directly from hema-
toxylin and eosin (HE) stained tissue. However, neural networks require large well-annotated datasets, the
creation of which is often a laborious process requiring the work of experienced pathologists. Such database
containing images of HE stained tissue with Ki67 labels is currently not available. In this paper, we propose
a semi-automated dataset generation approach to predict Ki67 scores from pairs of HE and IHC slides with
minimal assistance from experts. Using a sample of 15 pairs of whole slide images stained by HE and IHC
methods, we proposed a workflow for generating HE patches with Ki67 labels using image analysis methods
such as clustering and tissue registration. From the IHC images processed by the aforementioned methods, we
estimated the percentage of Ki67 positive cells in each patch. To verify the validity of the proposed approach
we automatically assigned Ki67 labels to HE patches from manually annotated HE - Ki67 pairs. To illustrate
the potential of neural network for assigning the Ki67 label to HE patches, we trained a neural network model
on a sample of three whole slide images, which was able to classify Ki67 positivity ratio of tissue from HE
patches into two Ki67 labels.
1 INTRODUCTION
In clinical settings, histopathology images are a crit-
ical source of primary data for pathologists to per-
form cancer diagnostic. Digital slide scanners allow
to digitize histology slides into high-resolutions im-
ages. This generates vast amounts of data which if
automatically processed gives the opportunity to em-
ploy machine learning algorithms for e.g. classifica-
tion of the specimen (He et al., 2012; Pantanowitz,
2010).
Histopathology analysis is performed using sec-
tions of tissue, with most common hematoxylin and
eosin (HE) staining. Additional immunochemistry
(IHC) labeling may be performed to obtain addi-
a
https://orcid.org/0000-0001-8309-1849
b
https://orcid.org/0000-0002-0389-7891
c
https://orcid.org/0000-0002-1153-1160
tional information (Xu et al., 2019). Example of
stained tissue sections are displayed in Figure 1. The
histopathological diagnosis of a malignant neoplasia
includes evaluation of its grading (grade of malig-
nancy) based on the evaluation of various tumor pa-
rameters. One of the most important parameters is
the tumor proliferation rate represented by the per-
centage of tumor cells showing intranuclear positiv-
ity by IHC using Ki67 monoclonal antibody (Li et al.,
2015; Kos and Dabbs, 2016). This is especially true
for neuroendocrine neoplasias (NENs). The tradi-
tionally world-wide accepted grading of NENs rec-
ognizes three grades: G1 with less than 3%, G2 with
3-20% and G3 more than 20% of Ki67 positive tu-
mor cells. The G3 NENs which include all tumors
with Ki67 positivity within the interval of 20-100% of
the cells show clinically a bright spectrum of aggres-
sive behaviour. Based on this evidence the attempts
292
Petríková, D., Cimrák, I., Tobiášová, K. and Plank, L.
Semi-Automated Workflow for Computer-Generated Scoring of Ki67 Positive Cells from HE Stained Slides.
DOI: 10.5220/0011890700003414
In Proceedings of the 16th International Joint Conference on Biomedical Engineering Systems and Technologies (BIOSTEC 2023) - Volume 3: BIOINFORMATICS, pages 292-300
ISBN: 978-989-758-631-6; ISSN: 2184-4305
Copyright
c
2023 by SCITEPRESS – Science and Technology Publications, Lda. Under CC license (CC BY-NC-ND 4.0)
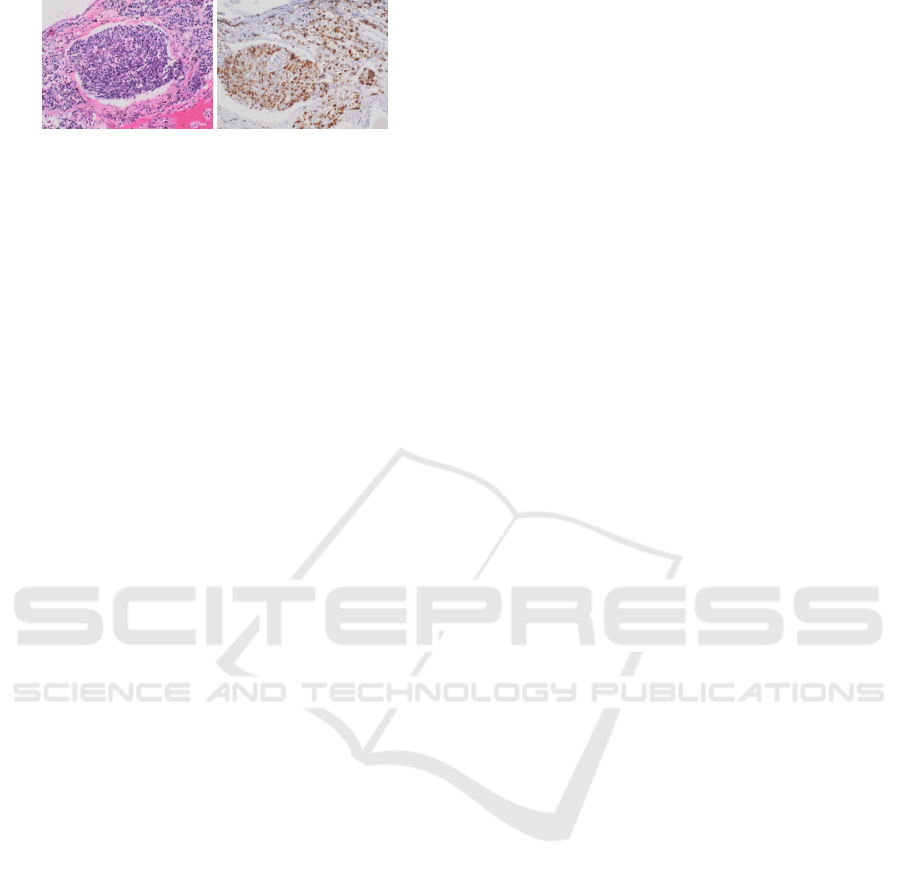
Figure 1: Example of tissue section stained with HE and
IHC Ki67.
are on the horizon to stratify G3 NENs into two new
(sub-)categories using a treshold of 40-50% tumor
cells positivity. The ambition to make this stratifica-
tion precise and accurate is in contrast with the intra-
and interobserver variability by routine histopatho-
logic evaluation of Ki67 proliferation activity. There-
fore the scoring of Ki67 positive cells from basic HE
staining would bring a significant advantage during
the evaluation of HE stained images (Boukhar et al.,
2021; Satturwar et al., 2020).
The IHC labelling is frequently performed on dif-
ferent slides adjacent to HE stained slides. This al-
lows pathologists to easily compare regions of a HE
and adjacent IHC slides. Even though the adjacent
samples are still showing similar spatial characteris-
tics, they are not identical to the other samples and
they can be shifted and rotated. To perform machine
learning data analysis and interpretation, it is critical
to align these differently stained histopathology im-
ages together.
Machine learning algorithms proved to uncover
hidden features in images that contribute to classifi-
cation of the images (Klimo et al., 2016; Klimo et al.,
2021; Ondra
ˇ
sovi
ˇ
c and Tar
´
abek, 2021). Training a ma-
chine learning model for image segmentation requires
a large amount of high-quality, annotated images as a
training dataset. The difficulty of these annotations
in terms of both the rater’s expertise and the effort
required to create increases sharply between whole
slide-level, region-level, and cell-level analyses.
Whole-slide annotations may be easier to obtain,
but the use of such weak-annotated datasets is quite
limited. The goal is usually to identify patches that
can collectively or independently predict the whole
slide label. For example, (Zhu et al., 2017; Yue et al.,
2019) used k-means clustering and found the most
discriminative clusters of patches by training CNNs
in a weakly supervised manner.
Cell-level annotations are either extremely de-
manding for the raters or require an intermediate step
of cell segmentation and afterwards the use of region-
lavel annotations. Cell segmentation has been suc-
cessfully used e.g. to segment white blood cell, their
nuclei and the surrounding cytoplasm (Al-Dulaimi
et al., 2021). Valuable dataset of segmented blood
cells has been recently published (Kouzehkanan et al.,
2022). Segmentation methods however require care-
ful tuning of model parameters that makes them less
robust than region-level annotations.
Region-level annotations require more input from
the experts however it is still reasonable and we will
further explore this approach. Using region annota-
tions, one can typically generate rectangular patches
each with its own label that can serve directly as in-
puts into machine learning algorithms. This approach
has been used in (Abousamra et al., 2021) where au-
thors fine-tuned VGGNet, ResNet and InceptionV4
models to get probabilities of small patches (100x100
pixels) being tumor infiltrating lymphocytes positive
or negative. The patches were extracted from whole
slide images of of 23 cancer types. Authors in
(Hameed et al., 2020) compared accuracy of stand-
alone VGG-16 and VGG-19 models with ensemble
models consisting of both architectures in classifica-
tion breast cancer histopathological images as carci-
noma and non-carcinoma.
Many recent studies showed that there exists cor-
relation between HE and IHC staining, specifically
for hormonal receptors such as estrogen, progesteron
or Her2 receptors (Naik et al., 2020; Rawat et al.,
2020). In (Liu et al., 2020), authors addressed the
problem of double staining in determining the num-
ber of Ki67 positive cells for cancer treatment. Em-
ploying matching pairs of IHC and HE-stained im-
ages, three different neural networks were used to
produce a heat map of higher Ki67 concentration on
the whole slide image. Here, cell segmentation step
has been used during the workflow to obtain anno-
tated cell patches from homogeneous Ki67 positive
or negative regions. Another approach of obtaining
annotated cell images was presented in (Sheikhzadeh
et al., 2016), where authors trained a CNN model to
classify biomarkers from IHC images. Such a model
could potentially be used to automatically annotate
large amounts of data, but training NN model required
segmentation of cells and subsequent manual annota-
tion by experts.
Contents of This Work
In this work we aim at exploring the possibility to pre-
dict Ki67 protein expression from HE images. We
first describe the workflow of dataset creation and
then we show proof-of-concept results of neural net-
work classification.
The dataset will consist of patches each with its
individual label representing the amount of Ki67 pro-
tein expressed on that patch. To obtain the patch label,
we first create aligned pair of two whole slide images,
one with HE staining and one with Ki67 staining. As-
Semi-Automated Workflow for Computer-Generated Scoring of Ki67 Positive Cells from HE Stained Slides
293

suming the spatial proximity of the physical slides
from which HE and Ki67 images were obtained, we
work with the assumption that a patch from the HE
whole slide image can be labelled by the patch from
the Ki67 whole slide image from the same location.
To obtain the label from the Ki67 patch we use ad-
vanced image processing methods to determine how
much of the patch area represent the Ki67 positive
cells relative to area representing all cells on Ki67
patch.
In Section 2 we describe laboratory and image
analysis methods. First we describe laboratory pro-
tocols for sample and image acquisition and consecu-
tive data preprocessing. Then we present steps lead-
ing to aligning the HE and Ki67 images. The end
of the section is devoted to color clustering of Ki67
images to distinguish between Ki67 positive and neg-
ative images leading to the labelling of HE patches
with Ki67 labels.
In Section 3 we first validated the Ki67 labelling
method on manually annotated images. Then we
present results of the keypoints algorithm on align-
ing the HE and Ki67 images. Further we give de-
tails of color clustering and consecutive Ki67 quan-
tification on the 15 WSI samples. Finally, we present
proof-of-concept results of a simple classification of
HE patches into two Ki67 labels.
2 METHODS
2.1 Image Acquisition
Formalin-fixed and paraffin-embedded specimens of
pulmonary G3 NENs of 15 patients were col-
lected from archives of Department of Pathological
Anatomy JFMED CU and UH Martin. 3-4mm thick
paired parallel sections of each of the cases were pre-
pared and stained – the first by routine hematoxylin-
eosin (HE) and the second by IHC with Ki67 mono-
clonal antibody.
Immunohistochemical analysis was performed
with the EnVision FLEX High pH (Link) K8000 kit
after deparaffinization of sections, using monoclonal
mouse antibody clone MIB-1 (FLEX, Dako), on au-
tomatized platform PTLink (Dako, Denmark A/S),
revitalized in solution HpH (pH=9) in temperature
97°C for 20 minutes, followed by IHC reaction in
AutoStainer Link 48 (Dako, Denmark). Visualization
was performed using EnVision FLEX/HRP (Dako),
DAB (EnVision FLEX, Dako) and contrast hema-
toxylin staining. The slides were first routinelly eval-
uated by two experienced and trained pathologists to
determine the percentage of Ki67 positive tumor cells.
Then the identical HE and Ki67 slides were paired
together and scanned using 3D Histech PANORA-
MATIC© 250 Flash III 3.0.3, in BrightField Default
mode.
Data have been saved in standard DICOM format.
2.2 Data Preprocessing
All whole slide image (WSI) files were transformed
into PNG images in Python with OpenSlide library.
In general, the tissues on the slides are rotated dif-
ferently and HE scans contain several tissue sections.
Therefore, from the slides, only-tissue cutouts were
created and transformed to PNG without loss of res-
olution. The resulting images were approximately
20,000x20,000 pixels in size.
2.3 Registration with Keypoints
The tissues on the slides were rotated differently when
scanned with the microscope and placed at different
positions on the slide, so the tissue cutouts were not
matching. First, it was necessary to find the transfor-
mation between pairs of images, that is, to find the
relative degree of rotation and shifting. To do this,
we used algorithm to detect keypoints. Matching fea-
tures across different images is a common problem
in computer vision. When two images are similar
meaning they have same scale and orientation, sim-
ple corner detectors can work. However, when there
is need to match images of different scales and rota-
tions, it is necessary to use different approach. SIFT
(Scale-invariant feature transform) is a keypoint de-
tection and description algorithm invariant to rotation,
shifting, scaling, illumination change and partial dis-
tortion of the object. In general, the SIFT algorithm
can be decomposed into four main steps:
• Scale-space peak detection
• Keypoint localization
• Orientation assignment
• Keypoint descriptor and matching
The scale space of an image is a function produced
from the convolution of a blurring referred to as gaus-
sian kernel (or gaussian blur operator) at different
scales with the input image. Scale-space is separated
into octaves, so each octave’s image size is half the
previous one. Images, within an octave, are progres-
sively blurred using the Gaussian blur operator ap-
plied to each pixel and
blurred images are then used to generate the dif-
ference of Gaussian obtained as the difference of im-
ages in the same octave. The resulting scale space
BIOINFORMATICS 2023 - 14th International Conference on Bioinformatics Models, Methods and Algorithms
294

is searched for locale extremes. A point is selected
as a local extreme if it is greater or lesser than all
neighbouring points. The found local extrema are
considered as potential keypoints, which are best rep-
resented in the scale in which they were a local ex-
treme. Subsequently those keypoints that have low
contrast or lie on the edge are removed. The others
are considered to be strong keypoints and are retained
for the calculation of descriptors.
To make the keypoints invariant to rotation, the
orientation of the keypoint is computed based on its
local properties. This can produce multiple keypoints
that are at the same position, with the same scale, but
different orientations. The next step creates descrip-
tors and ensures their invariance to 3D rotation and il-
lumination change. Keypoints are then matched with
keypoints of another image by identifying their near-
est neighbors. The nearest neighbor is the keypoint
that has the shortest distance descriptor (Lowe, 2004).
2.4 K-Means Clustering
In order to evaluate the ratio of brown and blue pixels
and so estimate the ratio of Ki67 positive cells, the
whole image needs to be recoloured in the following
three main colours:
• white - background
• blue - Ki67 negative
• brown - Ki67 positive.
We used a clustering algorithm to assign each pixel
to one of the main colors. Clustering is an unsuper-
vised learning technique used in many fields, includ-
ing data mining, machine learning, pattern recogni-
tion and image analysis. It is a process of partitioning
a data set into subsets based on similarity according
to some defined distance metric or finding a structure
in a collection of unlabeled data. Therefore objects
in one cluster are ”similar” with each other and ”dis-
similar” to the objects belonging into other clusters
(Madhulatha, 2012).
Among the various existing clustering algorithms,
we used generally the most known, K-means clus-
tering. K-means algorithm is one of the partitioning
methods. It distributes n objects in a data set D into
k clusters, C
1
, ....., C
k
, that is, C
i
⊂ D and C
i
∩ C
j
=
/
0.
To assess the partitioning quality, objective function
that aims for high intracluster similarity and low inter-
cluster similarity is used. So objects within a cluster
are similar to one another but dissimilar to obects in
other clusters. Centroid of a cluster is its center point
and is used to represent that cluster in centroid-based
partitioning techniques. It can be computed in various
ways, for example by the mean or medoid of all points
assigned to the cluster. The quality of a cluster can be
measured by the within-cluster variation, which is the
sum of squarred error (distance) between all objects
in C
i
and the centroid ci, defined as:
E =
k
∑
i=1
∑
p∈C
i
dist(p, c
i
)
2
, (1)
where E is the sum of the squarred error and
dist(p, c
i
)
2
is difference between object p and cen-
troid c
i
measured as Euclidean distance of two points.
In K-means algorithm, the centroid of a cluster
is defined as a mean value of the points within the
cluster. First, it randomly selects k objects as initial
cluster centroids or centers. All remaining objects are
then assigned to the cluster, which is the most similar
based on the Euclidean distance between the object
and the centroid of clusters. For each cluster, new
mean is computed using the objects assigned to the
cluster. The algorithm then iteratively reassigns ob-
jects to the clusters with new means until the assign-
ment is stable. K-means algorithm can be summa-
rized as follows:
1. arbitrarily choose k objects from D as the initial
cluster centers;
2. repeat
3. (re)assign each object to the cluster to which the
object is the most similar
4. update the cluster centroids
5. until no change;
K-means algorithm requires the number of clusters
to be determined in advance, which is perceived as
a drawback in many cases (Han et al., 2012).
3 RESULTS
3.1 Validation
To validate suggested approach, we were provided
with several pairs of images of identical tissues both
stained with Ki67 protein. In this case, all cells in
one image were crossed out with a blue or red line,
depending on whether the cell was Ki67 positive or
negative. This was done manually by expert pathol-
ogists and so we have known exact ratio of positive
and negative cells, which we could compare to ratio
obtained by our approach. Since these images are at a
much lower resolution compared to the original WSIs,
it was possible to perform experiments on them to ad-
just the parameters of the clustering algorithm such as
the number of clusters and the color space in which it
Semi-Automated Workflow for Computer-Generated Scoring of Ki67 Positive Cells from HE Stained Slides
295
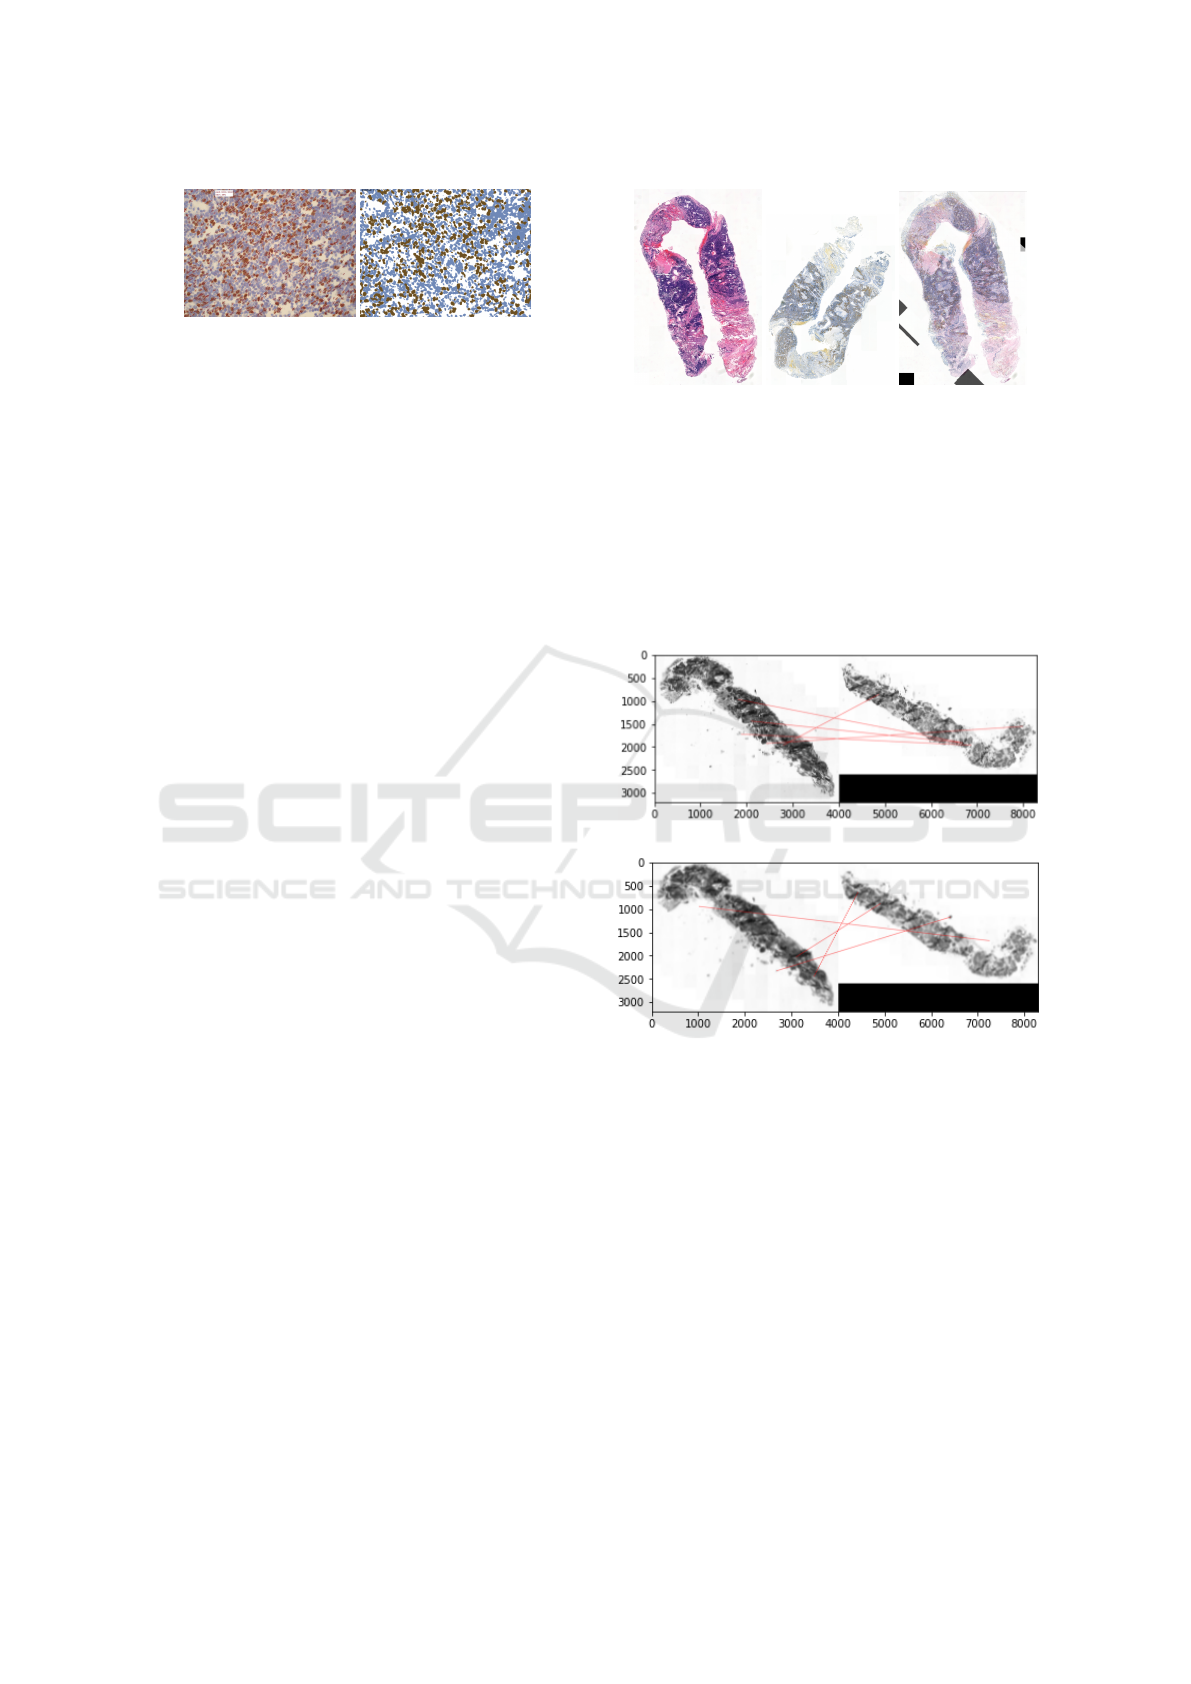
Figure 2: Example of ratio estimation on validation data.
will be applied. To determine the number of clusters,
we used the elbow method, where for different values
of k, the sum of the distances of all points from the
centroids of the clusters in which they are included
is observed. A suitable value is considered to be one
where is the elbow of the curve and the sum of dis-
tances begins to converge smoothly to some value.
We have applied the same approach in the RGB (Red
Green Blue), HSV (Hue Saturation Value) and Lab
color spaces. The only space in which an elbow could
be observed was the HSV space, and this was at a
value of 6 clusters, so we continued to use this value.
In Figure 2 there is example of original image with
crossed cells and corresponding result of clustering
with quantified ratio. In total, we compared the ratio
of the 44 available images, with resulting mean error
of 5.22%, which was considered acceptable.
3.2 HE - Ki67 Registration
Before patch generation could begin, the first nec-
essary step was to ensure that pairs of patches from
the same region of the images showed the same tis-
sue stained differently, thus creating pairs of approxi-
mately ”identical” HE and IHC images, since the tis-
sues on the slides were rotated differently and were
located at different locations on the slide. There-
fore, we first made tissue cutouts from the slides as
part of the image preprocessing. At the moment, the
registration is done manually under the supervision
of experienced medical practicioners. The procedure
consisted of placing the two images, which we made
slightly transparent, at the same coordinates in a suit-
able graphics tool and then rotating and shifting one
of them until an approximate visual match of the two
tissues was obtained, knowing the values of the de-
gree of rotation and shifting. The examples of the
manual registration can be seen in Figure 3.
To make this approach more automatic, we also
tried to register these through key points using the
SIFT algorithm. We transformed the images to
grayscale and reduced the resolution from the origi-
nal size by almost 50 times, but the registration was
not successful. The individual tissue sections are too
dissimilar despite the general similarity in shape. We
tried to reduce this dissimilarity by transforming the
image into a black-and-white mask through thresh-
Figure 3: Manual registration.
olding methods and then applied several iterations
of erosion and dilation to them with different kernel
sizes. However, this did not have the desired effect
only for one pair we were able to find matching key-
points. Registration was successful for three pairs of
scans only after applying blurring to both images. In
Figure 4, the result of the registration before and af-
ter applying the blur can be seen, with the red lines
connecting the paired keypoints.
(a) Result of wrong matching.
(b) Result of good matching.
Figure 4: Example of wrong and good matching of key-
points.
From the application of automatic registration on
8 images, it is likely that automatic registration can
be performed for tissues that have a very specific, dis-
tinct and easily identifiable shape assuming the cor-
rect image preprocessing parameters are found, oth-
erwise this approach is not very successful yet and
needs to be further investigated. In addition, trying
different image and parameter adjustments is often
more time consuming than manual registration. Sim-
plifying the automatic registration could be helped by
ensuring that the tissue sections stained by HE and
Ki67 are sections created right after each other and
thus the tissue on them would match more closely.
BIOINFORMATICS 2023 - 14th International Conference on Bioinformatics Models, Methods and Algorithms
296
3.3 Color Clustering
As a first approach, we thought that recolouring the
IHC images would also be possible based on colour
analysis through histograms, which would allow us
to find the dominant colours of the image. The out-
put would be threshold values according to which all
pixels would be recoloured. However, after display-
ing the histograms for each color channel, we were
unable to determine any dominant colors other than
white and therefore rejected this method. Instead, we
used a clustering method, namely K-means, to create
clusters of pixels with similar color. We set the pa-
rameter k according to the results of the experiments
on the validation data and applied the method in the
HSV color space. Due to insufficient memory capac-
ity, it was not possible to perform clustering on the
whole WSIs, so we divided each image into 4 parts
and applied the clustering method to them separately.
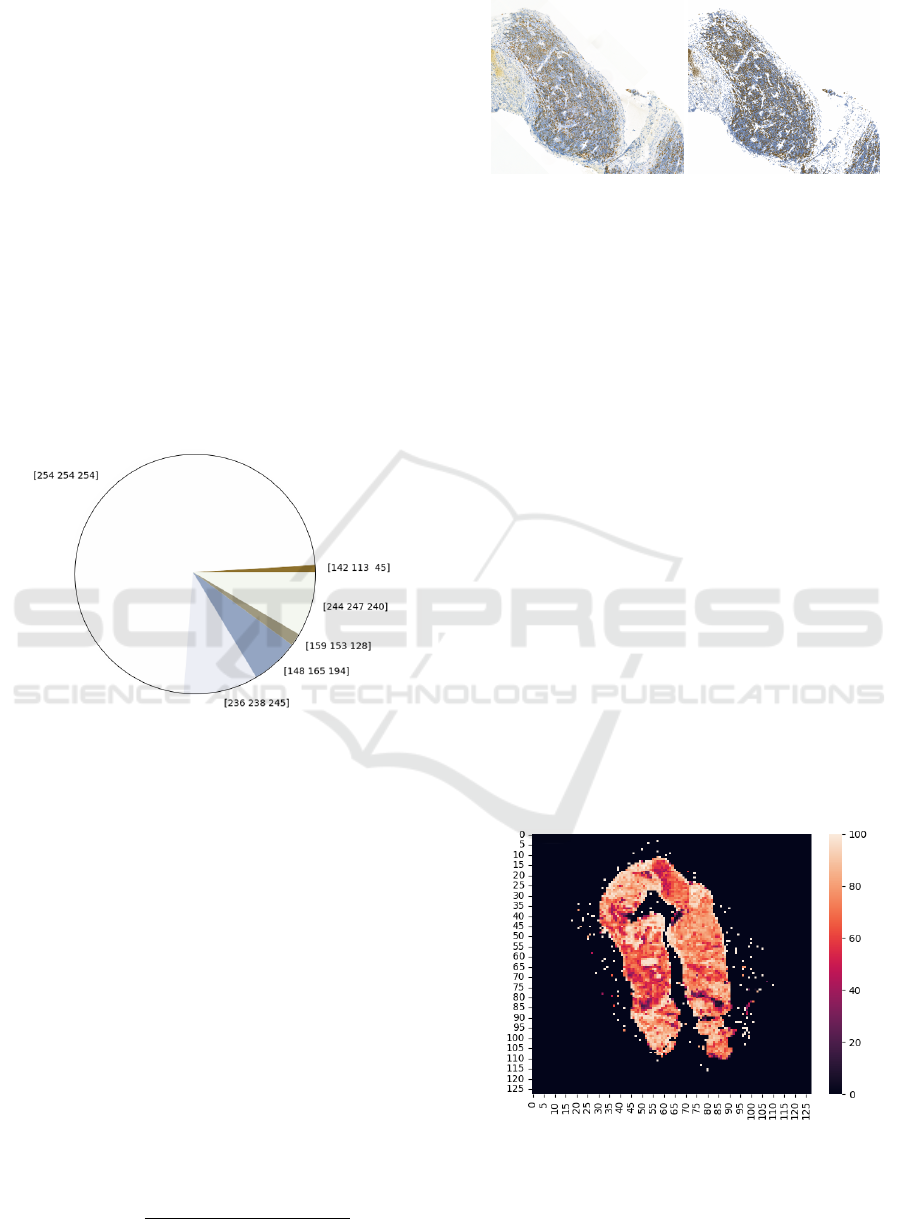
Figure 5: Pie chart of centroid from clustering colors.
The resulting cluster’s centroids were transformed
into RGB space and displayed them in a pie chart,
which is shown in Figure 5. It was then neces-
sary to perform a visual analysis and expertly de-
termine under the supervision of medical practi-
cioners, which centroid would belong to which cate-
gory (background, Ki67 positive, Ki67 negative). Fi-
nally, all pixels were recolored according to their as-
sociation with given cluster and centroid into one of
the three specified colors as is displayed in Figure 6.
3.4 Ki67 Quantification
To determine the score of Ki67 positive cells, we
quantified the ratio of the number of pixels stained
with the color corresponding to a Ki67 positive cell
(brown), to all pixels that have any cell (are brown or
blue) as follows:
ratio =
brownpixels
brownpixels + bluepixels
(2)
Figure 6: Comparison of original image and recolored one
after clustering.
In addition to this metric, it would also be possible to
determine the ratio of positive cells (pixels of a partic-
ular color) to all pixels to account for how much of the
tissue overall is occupied by Ki67-positive cells, but
we have not yet addressed this. Before the quantifica-
tion, the size of the patches had to be determined. On
one hand, we wanted to match the size of the patches
to the size of the input images of the pre-trained neu-
ral network architectures so that they did not need to
be resized. On the other hand, it was necessary to
take into account that the scanned tissue sections on
the HE and IHC slides were not cut right after each
other, resulting in them not matching at the cellular
level. Therefore, the patches were not allowed to be
too small, but to be of sufficient size to capture multi-
ple cells, as we assume that the tissue structure in one
area remains preserved. To verify this assumption, we
generated patches of 224x224 pixels, quantified the
Ki67-positivity ratio, and plotted all patches from the
image in a heat map stained according to the degree
of Ki67-positivity presented in Figure 7 and Figure
8. The aim was to verify that although the tissues are
not identical, there are regions of equal intensity of
Ki67 positivity from which patches can be generated,
which was confirmed.
Figure 7: Heatmap of ratios intensity in 224x224 patches.
When generating patches for classification pur-
poses, we were only interested in patches that had at
least 60% of the total area covered by cells, so we
Semi-Automated Workflow for Computer-Generated Scoring of Ki67 Positive Cells from HE Stained Slides
297
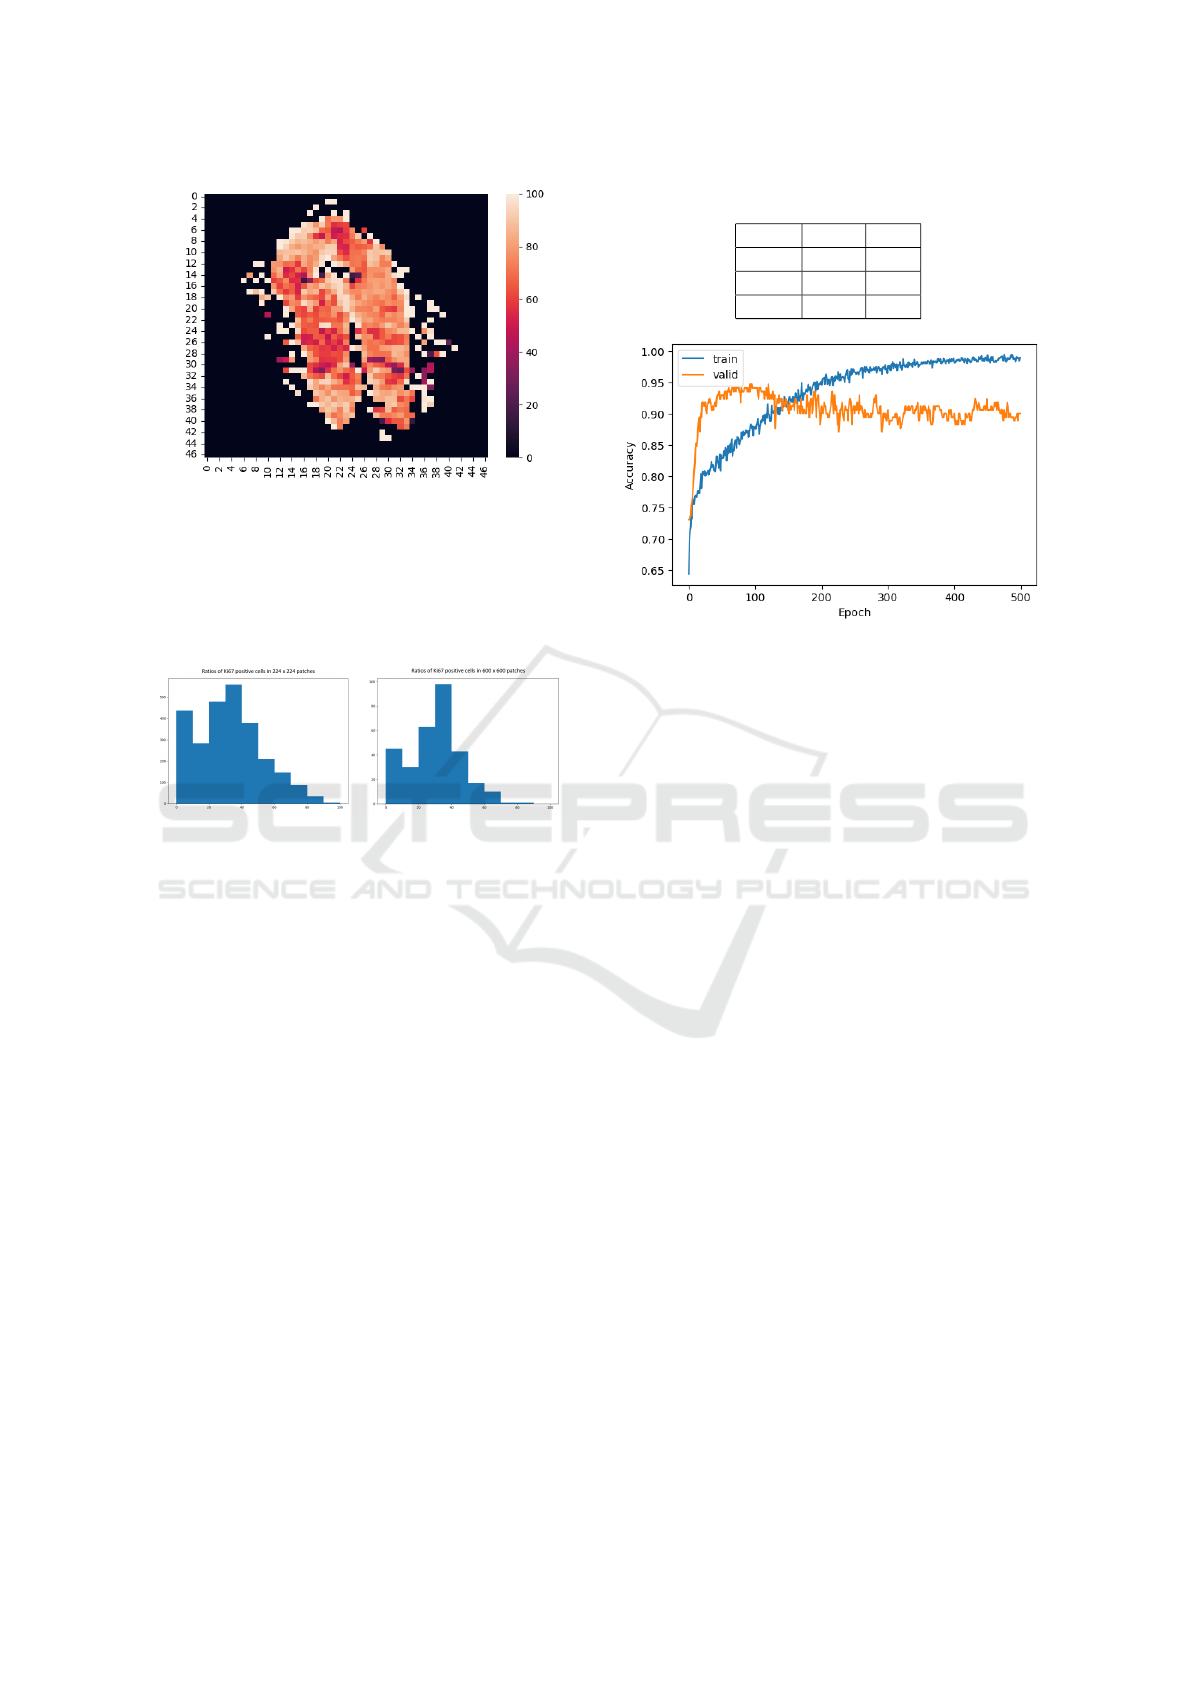
Figure 8: Heatmap of ratios intensity in 600x600 patches.
discarded all other patches. From the three WSIs, we
were able to produce 2618 patches of size 224 x 224
pixels and 308 patches of size 600 x 600 pixels. For
both sizes, we can see in the figure 9 the histogram of
cell positivity with respect to the total cell area.
Figure 9: Histograms of Ki67 positive cells ratios in
224x224 and 600x600 pixels patches.
3.5 Neural Network Training
As an initial proof-of-concept to demonstrate the cor-
rectness and functionality of the proposed dataset
generation approach for classification purposes, we
generated patches from three WSIs and trained a neu-
ral network model to classify the ratio of Ki67 posi-
tive cells from HE stained tissue in Python with Ten-
sorflow library. We divided the dataset into two cat-
egories according to the proportion of Ki67 positive
cells. The first contained patches containing less than
30 percent and the second more than 60 percent. We
omitted the values in the middle in this first experi-
ment to make classification easier. The dataset in this
case was divided into training, validation and test sets
in a ratio of 8:1:1. On training set we also applied aug-
mentation: horizontal flip, vertical flip and rotation.
The frequencies of each class are shown in Table 1.
We fine-tuned the ResNet18 architecture pre-
trained on the ImageNet dataset with first three resid-
ual blocks frozen, so only the last residual block and
fully-connected layers were trained for 500 epochs
with batch size 64. Progress of accuracy during train-
ing on train and validation set is displayed in Fig-
Table 1: Splitting of dataset.
30- 60+
Train 1000 370
Valid 125 46
Test 126 47
Figure 10: Progress of accuracy during training neural net-
work.
ure 10. We retained the weights of the model that
achieved the highest accuracy on the validation set,
its resulting accuracy was: train 0.92, valid 0.94 and
test 0.82.
4 CONCLUSIONS
In this paper, we made an attempt to create semi-
automated workflow for estimation of Ki67 positive
score from IHC stained tissue in order to predict ra-
tio of Ki67 positive cells from HE patches. We in-
troduced a data annotation approach that uses image
analysis methods to facilitate the extraction of anno-
tated data for the purpose of training neural networks
that require large amounts of data. In contrast to (Liu
et al., 2020), our dataset construction approach does
not rely on the existence of homogeneous regions of
Ki67 positive or negative cells from which patches of
labelled cells were segmented. Moreover, proposed
approach works at the WSIs level and can therefore
be applied to an arbitrarily large tissue sections with-
out need to perform cell segmentation. Nevertheless,
this study has some limitations including small sam-
ple size and the need to visually detect the resulting
centroids as Ki67 positive, negative or background.
Additionally, due to memory and computational con-
straints, the clustering hyperparameters had to be de-
termined from experiments performed on validation
data, not WSIs designed for scoring. Even so, our
results show that there is a possibility for automatic
estimation of molecular information in IHC images,
BIOINFORMATICS 2023 - 14th International Conference on Bioinformatics Models, Methods and Algorithms
298

and there is a relationship between the information
thus obtained and the morphological information dis-
played in HE images. Moreover, initial experiments
show that this relationship can be modeled by ma-
chine learning models such as neural networks.
However, it’s just the beginning of our research on
this topic. Challenges still exist, including:
1. The registration of tissue pairs needs to be done
manually, or human intervention is needed to find
the correct parameters of the automated approach,
which additionally needs to be visually inspected.
In the future, it would be necessary to develop
an automatic registration approach also with sub-
sequent validation of the correctness of the key-
points matching.
2. The relationship between HE and IHC-stained tis-
sue can be very complex due to the diversity of
tissues, cells and antibodies used to produce IHC.
Our research has so far focused on only one spe-
cific protein, Ki67, so it would be necessary to
verify whether this approach works on other types
of HE and IHC pairs.
Our future work will mainly focus on the follow-
ing aspects. Firstly, enlarge our dataset to contain
more samples, so the model trained on the new dataset
will have stronger ability of generalization. In this
step, we will also include new tissue samples whose
HE and IHC sections followed each other immedi-
ately to ensure as much tissue identity on them as
possible. Secondly, conduct more experiments and
optimize our model.
ACKNOWLEDGEMENTS
This publication has been produced with the support
of the Integrated Infrastructure Operational Program
for the projects ”New possibilities for the manage-
ment of serious diseases in medical and preventive
care with regard to the safety of health profession-
als”, ITMS:313011AUA5 and “Integrated strategy in
the development of personalized medicine of selected
malignant tumor diseases and its impact on life qual-
ity”, ITMS code: 313011V446, both co-financed by
the European Regional Development Fund.
REFERENCES
Abousamra, S., Gupta, R., Hou, L., Batiste, R., Zhao, T.,
Shankar, A., Rao, A., Chen, C., Samaras, D., Kurc, T.,
and Saltz, J. (2021). Deep learning-based mapping of
tumor infiltrating lymphocytes in whole slide images
of 23 types of cancer. Front. Oncol., 11:806603.
Al-Dulaimi, K., Banks, J., Nugyen, K., Al-Sabaawi, A.,
Tomeo-Reyes, I., and Chandran, V. (2021). Segmen-
tation of white blood cell, nucleus and cytoplasm in
digital haematology microscope images: A review-
challenges, current and future potential techniques.
IEEE Rev. Biomed. Eng., 14:290–306.
Boukhar, S. A., Gosse, M. D., Bellizzi, A. M., and Rajan
K D, A. (2021). Ki-67 Proliferation Index Assess-
ment in Gastroenteropancreatic Neuroendocrine Tu-
mors by Digital Image Analysis With Stringent Case
and Hotspot Level Concordance Requirements. Amer-
ican Journal of Clinical Pathology, 156(4):607–619.
Hameed, Z., Zahia, S., Garcia-Zapirain, B., Javier Aguirre,
J., and Mar
´
ıa Vanegas, A. (2020). Breast can-
cer histopathology image classification using an en-
semble of deep learning models. Sensors (Basel),
20(16):4373.
Han, J., Kamber, M., and Pei, J. (2012). 10 - cluster analy-
sis: Basic concepts and methods. In Han, J., Kamber,
M., and Pei, J., editors, Data Mining (Third Edition),
The Morgan Kaufmann Series in Data Management
Systems, pages 443–495. Morgan Kaufmann, Boston,
third edition edition.
He, L., Long, L. R., Antani, S., and Thoma, G. R. (2012).
Histology image analysis for carcinoma detection
and grading. Computer Methods and Programs in
Biomedicine, 107(3):538–556.
Klimo, M., Luk
´
a
ˇ
c, P., and Tar
´
abek, P. (2021). Deep neu-
ral networks classification via binary error-detecting
output codes. Appl. Sci. (Basel), 11(8):3563.
Klimo, M., Tar
´
abek, P.,
ˇ
Such, O., Smie
ˇ
sko, J., and
ˇ
Skvarek,
O. (2016). Implementation of a deep relu neuron net-
work with a memristive circuit. International Journal
of Unconventional Computing, 12(4):319 – 337.
Kos, Z. and Dabbs, D. J. (2016). Biomarker assessment and
molecular testing for prognostication in breast cancer.
Histopathology, 68(1):70–85.
Kouzehkanan, Z. M., Saghari, S., Tavakoli, S., Rostami,
P., Abaszadeh, M., Mirzadeh, F., Satlsar, E. S., Ghei-
dishahran, M., Gorgi, F., Mohammadi, S., and Hos-
seini, R. (2022). A large dataset of white blood cells
containing cell locations and types, along with seg-
mented nuclei and cytoplasm. Sci. Rep., 12(1):1123.
Li, L. T., Jiang, G., Chen, Q., and Zheng, J. N. (2015). Ki67
is a promising molecular target in the diagnosis of can-
cer (review). Mol. Med. Rep., 11(3):1566–1572.
Liu, Y., Li, X., Zheng, A., Zhu, X., Liu, S., Hu, M., Luo,
Q., Liao, H., Liu, M., He, Y., and Chen, Y. (2020).
Predict ki-67 positive cells in H&E-stained images us-
ing deep learning independently from IHC-stained im-
ages. Front. Mol. Biosci., 7:183.
Lowe, D. G. (2004). Distinctive image features from scale-
invariant keypoints. International Journal of Com-
puter Vision, 60(2):91–110.
Madhulatha, T. S. (2012). An overview on clustering meth-
ods. CoRR, abs/1205.1117.
Naik, N., Madani, A., Esteva, A., Keskar, N. S., Press,
M. F., Ruderman, D., Agus, D. B., and Socher, R.
(2020). Deep learning-enabled breast cancer hor-
Semi-Automated Workflow for Computer-Generated Scoring of Ki67 Positive Cells from HE Stained Slides
299

monal receptor status determination from base-level
H&E stains. Nat. Commun., 11(1):5727.
Ondra
ˇ
sovi
ˇ
c, M. and Tar
´
abek, P. (2021). Homography
ranking based on multiple groups of point correspon-
dences. Sensors (Basel), 21(17).
Pantanowitz, L. (2010). Digital images and the future of
digital pathology: From the 1st digital pathology sum-
mit, new frontiers in digital pathology, university of
nebraska medical center, omaha, nebraska 14-15 may
2010. Journal of Pathology Informatics, 1(1):15.
Rawat, R. R., Ortega, I., Roy, P., Sha, F., Shibata, D., Ruder-
man, D., and Agus, D. B. (2020). Deep learned tissue
“fingerprints” classify breast cancers by ER/PR/Her2
status from H&E images. Sci. Rep., 10(1):7275.
Satturwar, S. P., Pantanowitz, J. L., Manko, C. D., Seigh, L.,
Monaco, S. E., and Pantanowitz, L. (2020). Ki-67 pro-
liferation index in neuroendocrine tumors: Can aug-
mented reality microscopy with image analysis im-
prove scoring? Cancer Cytopathology, 128(8):535–
544.
Sheikhzadeh, F., Guillaud, M., and Ward, R. K. (2016).
Automatic labeling of molecular biomarkers of whole
slide immunohistochemistry images using fully con-
volutional networks.
Xu, Z., Huang, X., Moro, C. F., Boz
´
oky, B., and Zhang, Q.
(2019). Gan-based virtual re-staining: A promising
solution for whole slide image analysis.
Yue, X., Dimitriou, N., and Arandjelovic, O. (2019). Col-
orectal cancer outcome prediction from H&E whole
slide images using machine learning and automati-
cally inferred phenotype profiles.
Zhu, X., Yao, J., Zhu, F., and Huang, J. (2017).
WSISA: Making survival prediction from whole slide
histopathological images. In 2017 IEEE Conference
on Computer Vision and Pattern Recognition (CVPR).
IEEE.
BIOINFORMATICS 2023 - 14th International Conference on Bioinformatics Models, Methods and Algorithms
300
