
Mobile Augmented Reality for Analysis of Solar Radiation on
Facades
Carolina Meireles
1a
, Maria Beatriz Carmo
1b
, Ana Paula Cláudio
1c
, António Ferreira
1d
,
Ana Paula Afonso
1e
, Paula Redweik
2,3 f
, Cristina Catita
2,3 g
, Miguel Centeno Brito
2,3 h
and Daniel Soares
1
1
LASIGE, Departamento de Informática, Faculdade de Ciências, Universidade de Lisboa, 1749-016 Lisboa, Portugal
2
Departamento de Engenharia Geográfica, Geofísica e Energia, Faculdade de Ciências, Universidade de Lisboa,
Campo Grande 1749-016 Lisboa, Portugal
3
Universidade de Lisboa, Faculdade de Ciências, Instituto Dom Luiz, Lisboa, Portugal
daniel.nunes.soares@gmail.com
Keywords: Augmented Reality, Mobile Devices, Data Visualization, Solar Radiation, Photovoltaic Modules.
Abstract: The recent developments of mobile devices have enhanced the possibilities of applications of Augmented
Reality (AR), namely, providing data visualization in situ. The application prototype presented in this paper,
SolAR, designed for Android tablet devices, allows the user to extract financial and energy feedback from a
photovoltaic system, simulating its placement on facades. Such a solution can either serve as a support tool
for technicians and researchers in the area or it can be useful for the average user, contributing to the
dissemination of the use of renewable energies. SolAR provides a view of the real world augmented with
graphical representations of aggregated irradiation data drawn over the facades of buildings. Starting from the
previous work, this paper presents the various additions made, particularly the possibility of adding matrices
of photovoltaic (PV) modules to several facades of a building and the possibility of obtaining contextual data
through a web service. A user study was carried out with 32 volunteers. It revealed that the participants were
able to successfully place the PV modules to acquire the best energy efficiency and that the relevance of the
new functionalities implemented as well as the usability of the application was positively assessed.
1 INTRODUCTION
Augmented Reality (AR) combines, in real-time,
computationally generated content with the real
world captured by a camera. The portability of
smartphones and tablets along with their processing
capacity, the graphic characteristics of their screens
and the incorporation of various sensors such as GPS,
accelerometer, magnetometer, and gyroscope, among
others, meet the required conditions for the
development of mobile AR applications. In addition,
a
https://orcid.org/0000-0003-1709-3015
b
https://orcid.org/0000-0002-4768-9517
c
https://orcid.org/0000-0002-4594-8087
d
https://orcid.org/0000-0002-7428-2421
e
https://orcid.org/0000-0002-0687-5540
f
https://orcid.org/0000-0002-9644-1147
g
https://orcid.org/0000-0002-6974-1128
h
https://orcid.org/0000-0002-3580-3474
given the price, the diversity of features it offers and
its natural interaction - only requiring the user to point
the device at the area to be analysed (Ritterbusch,
2013) - its use is more and more widespread, and
interest in the development of AR applications for
these devices is growing.
Architecture, engineering, construction, and
facility management can also benefit from AR, in
tasks with high demands of information, such as
model visualization, progress monitoring, defect
detection, and safety inspections, typically targeting
Meireles, C., Carmo, M., Cláudio, A., Ferreira, A., Afonso, A., Redweik, P., Catita, C., Brito, M. and Soares, D.
Mobile Augmented Reality for Analysis of Solar Radiation on Facades.
DOI: 10.5220/0011886800003417
In Proceedings of the 18th International Joint Conference on Computer Vision, Imaging and Computer Graphics Theory and Applications (VISIGRAPP 2023) - Volume 1: GRAPP, pages
131-142
ISBN: 978-989-758-634-7; ISSN: 2184-4321
Copyright
c
2023 by SCITEPRESS – Science and Technology Publications, Lda. Under CC license (CC BY-NC-ND 4.0)
131

technicians working in the field (Rankohi, 2013). In
these areas, numerical simulation techniques are often
used to provide solutions to practical problems,
generating large sets of data that, through mobile AR,
can be visualized in the context of the physical
environment, making problem analysis and
information understanding more efficient (Li, 2017).
In this paper, we describe a prototype of a mobile
AR system for raising public awareness of solar
energy use in urban environments where,
increasingly, most of the energy demand is
concentrated, and for supporting the work of
architects, designers, and technicians, who are major
actors in the ongoing effort to reach near zero energy
buildings, as established in the European Directive
2010/31/EU (Scognamiglio, 2012). For the future of
sustainable cities, a significant fraction of the energy
demand must be fulfilled with local, clean, and
abundant sources, making solar power a great option.
The system, called SolAR, is an extension of the
work reported in Carmo et al. (2014, 2016) and
comprises a prototype of a mobile AR application for
visualising and assessing the solar power potential of
the buildings’ facades, as well as the web services that
provide the data relevant to the geographical position
of the user. The buildings’ facades offer an interesting
alternative location for photovoltaic (PV) modules,
complementing horizontal surfaces such as roofs,
because they increase the area available for producing
energy and widen the peak power production
throughout the day, particularly in the winter and in
the early and late hours of the day, during which solar
panels in facades play an important role in satisfying
electricity demand (Brito et al., 2017).
The SolAR user interface, designed for Android
tablet devices, provides a view of the real world
augmented with graphical representations of
aggregated irradiation data drawn over the buildings’
facades, showing their exposure to the sun
using an
appropriate colour scale. The solar radiation data was
generated from numerical simulations that combine
LiDAR (Light Detection And Ranging), digital
surface models and climatic observations of a typical
meteorological year, as explained in Redweik et al.
(2013). This data is also used for another SolAR
feature, which is the virtual installation of PV
modules, by directly positioning the modules on the
buildings’ facades, from which the annual irradiation
level is calculated, also considering the modules’
dimensions and its efficiency.
These SolAR features have the potential for
showing concerned citizens that their own buildings
could supply a significant amount of their energy
needs, and how much they would save on the
electricity bill if they installed PV modules in their
homes. For architects, designers and technicians, the
system may be of practical use when deciding the
locations of PV modules on a facade, supporting a
visual assessment of local shades, and providing
detailed data for each square meter (represented by 1
point in the database) of facade. And, for researchers,
SolAR may be useful for evaluating the accuracy of
solar radiation models in the urban environment, by
allowing close inspection of walls to identify outliers
and model limitations, which are not easily
determined in the office workstation.
The development of the mobile application to
observe in situ an augmented reality simulation of PV
modules installation on facades posed several
challenges presented in this paper: 1) integrate a
middleware component to get data on demand based
on user location; 2) graphically represent over the
buildings’ facades solar radiation data to guide the
user to a more efficient solution for PV modules
placement; 3) correctly align the virtual elements with
the facades of the buildings; 4) provide a locked view
mode interaction to offer more comfort to the user; 5)
support pre-defined placement of the PV modules and
offer editing tools to delete, update, and save the
configurations; 6) produce a report on energy and
financial feedback.
The paper is organized as follows: Section I
examines related works; Section II describes the
SolAR system, covering the data, the mobile AR
application, and the web services; in Section III we
present the user evaluation carried out; and in Section
IV we conclude the paper and point out future work.
2 RELATED WORKS
An advantage of AR in Data Visualization is the
possibility of analysing the data in the physical
context in which the data is concerned. White and
Feiner (2009) called this feature situated
visualization. Situated visualization using AR to
support Decision Support Systems (DSS) captivates
the attention and connection with the user through its
natural and interactive interfaces, allows exploring
data rapidly and intuitively, and promotes a faster
understanding of the available options, increasing
decision-making satisfaction (Marques, 2019), since
the user is informed with relevant and appropriate
information to base his/her choices, among multiple
alternatives (Sauter, 2014).
The SiteLens system, developed by White and
Feiner, to support the visualization of urban planning,
uses spheres, cylinders or “smoke” to represent the
GRAPP 2023 - 18th International Conference on Computer Graphics Theory and Applications
132

data. This last representation is used to simulate the
concentration of CO. The colour and size of the
symbols express the value of the variable they
represent. To facilitate the interaction with the
visualization, namely when the objects move as well
as the visualizations associated with it, they freeze the
image captured by the camera, as reported by Güven
et al. (Güven, 2006). Another AR system for
environmental data is HYDROSYS which uses 3D
models of the urban environment to calculate
occlusions (Nurminen, 2011).
In addition to scalar data visualization, AR has
been also used to visualize vector quantities. Graf et
al. (2010) proposed a system to this end in which they
use streamlines superimposed on building models for
the simulation in urban planning. Additionally,
Ritterbusch et al. (2013) presented a model for vector
quantities visualization in AR, wherein they have a
3D model of the buildings that allows invisible lines
and surfaces to be hidden. These models are drawn on
a transparent layer so that they are not visible in the
final image.
Regarding PV modules installation, Mehta et al.
(2020) developed an AR mobile application for
Android systems, the SolAR Assistant, whose main
purpose is to determine irradiation values to support
the optimal placement of the panels. Resorting to
ARCore SDK (Voinea, 2019) the app scans the
surrounding area, detecting surfaces and determining
their location and orientation. In addition, a location
API service gets latitude and longitude that are used
to calculate the shadows produced according to the
position of the sun throughout the day. The surfaces
are divided into a 2D matrix, and the intensity values
are calculated at each cell. In our work, the irradiation
data is determined using the SOL algorithm
(Redweik, 2013).
An important issue in AR is the alignment
between real objects and the corresponding graphic
elements. The alignment based on the sensors of
mobile devices has considerable imprecision that
distorts the proper functioning of AR applications that
require an alignment of the virtual elements with the
real ones (Ritterbusch, 2013). An alternative
approach is to use fiduciary marks. However, these
marks, in addition to being less aesthetic, cannot be
applied in a generalized way to all facades to visualize
solar radiation data. To circumvent the employ of
these marks, Honkamaa et al. (2007) considered two
approaches to the alignment: a semi-automatic and an
automatic. The first requires the user to manually
align, by tactile interaction, the graphic
representations with the real objects that correspond
to them. The adjustment made is recorded and applied
in all subsequent transformations. The second
approach combines the data obtained by the device's
sensors with the building information described in the
KML format. The solution presented in this paper
combines automatic alignment with manual
adjustments.
3 THE SolAR MOBILE AR
SYSTEM
The development of a visualization application in AR
requires, on the one hand, mechanisms to
superimpose and correctly align the virtual elements
to the image captured by the camera and, on the other
hand, appropriate three-dimensional visualization
techniques for the data under study, in this case scalar
variables.
This section describes the data used and the
application developed, including the tracking
techniques adopted, the graphical representations
chosen to visualize the data and the features of the
simulator to virtually install a set of PV modules on
several facades of a building.
3.1 SolAR Radiation Data and the Web
Services to Provide Data on
Demand
The solar radiation data was calculated using the SOL
algorithm (Redweik, 2013) from LiDAR data and
using 30-year time series of solar radiation
observations. It covers an area belonging to the
Campus of the University of Lisbon which includes
nine main buildings. The algorithm was developed
for urban environments taking into account the
shadow effect caused on each facade by the
neighbouring buildings and the amount of visible sky
at a given point. This quantity, expressed as a
percentage of the total sky, is called the Sky View
Factor (SVF) of the point. The calculations were
performed in a subsampling of the original point
cloud in positions that are about 1m apart vertically
and horizontally.
The application uses the data related to direct,
diffuse, and global solar radiation, measured in
KWh/m
2
, as well as the number of annual shade
hours. Each point is identified by a unique numeric
code that identifies the building’s facade to which it
belongs, and its coordinates are expressed in the
cartographic system ETRS89-TM06/PT
(EPSG:3763). To perform the conversion, in
real-time, of the coordinates obtained by the location
Mobile Augmented Reality for Analysis of Solar Radiation on Facades
133

system (which are in geographical coordinates in the
WGS84 datum) to the coordinate system, in which the
data is referenced, the PROJ4 (https://proj.org/
)
cartographic projections library was used.
The data, stored in the device's internal memory,
is read from a file in CSV format with values
separated by “;”, with a header line - which identifies
the variables in the file - and the rest with the
respective values of the variables at each facades’
point. The positions along the facades, where the
values of the variables are known, constitute the grid
that serves as a spatial reference for visualization.
This CSV file can be placed directly on the
device's internal storage in a folder with a specific
name or can be requested in real time, according to
the user’s location.
For this purpose, a middleware component was
created to request data from a spatial database - where
the data for the various buildings were organized and
stored - according to the user’s geographic position,
as well as a search radius (Soares, 2016). In this way
it is possible to automatically retrieve only the data
around the user, avoiding the need to pre-add data to
the device’s internal storage. The data of the spatial
database can be accessed through the PostgreSQL
(https://www.postgresql.org/) graphical interface
using the SQL console or by creating a link to
PostGIS (https://postgis.net/) using QGIS
(https://www.qgis.org). If there is no connection to
the internet, the application keeps data stored in the
cache, but does not update it.
3.2 Graphical Representations and
Tracking
Solar radiation data calculated on the buildings’
facades are represented by parallelepiped glyphs
aligned with the real facades and centred on the grid
points. We are, therefore, facing a case of "situated
data representation" according to Willett et al. (2016),
that is, a data representation whose physical
presentation (the virtual facades) is located close to
the data’s physical referents (the real facades).
The virtual objects are drawn with the OpenGL
ES graphic library for Android (https://developer
.android.com/develop/ui/views/graphics/opengl/abo
ut-opengl). The user can choose between three
predefined parallelepiped sizes in the general settings
of the application. In addition to the size, it is possible
to select which variable is shown, the colour scale and
the opacity of the virtual walls.
The PV modules, organized in matrices of
modules, are also represented by thin parallelepiped
glyphs superimposed on the virtual walls.
The automatic alignment of the 3D graphics with
the real world is performed using the GPS coordinates
- obtained through the Google Play Services API -
and the values of the accelerometer, magnetometer,
and gyroscope. In order for the orientation value to be
more reliable, Paul Lawitzki's Sensor Fusion filter
was used (Lawitzki, 2014). This filter first uses a
junction of the accelerometer and magnetometer
values to obtain a basic fused orientation, and then
resorts to the gyroscope to compensate for the
inaccuracy of these two initial sensors. The
gyroscope, being accurate but decreasing its accuracy
over time, is used to obtain the orientation value in
short time intervals, while the accelerometer and
magnetometer are used to “adjust” the information
acquired by the gyroscope at relatively long periodic
intervals of time (when the drift begins to make itself
felt).
Given the extreme importance of a good
alignment for the proper functioning of this
application, we address the inaccuracies of the
position and orientation sensors that still prevail using
a manual alignment mechanism similar to the solution
proposed by Honkamaa et al. (2007). This mechanism
allows the user to rectify the positioning of the
graphic elements layer by dragging them with the
finger on the touch screen until the virtual walls are
aligned with the buildings’ walls that correspond to
them. This works as a calibration process.
3.3 PV Modules
To simulate the installation of PV modules on the
facades of a building, the modules are organized in
matrices of modules that can be placed on the facade
to which the device is pointing.
To provide more comfort to the user, the
interaction with the PV modules is performed in a
locked view where the user is able to place, edit,
remove, save configurations, and obtain energy and
financial feedback.
3.3.1 Unlocked and Locked View Modes
The SolAR application has two distinct modes of
interaction: the locked view mode and the unlocked
view mode. These modes vary depending on the
context of the interaction.
When the application starts, by default, the
unlocked view mode is on, which corresponds to the
tracking and personalization mode of the application.
In this mode, it is not possible to add PV modules
matrices, as it is not comfortable to interact with PV
modules while the user keeps the arms stretched,
GRAPP 2023 - 18th International Conference on Computer Graphics Theory and Applications
134
pointing the device towards the facades. Therefore,
the actions with PV modules are carried out in the
locked view mode, with prior calibration being
recommended, in the unlocked view mode, so that the
experience is minimally realistic.
In the locked view mode, the image of the camera
and the representations of the walls are static.
However, it is possible to move the PV modules over
the representation of the wall. This corresponds to a
freeze feature (White, 2009), in agreement with what
was proposed by Nóbrega et al. (2015) to provide
more comfort to the user.
3.3.2 Placement of PV Modules Matrices
There are two possible modes in the application to
place PV modules: Automatic or Manual.
In Automatic mode, a matrix of PV modules is
created filling the wall in front of the user with the
maximum number of PV modules that fit on that
facade, both horizontally and vertically. In Manual
mode, the user is asked to input the number of lines
and columns of the matrix of PV modules to be
inserted.
Each PV module is represented by a
parallelepiped glyph in such a way that the object is
in front and aligned with the wall where it was placed.
These modules are organized according to rows and
columns of the PV modules matrix to which they
belong. By default, the centre of the object that
represents the PV modules matrix is placed in the
centre of the wall where the device points. The
algorithm developed for this purpose is described in
(Meireles, 2019).
After adding a matrix of PV modules in Manual
mode, the user can move it by dragging the finger on
the touchscreen until the PV modules matrix is
positioned where it is intended. The displacement of
the matrix is controlled to avoid exceeding the limits
of the wall where it is inserted. And, as there is space
on the wall for more than one matrix (unlike what
happens in the Automatic mode), the user can
continue to add more PV modules’ matrices, moving
them to the desired locations.
It is possible to add matrices of modules in more
than one wall if the user faces them when adding a
new matrix. For this, the matrices of PV modules are
stored together with the wall’s identifier where they
belong.
3.3.3 Selecting a PV Module Matrix
After adding the desired PV modules matrices on the
virtual walls, the user can select one of the matrices
already added by simply clicking with the finger on
the matrix he/she wants to choose. When a matrix of
PV modules is selected, it has a red outline that
highlights it at the interface to stand out and, at the
same time, not be confused with colors already
present in the augmented reality layer, due to the
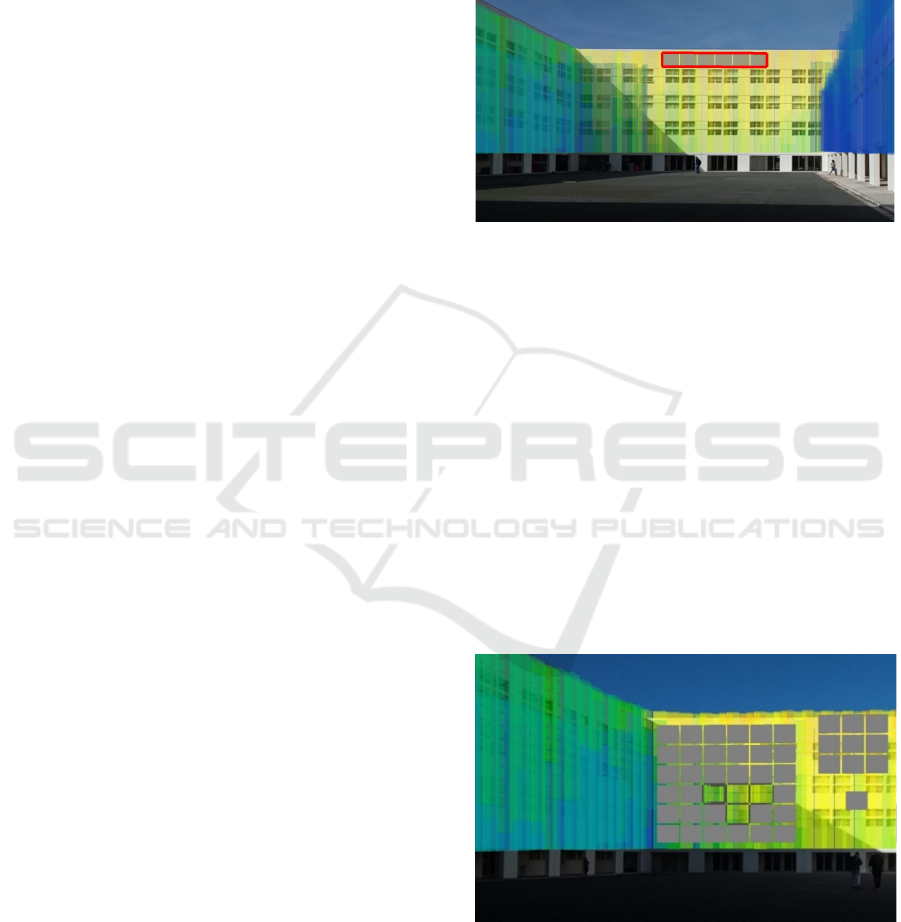
chosen color scale. Figure 1 shows the red outline of
a matrix that is selected, highlighting it.
Figure 1: Red outline in a matrix selected from the SolAR
application.
The user can simulate the placement of matrices
of PV modules encompassing more than one building
facade and, if focused on a given area of the building,
the user can move all the matrices of PV modules
already placed on the building’s facades, as long as
the screen shows the entire zone.
3.3.4 Editing, Deleting and Saving Options
Another option of the application allows the addition
or removal of modules, from a selected matrix, by
directly touching on the modules to be added or
removed. When the user removes a module from a
matrix, the place where the module was located
shows a dark gray outline.
Figure 2: Part of a screenshot of the SolAR application that
shows deleted PV modules in a matrix of PV modules.
Figure 2 shows an example of three matrices of
PV modules where the one on the left has four PV
modules eliminated - represented by the gray
Mobile Augmented Reality for Analysis of Solar Radiation on Facades
135
outlines. As this option is reversible, if the user clicks
on the location where the modules were located, these
modules reappear on the screen - and their contours
are eliminated.
In turn, the user may delete the selected matrix of
PV modules or delete all added PV modules.
It is also possible to view and edit a PV modules
matrices configuration saved in a previous session,
since at any time the user can save the configuration
he/she is working on - the information necessary for
that purpose is stored in the device's memory so that
it can be loaded whenever the application starts.
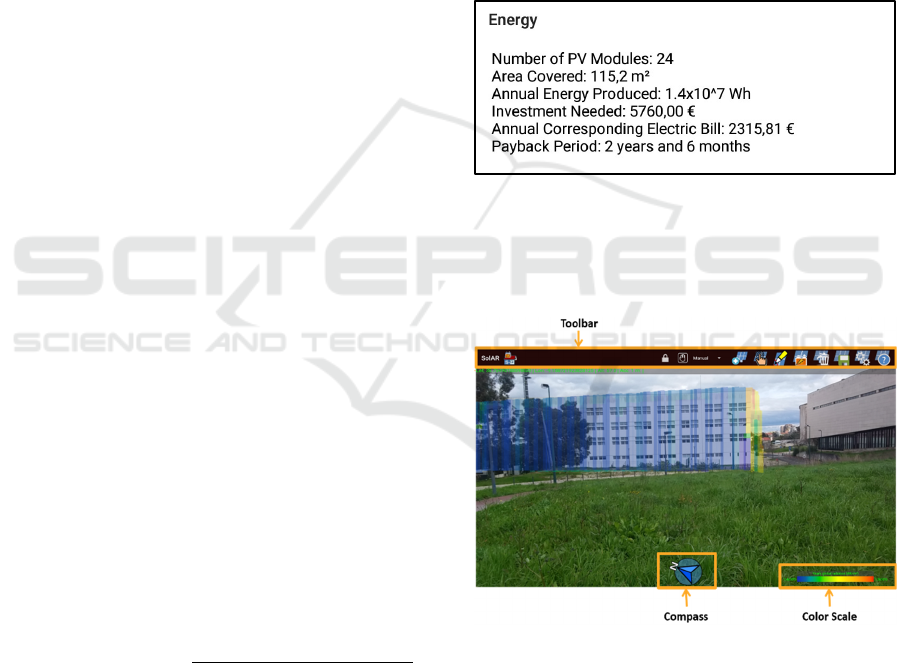
3.3.5 Energy and Financial Feedback
The Energy and Financial Feedback option of the
application displays the values for the following
variables concerning the configuration of matrices of
PV modules existing on the interface at the time this
option is selected:
- Number of PV modules;
- Area covered;
- Annual energy produced;
- Investment needed;
- Annual corresponding electric bill;
- Payback period.
These values are fundamental to the choice of the
PV system desired by the user.
To calculate the energy obtained by a
configuration of PV modules matrices, it is necessary,
for each PV module of each matrix added, to carry out
the following procedure:
1) Calculate the point on the wall (that is, the
point that makes up the grid that forms the wall)
closest to each of the vertices of the PV module;
2) Calculate the value of the Global Radiation
variable at each of the points calculated in 1;
3) Save the minimum value of the variable by
comparing the four values calculated in 2;
4) Calculate the energy with the value
returned in 3 considering the following formula, valid
for PV modules integrated into facades (BIPV):
𝐸𝑙𝑒𝑐𝑡𝑟𝑖𝑐𝑖𝑡𝑦 kWh /year
PVCE PR 𝑅𝑎𝑑𝑖𝑎tion
1000
where PVCE is the photovoltaic conversion
efficiency, with value 0.08, and PR is the
performance ratio, with value 0.8. Values for PVCE
and PR are discussed in Pillai et al. (2022), and in
Rodriguez-Martinez and Rodriguez-Monroy (2021),
respectively;
5) Add the value returned in step 4 for each of
the PV modules of the existing matrices;
6) Calculate the resulting value of energy
considering the units selected in the user interface
(Wh, KWh, MWh).
The financial payback of the PV system is defined
as the financial return time and can be estimated
considering that the user avoids buying electricity
produced by the PV modules from the electrical
network. The interface shows, not only the payback
amount, but also the annual electric bill
corresponding to the energy produced by the PV
system.
In the interface it is possible to change the
default values of the average cost and the investment
per area of the PV system. Figure 3 shows an example
of possible financial and energy feedback for a given
configuration of PV modules.
Figure 3: Dialog presenting the financial and energetic
feedback of a configuration of 24 PV modules covering an
area of 115.2m
2
.
3.3.6 Energy User Interface
Figure 4: Screenshot of the SolAR application identifying
its main components.
Figure 4 shows the overall appearance of the SolAR
application. The various items of the user interface
were positioned so as not to overlap with the
buildings that are shown in the drawing area. At the
top of the screen is the toolbar with buttons that give
access to the application's features such as
locking/unlocking the view, the addition of PV
modules and the financial and energy feedback of the
GRAPP 2023 - 18th International Conference on Computer Graphics Theory and Applications
136
module configuration placed. Immediately below this
bar, there is a line showing the GPS coordinates
(latitude, longitude, and altitude). At the bottom of the
screen are the compass and the color scale.
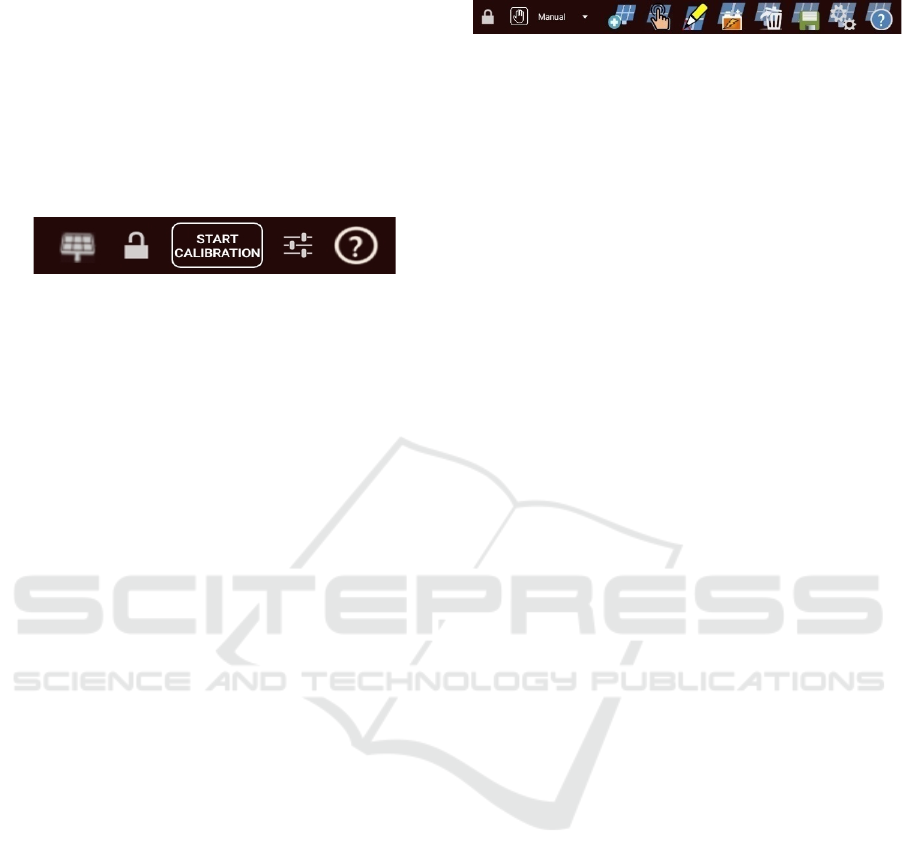
The Unlock view Toolbar
As actions with PV modules are carried out in the
locked view mode, in the unlocked view mode the
toolbar has few buttons (Figure 5).
1 2 3 4 5
Figure 5: Screenshot of the buttons present in the Toolbar
in the unlocked view mode.
Numbering the five elements, from left to right,
the caption of the corresponding functionalities is as
follows:
1) Alerts the user of the need to perform the
calibration and then lock the view to insert PV
modules;
2) Switches between locked and unlocked
view;
3) Starts the manual calibration to align the
visual walls with the “real” walls that appear in the
camera preview;
4) General customizations of the application,
namely the change of the size of the walls’ glyphs, the
color scale, the units presented in the color scale and
the variable to be visualized;
5) Help option.
The Locked view Toolbar
The locked view toolbar contains the buttons to
perform the operations with the PV modules (Figure
6). Numbering the ten elements, from left to right, the
caption of the corresponding functionalities is as
follows:
1) Return to the unlocked view mode;
2) Select placing PV modules mode: Manual
or Automatic;
3) Add matrices of PV modules;
4) Select matrices of PV modules already
placed to reposition them;
5) Edit a selected matrix, removing or
reinserting PV modules from it;
6) Return energy and financial feedback of the
current configuration of PV modules;
7) Delete the selected matrix or all added
matrices;
8) Save the current configuration of PV
modules matrices;
9) Set PV modules parameters;
10) Help options.
1 2 3 4 5 6 7 8 9 10
Figure 6: Part of the Toolbar of the locked view mode of
the SolAR application. The Button 2 shows the Manual
mode chosen.
4 USER TESTS
The developed application was evaluated by a group
of volunteers, selected to cover various age groups
and specialties, through interviews. This step made it
possible to assess the application's functionalities and
collect information on users' satisfaction as well as
criticisms and suggestions that could be used in the
future to enrich the SolAR application.
4.1 Participants
The user tests included 32 volunteers from different
age groups: 11 (34%) belonging to the age group 18-
25, 9 (28%) to 26-35, 5 (16%) to 36-45, 3 (9 %) to
46-55 and 4 (13%) to 56-65.
Regarding the study area, we can separate the
participants into three different categories:
Informatics (12 participants), Specialists (8
participants) and Others (12 participants). The
Specialists group included users of GIS (Geographic
Information Systems), Geospatial Engineering and
Energy, since these three areas are directly related to
the data used by the application, therefore there is a
more specialized opinion by these users. The
“Others” group joined the users from dispersed areas
who did not exist in sufficient number to be grouped
more finely. Among them are people from Arts,
Economics and Information Management. The
opinion of the Experts was particularly important for
the evaluation of the current version of the
application, given the new features in the locked view
mode. However, it was important to test the SolAR
application with an audience from different areas
since it is not intended to limit its use to specialists.
This application must be able to be used by different
users with different experiences.
Considering their familiarity with smartphones or
tablets, most users were comfortable with the use of
these devices. On a scale of 1 to 5, with 1 being “Not
Familiar” and 5 “Very Familiar”, 21 participants
(66%) rated themselves as “Very Familiar” (Level 5),
6 (19%) with a Level 4 familiarity, 3 (9%) with a
Level 3 familiarity, 1 (3%) with a Level 2 and 1 (3%)
as “Nothing Familiar” (Level 1).
Mobile Augmented Reality for Analysis of Solar Radiation on Facades
137

4.2 Apparatus
User tests were performed on a Samsung Galaxy Tab
A tablet with the Android operating system. This
device has 1920 x 1200 pixels of resolution, a screen
size of 26.7 cm (10.5 inches) and an Octa Core
Processor of 1.8 GHz. The device also integrates two
cameras (front and rear), an accelerometer,
gyroscope, magnetometer, and GPS.
4.3 Procedure
User tests were carried out in the courtyard of FCUL
building C6. This building was chosen because it has
vast wall areas available for placing matrices of PV
modules. At the beginning of each test, a brief
introduction was made about the SolAR application
and the evaluation that would be carried out. The test
was divided into four distinct parts: first, the users
answered a demographic questionnaire; then, all
elements of the SolAR application interface were
presented; afterwards, the user was asked to perform
a set of tasks; and, finally, the user answered some
open-ended questions - whose main purpose was to
identify possible improvements and inconsistencies
in the SolAR application –, a 5-point Likert scale
questionnaire to assess the relevance of the added
features and a System Usability Scale (SUS) test
(Brooke, 1996).
The interviewer allowed users to interact with the
application before the tasks started, but most wanted
to move directly to the tasks, saying they did not feel
the need for initial "training".
4.4 Tasks
The users were asked to complete four tasks. The
tasks were designed to give some freedom of
interaction to the user, allowing the interviewer to
observe the solution adopted by the user to
accomplish the task. The interviewer observed the
way the participant interacted with the application,
pointing out hesitations, doubts, notes, and mistakes
made.
In the first task, the user was asked to add PV
modules, with horizontal orientation and larger
dimension, using the Automatic mode, to the wall in
front of him/her; the user was then asked to select the
application's financial and energy feedback option.
In the second task, the interviewer emphasized the
high payback period of the solution obtained in the
previous task, asking the user to improve the solution.
In this task, it was intended to verify if the user would
use the Edit option to remove the PV modules - from
the previously added matrix - that were more in the
shade, or if the user would opt to delete the PV
module matrix added in the first task, adding later a
new matrix in the Manual mode in an area with higher
solar irradiation. In the end, the user was asked to
obtain financial and energy feedback of the new
solution.
In the third task, the user was asked to place 5 PV
modules to obtain a higher profit. In this task, it was
intended to observe the mode of placement of the PV
modules chosen by the user, his/her management of
the addition of the five modules, as well as to observe
whether the participant positioned the PV modules in
the zones corresponding to the highest energy
efficiency. In the end, the user was asked to obtain
financial and energy feedback of the solution, and the
interviewer pointed out the values of the annual
energy produced and the payback period of the
solution.
In the fourth task, the user was asked to save the
final configuration of the five PV modules added in
the third task.
4.5 Results
Regarding the execution of the tasks, the interviewer
observed that, in the first task, where the user was
asked to use the Automatic mode to place PV
modules with a specific orientation and dimension,
50% of users first added the matrix and only then
sought to change its characteristics, which meant
adding the PV modules again.
In the second task, the user was asked to improve
the solution of the first task to increase its
performance. 26 participants (81%) chose to Edit the
existent solution (that is, removed the modules of the
matrix that were in areas with less solar irradiation
instead of eliminating it and creating a new solution,
using the Manual placement mode of PV module
matrices.
In the third task, when the user was asked to place
5 PV modules having in mind to obtain the greatest
profit, all users chose the Manual mode, with 13
participants (41%) opting for a line of PV modules on
the top of the wall (where there is, in fact, a higher
annual solar radiation value). Other users added
matrices of PV modules with more than one row and
then removed the excess modules. There were also
those who choose to add two matrices of PV modules
at the top of the facade. The energy feedback resulting
from the solution of this task was 3,4 × 10⁶ Wh for
63% of the participants and 3,3 × 10⁶ Wh for 25% of
the participants. Users who deviated from the values
of greater solar radiation did so for aesthetic reasons,
GRAPP 2023 - 18th International Conference on Computer Graphics Theory and Applications
138
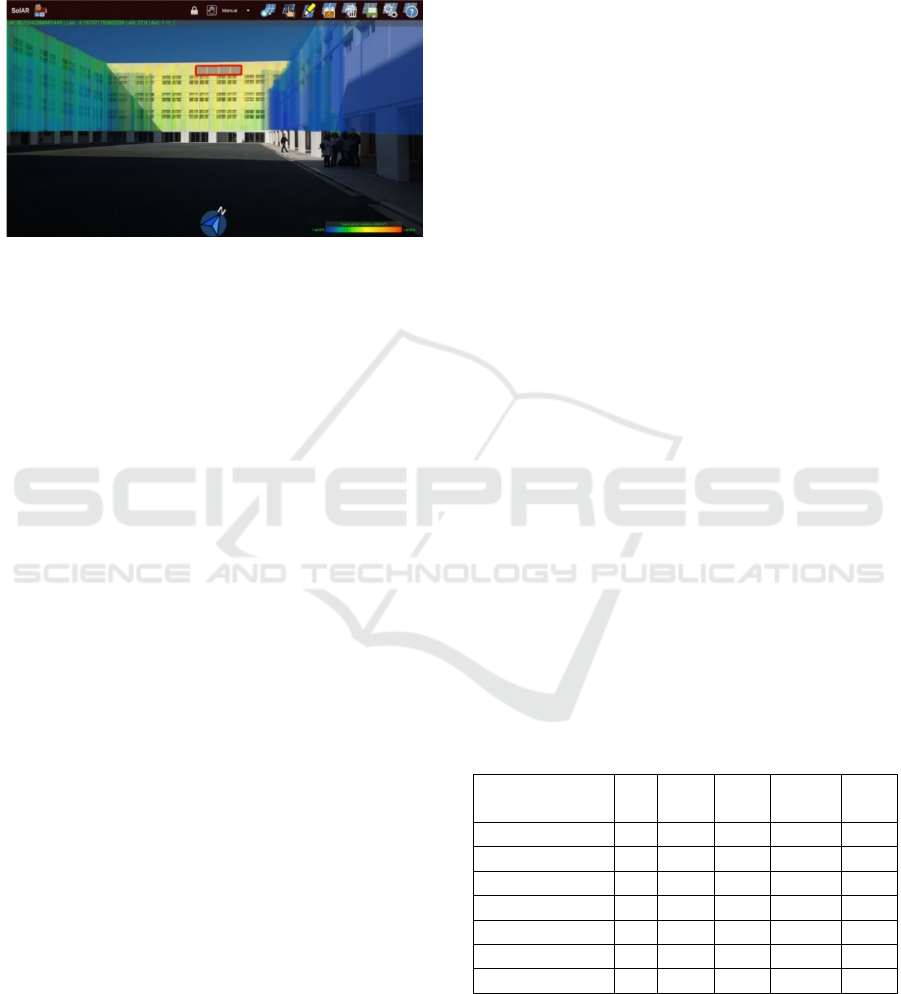
not because they misinterpreted the representation
used, namely the color scale. Figure 7 shows the
configuration of PV modules most chosen to
accomplish this task: a line of 5 PV modules at the top
of the facade.
Figure 7: Main configuration of photovoltaic modules
chosen to perform the third task.
In the fourth task, the user was asked to save the
current configuration of the matrices of PV modules.
All users accomplished the task without difficulty.
Although some users did not use the most direct
way to carry out the various tasks, in no situation did
they need help to accomplish them.
In terms of the answers to the open-ended
questionnaire, the participants suggested new
functionalities and improvements in user interaction.
The new features suggested were:
- Save different configurations of PV modules,
including their financial and energy feedback values;
- Besides the annual mean global radiation,
provide also global radiation data for each month of
the year;
- Enable the addition of different types of PV
modules such as the semi-transparent ones used for
windows;
- Provide an optimized solution for placing
matrices of PV modules, given certain input values,
for example, the existing budget;
- Make it possible to choose the dimensions and
orientation of the matrices of PV modules, through
the presentation of the existing interface for
configuring them, after selecting the add operation;
- Graphical presentation of the financial and
energy feedback values, in order to make these values
more intelligible;
- Enable the recognition of the physical windows
on the facades;
- Graphically display the different dimensions of
the PV modules, instead of just referring to their
length, width and depth dimensions;
- Change the icon of energy and financial
feedback to emphasize and remember that it also has
a financial aspect;
- Integrating a fake GPS application into SolAR
so that the application can solve the problem of
existing location uncertainty.
Regarding user interaction with PV modules the
most frequent suggestions were:
- Allow a more direct movement of the PV
modules, by simply clicking on the desired final
position for them, instead of having to accomplish
this task by continuously dragging the PV modules to
the location;
- Enable the selection of several matrices of PV
modules to delete.
- Delete more than one PV module at once by
dragging your finger over them;
- Allow the addition of PV modules to a wall using
only the touch of the user’s finger on it, instead of
having to select the “Add” button;
- Improve the application drag recognition;
- Add the possibility to zoom in on the matrices of
added PV modules, to facilitate their finer movement.
Concerning the relevance of the included
operations to deal with the PV modules, the users
answered a questionnaire with 7 items with answers
on a 5-point Likert scale: 1 corresponding to “Not
relevant” and 5 to “Very relevant”.
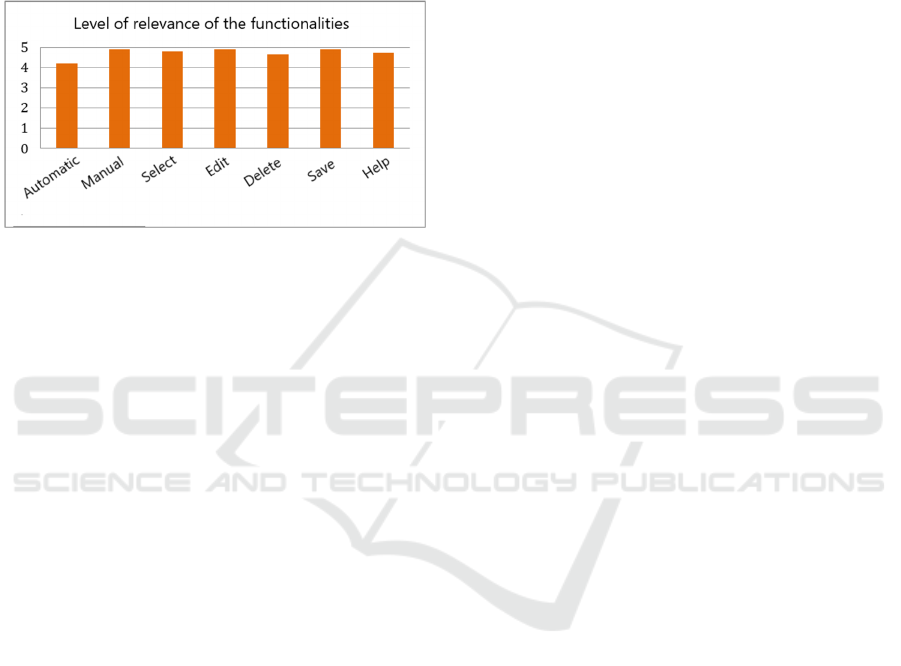
Table 1 shows the value of the mean, mode and
standard deviation, as well as the maximum and
minimum, of the answers for each of the features
assessed. The Automatic mode was the one that
generated the most antagonistic results, nevertheless,
with a mode of 5. On average, none of the features
was rated below 4 (Figure 8).
Table 1: Minimum, maximum, average, mode, and standard
deviation values corresponding to the relevance assessment
of each of the evaluated features.
Funcionalities Min Max Mean Mode SD
Automatic 1 5 4.2 5 1.10
Manual 4 5 4.9 5 0.30
Select 4 5 4.8 5 0.40
Edit 4 5 4.9 5 0.30
Delete 3 5 4.7 5 0.60
Save 4 5 4.9 5 0.30
Help 3 5 4.8 5 0.57
The usability of an AR application is extremely
important as 25 out of 90 survey respondents
commented that the usability of these applications is
generally bad, poor-looking, or contains a lack of
feedback (Kim, 2018).
Mobile Augmented Reality for Analysis of Solar Radiation on Facades
139
The SUS test allows the evaluation of the usability
of an application, as well as the user’s satisfaction
with it (Brooke, 1996). This test consists of a 10-
question questionnaire in which the answers are given
on a 5-point Likert scale 1 equivalent to “Totally
Disagree” and 5 to “Totally Agree”. For the tests, the
Portuguese version of SUS was used (Martins, 2015).
The SUS score ranges from 0 to 100; the SolAR
application got 88.
Figure 8: Graph representing the mean of the relevance
level, from 1 to 5, of the functionalities implemented, as
assessed by tests with the user.
4.6 Discussion
The tasks proposed in the user study allowed the
participants to perform all the operations available to
virtually install PV modules on facades.
The participants accomplished successfully all the
tasks proposed. When asked, in task 3, to obtain the
best performance with a given number of modules, all
participants used the Manual mode, and all placed the
PV modules in areas with a higher value of solar
irradiation. Moreover, in task 2, given an initial
solution that covered all the facade, the users were
able to identify which PV modules should be
removed to improve the solution. This means that all
the participants understood the representation of solar
radiation through coloured glyphs, realized how and
where to place the PV modules to obtain the best
energy efficiency, and used the operation to get the
energy and financial feedback of the conceived
configuration to assess their choice.
The need to update PV modules settings was not
so easy to understand, as 50% of the users did not
adjust the dimension and orientation of the modules
before adding them in task 1. As suggested by the
users, it would be easier to modify the settings after
choosing to add a PV modules matrix, not requiring
the user to previously access the definitions of the PV
modules.
The SUS test, to measure the usability of the
application, obtained a score of 88, which is an
excellent result according to Bangor et al. (2009).
Regarding each of the operations to place the PV
modules, although the automatic placement was not
appreciated by all the users, the assessments of the
operations obtained high scores with an average
above 4 and the mode equals 5, in a scale 1 to 5.
5 CONCLUSIONS AND FUTURE
WORK
The SolAR application evolved from a previous
version with the addition of functionalities to virtually
place matrices of PV modules in several facades of a
building and the presentation of information about
energy and financial feedback, as well as the
inclusion of a middleware component that allows
obtaining data on demand, according to the user’s
location. This middleware component also manages
data previously obtained and stored locally, avoiding
repeating their download.
The 32 volunteers that participated in the user
study to assess the application accomplished
successfully all the tasks proposed. They scored the
functionalities to deal with PV modules above 4, on
average, on a scale of 1 to 5, and their answers to the
SUS test revealed an excellent level of usability.
Future developments of the application will take
into account, besides the improvement of the
dragging interaction, the access to more data,
allowing the visualization of solar irradiation
monthly; the addition of new functionalities, such as
the installation of different kinds of PV modules for
windows and walls; the managing/storing of several
PV modules placement solutions, tested by the user,
with their respective energy and financial feedback,
and the creation of a recommendation approach to
guide the user to optimal configurations.
ACKNOWLEDGEMENTS
This work was supported by Universidade de Lisboa,
by the Portuguese Fundação para a Ciência e a
Tecnologia (FCT) through the LASIGE Research
Unit, ref. UIDB/00408/2020 and ref.
UIDP/00408/2020, and through IDL Research Unit,
ref. UIDB/50019/2020.
We also want to thank the participants in the user
tests.
GRAPP 2023 - 18th International Conference on Computer Graphics Theory and Applications
140

REFERENCES
Bangor, A., Kortum, P., & Miller, J. (2009). Determining
what individual SUS scores mean: Adding an adjective
rating scale. Journal of usability studies, 4(3), 114-123.
Brito, M. C., Freitas, S., Guimarães, S., Catita, C., &
Redweik, P. (2017). The importance of facades for the
solar PV potential of a Mediterranean city using LiDAR
data. Renewable Energy, 111, 85-94.
Brooke, J. (1996). SUS – A quick and dirty usability scale.
Usability evaluation in industry, 189.194, pp. 4-7.
Carmo, M. B., Cláudio, A. P., Ferreira, A., Afonso, A. P.,
Redweik, P., Catita, C., M.C, Brito, Pedrosa, J. N.
(2014). [Poster] Visualization of solar radiation data in
augmented reality. In 2014 IEEE International
Symposium on Mixed and Augmented Reality (ISMAR)
(pp. 255-256). IEEE.
Carmo, M. B., Cláudio, A. P., Ferreira, A., Afonso, A. P.,
Redweik, P., Catita, C., Brito, M. C, Silva, S., Meireles,
C. (2016). Augmented reality for support decision on
solar radiation harnessing. In 2016 23rd Portuguese
Meeting on Computer Graphics and Interaction
(EPCGI) (pp. 1-8). IEEE.
Graf, H., Santos, P., & Stork, A. (2010). Augmented reality
framework supporting conceptual urban planning and
enhancing the awareness for environmental impact. In
Proceedings of the 2010 Spring Simulation
Multiconference (pp. 1-8).
Guven, S., Feiner, S., & Oda, O. (2006). Mobile augmented
reality interaction techniques for authoring situated
media on-site. In 2006 IEEE/ACM International
Symposium on Mixed and Augmented Reality (pp. 235-
236). IEEE.
Honkamaa, P., Siltanen, S., Jäppinen, J., Woodward, C., &
Korkalo, O. (2007). Interactive outdoor mobile
augmentation using markerless tracking and GPS. In
Proc. Virtual Reality International Conference (VRIC),
Laval, France (pp. 285-288).
Kim, K., Billinghurst, M., Bruder, G., Duh, H. B. L., &
Welch, G. F. (2018). Revisiting trends in augmented
reality research: a review of the 2nd decade of ISMAR
(2008–2017). IEEE Transactions on Visualization and
Computer Graphics, 24(11), 2947-2962.
Lawitzki, P. (2014). Android Sensor Fusion Tutorial.
http://plaw.info/articles/sensorfusion/#articles
Li, W., Nee, A. Y. C., & Ong, S. K. (2017). A state-of-the-
art review of augmented reality in engineering analysis
and simulation. Multimodal Technologies and
Interaction, 1(3), 17.
Marques, B., Santos, B. S., Araújo, T., Martins, N. C.,
Alves, J., & Dias, P. (2019). Situated visualization in
the decision process through augmented reality. In 2019
23rd International Conference Information
Visualisation (IV) (pp. 13-18). IEEE
Martins, A. I., Rosa, A. F., Queirós, A., Silva, A., & Rocha,
N. P. (2015). European portuguese validation of the
system usability scale (SUS). Procedia Computer
Science, 67, 293-300.
Mehta, K., Sakhapara, A., Pawade, D., & Surve, V. (2020).
Novel Approach of Computing Optimal Placement of
Solar Panel Using Augmented Reality. In Advanced
Computing Technologies and Applications (pp. 533-
542). Springer, Singapore.
Meireles, C. B. (2019). SolAR: realidade aumentada para
apoio ao aproveitamento da energia solar em fachadas
de edifícios. Master thesis, Faculdade de Ciências da
Universidade de Lisboa. (Document written in
Portuguese).
Nóbrega, R., Cabral, D., Jacucci, G., & Coelho, A. (2015).
Nari: Natural augmented reality interface. In
Proceedings of the International Conference on
Computer Graphics Theory and Applications, GRAPP
(pp. 504-510).
Nurminen, A., Kruijff, E., & Veas, E. (2011).
HYDROSYS–A mixed reality platform for on-site
visualization of environmental data. In International
Symposium on Web and Wireless Geographical
Information Systems (pp. 159-175). Springer, Berlin,
Heidelberg.
Pillai, D. S., Shabunko, V., & Krishna, A. (2022). A
comprehensive review on building integrated
photovoltaic systems: Emphasis to technological
advancements, outdoor testing, and predictive
maintenance. Renewable and Sustainable Energy
Reviews, 156, 111946.
Rankohi, S., & Waugh, L. (2013). Review and analysis of
augmented reality literature for construction industry.
Visualization in Engineering, 1(1), 9.
Redweik, P., Catita, C., & Brito, M. (2013). Solar energy
potential on roofs and facades in an urban landscape.
Solar Energy, 97, 332-341.
Ritterbusch, S., Ronnås, S., Waltschläger, I., Gerstner, P.,
& Heuveline, V. (2013). Augmented reality
visualization of numerical simulations in urban
environments. International Journal of Advances in
Systems and Measurements, 6(1), 26-39.
Rodríguez-Martinez, Á., & Rodríguez-Monroy, C. (2021).
Economic Analysis and Modelling of Rooftop
Photovoltaic Systems in Spain for Industrial Self-
Consumption. Energies, 14(21), 7307.
Sauter, V. L. (2014). Decision support systems for business
intelligence. John Wiley & Sons
Scognamiglio, A., & Røstvik, H. N. (2013). Photovoltaics
and zero energy buildings: a new opportunity and
challenge for design. Progress in Photovoltaics:
Research and applications, 21(6), 1319-1336.
Soares, D. (2016). Serviços Web para uma aplicação de
Realidade Aumentada Master thesis, Faculdade de
Ciências da Universidade de Lisboa. (Document
written in Portuguese).
Voinea, GD., Girbacia, F., Postelnicu, C.C., Marto, A.
(2019). Exploring Cultural Heritage Using Augmented
Reality Through Google’s Project Tango and ARCore.
In: Duguleană, M., Carrozzino, M., Gams, M., Tanea,
I. (eds) VR Technologies in Cultural Heritage. VRTCH
2018. Communications in Computer and Information
Science, vol 904. Springer, Cham.
White, S., & Feiner, S. (2009). SiteLens: situated
visualization techniques for urban site visits. In
Mobile Augmented Reality for Analysis of Solar Radiation on Facades
141

Proceedings of the SIGCHI conference on Human
Factors in Computing Systems (pp. 1117-1120).
Willett, W., Jansen, Y., & Dragicevic, P. (2016). Embedded
data representations. IEEE Transactions on
Visualization and Computer Graphics, 23(1), 461-470.
GRAPP 2023 - 18th International Conference on Computer Graphics Theory and Applications
142
