
Differential Weight and Population Size of PRDE Traders: An Analysis
of Their Impact on Market Dynamics
George Herbert
Department of Computer Science, University of Bristol, Bristol, BS8 1UB, U.K.
Keywords:
Automated Trading, Financial Markets, Adaptive Trader-Agents, Differential Evolution.
Abstract:
This paper reports results from market experiments containing Parameterised-Response Zero-Intelligence with
Differential Evolution (PRDE) trader-agents. Each PRDE trader-agent in a market simultaneously uses dif-
ferential evolution (DE) to adapt their trading strategy to maximise profitability. Two parameters govern the
DE algorithm within each PRDE trader: the differential weight coefficient F and the number in population
NP. Markets containing a homogeneous population of PRDE traders exhibit significantly different dynamics
depending on the values of F and NP. The first part of this paper explores the effect that F and NP have
on the profitability of markets populated by PRDE traders. The latter part of this paper proposes a new al-
gorithm based on PRDE to maximise profitability: the Parameterised-Response Zero-Intelligence with JADE
(PRJADE) trader-agent.
1 INTRODUCTION
Adaptive automated trading algorithms have emerged
as a transformative force in contemporary financial
markets, enabling investors to harness the power of
advanced computational techniques to gain a compet-
itive edge in the marketplace. Through the use of
complex mathematical models and sophisticated al-
gorithms, these cutting-edge technologies can anal-
yse vast amounts of market data in real time, identi-
fying and exploiting trading opportunities with speed
and accuracy that were previously unimaginable. As
a result, the use of adaptive automated trading al-
gorithms has become increasingly prevalent and has
profoundly impacted how financial markets operate,
shaping the fabric of the global economy.
However, these algorithms have generated much
discussion and debate among experts, with some cau-
tioning against their potential drawbacks. For exam-
ple, the ‘flash crash’ in US financial markets on 6
May 2010, which saw the Dow Jones Industrial Aver-
age plummet almost 1,000 points in a matter of min-
utes, has been attributed partly to high-frequency trad-
ing algorithms aggressively reselling short-term po-
sitions to one another. Despite these concerns, it is
clear that these algorithms have become an inextri-
cable part of the contemporary financial landscape,
and their continued presence is all but guaranteed. As
such, researching these algorithms and their impact
on contemporary markets is crucial for investors and
researchers alike, to fully understand and navigate the
rapidly evolving world of financial technology.
This report focuses on the Parameterised-
Response Zero-Intelligence with Differential Evolu-
tion (PRDE) trader-agent, which Cliff recently intro-
duced in his research paper (Cliff, 2022b). The PRDE
algorithm uses differential evolution (Storn and Price,
1997) to continuously improve its trading strategy. In
his research, Cliff demonstrated that markets contain-
ing a homogeneous population of PRDE traders were
more economically efficient overall than a baseline
established when all traders used a simple stochastic
hill climbing strategy optimiser.
However, the PRDE traders implemented in
Cliff’s experiments did not vary in their parameter
values. This present study builds on Cliff’s research
by exploring the effects of altering the two critical pa-
rameters of the PRDE algorithm: the number in pop-
ulation NP and the differential weight F. The NP
parameter determines the number of strategies in a
PRDE trader’s private population, and the F param-
eter determines the amount of perturbation applied to
the strategies in the private population.
This present study examines the effects of chang-
ing these critical parameters on market dynamics us-
ing the Bristol Stock Exchange (BSE) (see (Cliff,
2012), (Cliff, 2018)), an open-source, high-fidelity
simulation of an LOB-based financial exchange. By
Herbert, G.
Differential Weight and Population Size of PRDE Traders: An Analysis of Their Impact on Market Dynamics.
DOI: 10.5220/0011885500003393
In Proceedings of the 15th International Conference on Agents and Artificial Intelligence (ICAART 2023) - Volume 1, pages 135-144
ISBN: 978-989-758-623-1; ISSN: 2184-433X
Copyright
c
2023 by SCITEPRESS – Science and Technology Publications, Lda. Under CC license (CC BY-NC-ND 4.0)
135

analysing the effects of changing F and NP on market
behaviour, we can gain insights into how these algo-
rithms influence market dynamics and how they can
be optimised to maximise profitability.
2 BACKGROUND
Gode and Sunder (Gode and Sunder, 1993) revo-
lutionised the field of experimental economics in
1993 with the advent of the Zero-Intelligence Con-
strained (ZIC) trader-agent. These agents, which gen-
erate quote prices uniformly at random from a pre-
defined range, were shown to reproduce surprisingly
human-like market dynamics. In their original pa-
per, Gode and Sunder defined the feasible range of
trading prices as [1, 200]. As such, a buyer with a
limit price of λ
B
would generate quote prices from
U(1, λ
B
), whilst a seller with a limit price of λ
S
would
generate quote prices from U(λ
S
, 200). Modern im-
plementations of the ZIC model do not rely on a priori
information about the feasible range, instead utilising
the lowest and highest values in the order book as the
bounds. Cliff and Bruten critiqued much of Gode and
Sunder’s work on ZIC in (Cliff and Bruten, 1997), but
the work that arose from the ZIC model is still widely
used in studying market dynamics. Many subsequent
zero-intelligence (ZI) and minimal-intelligence (MI)
trader-agents have stemmed from the work of Gode
and Sunder.
One such ZI trader-agent, Parameterised-
Response Zero-Intelligence (PRZI) (Cliff, 2021), was
recently introduced by Cliff. PRZI is a nonadaptive
generalisation of ZIC, in which the shape of the
probability mass function (PMF) used to generate
quote prices is governed by a strategy parameter
s ∈ [−1, 1] ∈ R. This s-value determines the degree
of ‘urgency’ or ‘relaxation’ in the trader’s behaviour.
As s → 1, the distribution is evermore biased towards
‘urgent’ quote prices—those closest to the least
profitable price for the trader but most likely to attract
a willing counterparty—conversely, as s → −1,
the distribution is biased towards ‘relaxed’ quote
prices—those that generate the most profit for the
trader but are considerably less likely to attract a
counterparty. When s = 0, the PMF is uniform,
identical to that of a ZIC trader.
PRZI with Stochastic Hill Climbing (PRSH)
(Cliff, 2022a) is an adaptive extension to PRZI, also
introduced by Cliff. The algorithm dynamically alters
the strategy parameter s in an attempt to increase prof-
itability. A given PRSH trader i maintains a private
local population S
i
of k strategy parameters, each of
which it evaluates via a loop to identify the most prof-
itable. The most profitable strategy is ‘mutated’ via a
stochastic mutation function to produce k −1 mutants,
and this set of k strategies constitutes the new S
i
.
PRZI with Differential Evolution (PRDE) (Cliff,
2022b) is Cliff’s latest adaptive extension to PRZI. It
replaces the simple stochastic hill climber in PRSH
with a DE optimisation system (Storn and Price,
1997). A given PRDE trader i maintains its own DE
system with a population of candidate s-values S
i
of
size NP ≥ 4 denoted by s
i,1
, s
i,2
, ..., s
i,NP
. Once trader i
has evaluated a particular strategy s
i,x
, three other dis-
tinct s-value are chosen at random: s
i,r
1
, s
i,r
2
and s
i,r
3
such that x 6= r
1
6= r
2
6= r
3
. A new candidate strategy
s
i,y
is constructed as follows:
s
i,y
← max(min(s
i,r
1
+ F
i
(s
i,r
2
− s
i,r
3
), 1), −1) (1)
where F
i
is trader i’s differential weight coefficient.
The fitness of s
i,y
is evaluated, and if it performs bet-
ter than s
i,x
, then s
i,y
replaces s
i,x
; otherwise, it is
discarded and the next randomly selected strategy is
evaluated. PRDE also includes a ‘mega-mutation’
mechanism to deal with convergence issues that arise
from s
i,r
2
−s
i,r
3
tending very close to zero in a highly-
converged population. Suppose at any time the stan-
dard deviation of the candidate s-values in trader i’s
private population is less than 0.0001. In that case, a
randomly selected candidate s
i,r
is given a value sam-
pled randomly from U(−1, 1).
3 HOMOGENEOUS
EXPLORATION OF F AND NP
3.1 Overview of the Combined Effect of
F and NP
According to Cliff’s research in (Cliff, 2022b), using
DE as the adaption mechanism for each trading entity
in a market can double the profit extracted through
traders’ interactions, compared to using a stochastic
hill climber as the adaption mechanism. However, in
his simulations, Cliff only experimented with F = 0.8
and NP = 4 for the PRDE traders. As such, the ini-
tial experiments in this paper serve as a follow-up: to
analyse the combined effect that different values of F
and NP have on profitability. I designed a set of ex-
periments with a similar setup as Cliff, in which BSE
was used to simulate a financial market for a single
abstract tradeable commodity. In each market simu-
lation, I implemented a homogeneous population of
N
T
= 30 PRDE traders with an equal number of buy-
ers N
B
and sellers N
S
(i.e. N
B
= N
S
= 15). The pop-
ulation in a given experiment was homogeneous with
ICAART 2023 - 15th International Conference on Agents and Artificial Intelligence
136

respect to the fact that all PRDE traders had the same
differential weight F and the same number in popu-
lation NP. Each simulation had what economists call
perfect elasticity of supply and demand. All N
B
buy-
ers were provided with a limit price of λ
B
= $140
per unit, while all N
S
sellers were provided with a
limit price of λ
S
= $60 per unit. This supply and de-
mand schedule produces a market in which every ac-
tive trader could, in theory, find a willing counterparty
to trade. In the simulation, after two traders engaged
in a trade, they were rendered inactive until their stock
was replenished, which occurred approximately ev-
ery five seconds. I ran each experiment for 100 sim-
ulated days on an Apple MacBook Pro with the M1
Pro chip, which took approximately three hours run-
ning at 800x real-time.
Figure 1 displays a heatmap showing the com-
bined profit extracted from the market by the popu-
lation of N
B
buyers and N
S
sellers. Since each exper-
iment used an identical quantity of traders and limit
prices, the theoretical maximum profit the trader-
agents could have extracted from each experiment
was also identical. As such, the actual total profit ex-
tracted is indicative of market efficiency. There is a
clear association between the configuration of F and
NP and the efficiency of the market. Namely, large
values of F combined with moderately large values
of NP produce more efficient markets. F = 2 and
NP = 14 produced the most efficient market; 3.75%
more profit was extracted than the F = 0.8 and NP = 4
configuration that Cliff used (Cliff, 2022b).
Figure 1: Relationship between different combinations of F
and NP, and the total profit extracted by all PRDE traders in
the market. The horizontal axis is F; the vertical axis is NP.
The intensity of pixel shading represents the total profit ex-
tracted from the market during a single 100-day simulation.
See text for further discussion.
Much of the relationship can be attributed to F
and NP’s influence over the ‘urgency’ of the traders.
There is a moderately strong positive correlation with
R
2
= 0.72 between the total amount of time the traders
in the market spent playing ‘very urgent’ strategies
(i.e. s > 0.5) and the total profit extracted from the
market, as evident in Figure 2.
Figure 2: Relationship between the amount of time traders
spent playing s-values greater than 0.5 and the total profit
extracted by all traders in the market. The line shows linear
regression; R
2
= 0.72. The horizontal axis is the cumula-
tive number of hours traders spent playing s-values where
s > 0.5; the vertical axis is the total profit extracted from
the market during a given 100-day simulation. See text for
further discussion.
To understand this relationship, one must consider
how the s-value of a given PRDE trader at a particu-
lar point in time affects the probability of it finding
a counterparty to trade. For a given trader, as s → 1
(i.e. increasingly ‘urgent’), the trader’s quote prices
are evermore likely to attract a counterparty; the re-
verse is true as s → −1 (i.e. increasingly ‘relaxed’).
Therefore, a strong relationship exists between the
amount of time the traders in the market are ‘urgent’
and the number of trades. Due to each experiment
having perfect elasticity of supply and demand, for a
given trade at price P, the seller’s profit can be de-
noted P − λ
S
, whilst the buyer’s profit can be denoted
λ
B
− P. Therefore, the combined profit is as follows:
(P − λ
S
) + (λ
B
− P) = λ
B
− λ
S
(2)
In other words, the profit extracted from the market
from any given trade is constant. As such, the total
profit extracted in a given 100-day market session is
directly proportional to the number of trades, which,
as mentioned, is related to the amount of time traders
in the market are ‘urgent’.
3.2 Analysis of the Effect of F
As mentioned, a significant amount of the variance
in the efficiency of the market can be explained by
Differential Weight and Population Size of PRDE Traders: An Analysis of Their Impact on Market Dynamics
137

the amount of time the traders spend playing s-values
greater than 0.5. To this end, the differential weight’s
influence on the total profitability can be primarily
attributed to how it influences the ‘urgency’ of the
traders. The market simulation data showed a mod-
erately strong positive correlation with R
2
= 0.77 be-
tween F and the amount of time the traders spent
playing s-values greater than 0.5, as shown in Figure
3.
Figure 3: Relationship between F and the amount of time
traders spent playing s-values greater than 0.5. The line
shows linear regression; R
2
= 0.77. The horizontal axis is
the differential weight coefficient F; the vertical axis is the
cumulative number of hours traders spent playing s-values
where s > 0.5 See text for further discussion.
This relationship manifests due to F’s impact on
the ‘urgency’ of the PRDE traders throughout the
market session. For larger values of F, the propor-
tion of traders playing with s > 0.5 increases signifi-
cantly faster. Figure 4 shows an example of this when
NP = 14. When F = 2, the proportion of traders
trading with s > 0.5 increased quickly: the seven-day
moving average of the percentage of traders playing s-
values that were s > 0.5 rose to over 60% after just 40
days. Conversely, when F = 0.8, the moving average
was only approximately 45% after the same amount
of time.
The reason for this effect can be explained math-
ematically. Taking the extreme example of F
i
= 0 for
trader i, the equation to derive a new candidate strat-
egy s
i,y
to replace s
i,x
becomes s
i,y
← s
i,r
1
. Therefore,
following the evaluation period of s
i,y
, the value of
s
i,x
can either remain the same or take on the value
of s
i,r
1
, in which case two or more of the s-values
in the local population S
i
will be identical—the ‘ge-
netic diversity’ will be reduced. The only time a
new s-value can be introduced into S
i
is when the
diversity of s-values becomes so constrained that a
‘mega-mutation’ occurs, in which case the algorithm
samples a new s-value from U(−1, 1). As a result,
the distribution of s-values in the entire population of
Figure 4: Plot of the percentage of traders playing s-values
of s > 0.5 from multiple 100-day experiments in a market
populated entirely by PRDE traders. The horizontal axis is
time, measured in days; the vertical axis is the proportion of
traders playing an s-value of s > 0.5. Each line is a seven-
day simple moving average of the percentage for different
values of F when NP = 14. See text for further discussion.
PRDE traders struggles to deviate significantly from
uniformity throughout the 100-day market session.
This uniformity ultimately produces a market con-
taining a wide range of both ‘urgent’ and ‘relaxed’
buyers and sellers, which is inefficient since many of
the more ‘relaxed’ traders will be unable to find a will-
ing counterparty. An example of such a distribution
of s-values can be seen in Figure 5, which displays a
heatmap of individual strategy values for the propor-
tion of 15 PRDE buyers when F = 0 and NP = 14.
While the case of F = 0 is extreme, I found experi-
mentally that the market increasingly exhibits the in-
efficient dynamics described here as F tends towards
zero.
Figure 5: Heatmap of individual s-values for the population
of 15 PRDE buyers in a market populated entirely by PRDE
traders with F = 0 and NP = 14. The horizontal axis is time,
measured in days; the vertical axis is the s-value pixelated
into 40 bins of size 0.05. The intensity of pixel shading in-
creases with the number of PRDE buyers in the population
currently trading with an s-value in the 0.05 range. See text
for further discussion.
ICAART 2023 - 15th International Conference on Agents and Artificial Intelligence
138

On the other extreme of the spectrum, when F =
2, a very different market dynamic tends to mani-
fest. This dynamic difference is evident in Figure 6,
which displays a heatmap for the 15 PRDE buyers
with F = 2 and NP = 14. Unlike the more uniform
distribution of s-values exhibited when F = 0, the s-
values in Figure 6 were bimodal at the two extremes
of s ≈ −1 and s ≈ 1, with the peak at s ≈ 1 slightly
more prominent. Moreso, both the buyers and sell-
ers displayed this behaviour. Again, this can be ex-
plained mathematically using the equation to derive a
new candidate strategy s
i,y
to replace s
i,x
. The value
of the differential weight F
i
is directly proportional to
F
i
(s
i,r
2
−s
i,r
3
). Thus, assuming s
i,r
2
−s
i,r
3
is non-zero,
the value of s
i,y
is more likely to be −1 or 1 as F
i
in-
creases. This bimodal distribution induces a market
dynamic in which there are very quickly many ex-
tremely ‘urgent’ and extremely ‘relaxed’ buyers and
sellers. It is this large number of urgent traders that
exist throughout the market session that enables a
large amount of profit to be extracted from the market.
Furthermore, I found experimentally that this bimodal
behaviour is ever more prominent for larger values of
F.
Figure 6: Heatmap of individual s-values for the population
of 15 PRDE buyers in a market populated entirely by PRDE
traders with F = 2 and NP = 14. The format is the same as
in Figure 5. See text for further discussion.
3.3 Analysis of the Effect of NP
The effect of the number in population on the mar-
ket’s efficiency is similarly primarily driven by its in-
fluence over the ‘urgency’ of the traders. However,
unlike the relationship with the differential weight,
the relationship between NP and the amount of time
traders spend playing s-values greater than 0.5 can-
not be modelled linearly. The data from the market
simulations showed that the relationship is highly de-
pendent on the value of F. For smaller values of F,
the influence of NP is significantly noisy. However,
for larger values of F, the relationship can best be
modelled using a quadratic curve, as shown in Fig-
ure 7. The quadratic demonstrates that the associa-
tion between NP and the ‘urgency’ of traders is more
complex and dynamic than a simple linear model can
capture.
Figure 7: Relationship between NP and the amount of time
traders spent playing s-values greater than 0.5 when F =
2. The line shows quadratic regression; R
2
= 0.96. The
horizontal axis is the number in population NP; the vertical
axis is the cumulative number of hours traders spent playing
s-values where s > 0.5 See text for further discussion.
This quadratic relationship can be explained as
the combined effect of two influencing factors. The
first influencing factor comes from NP’s effect on the
number of s-values greater than 0.5 that a given PRDE
trader i can sustain in its private population S
i
. The
second influencing factor comes from NP’s effect on
the time it takes the traders in the market to improve
on the initial random conditions.
As mentioned, larger values of F induce a bimodal
distribution of s-values at s ≈ −1 and s ≈ 1. Using
NP = 4 as an example, an individual trader can ac-
crue at most three s-values of s = 1, because once the
fourth s-value becomes 1, a ‘mega-mutation’ immedi-
ately occurs—this equates to a maximum of only 75%
of the s-values in their private population S
i
at s ≈ 1.
Conversely, when NP is larger, individual traders can
accumulate a more significant proportion of s-values
of s ≈ 1 in their private populations without a ‘mega-
mutation’. The ability to accumulate a more signifi-
cant proportion means that homogeneous populations
of PRDE traders with larger values of NP produce
a market dynamic with more ‘very urgent’ traders,
which produces a more efficient market. The effect
of NP is noisier for smaller values of F for the same
reason. As mentioned, the bimodal distribution is ever
less prevalent with smaller values of F, so the impact
of NP is less relevant as the ‘mega-mutations’ do not
occur as often, regardless.
The primary reason this trend is nonlinear is that
Differential Weight and Population Size of PRDE Traders: An Analysis of Their Impact on Market Dynamics
139

for very large values of NP, an inverse relationship
between NP and the number of ‘very urgent’ traders
in the market manifests. The inverse relationship is
because, for a given PRDE trader, the probability that
an s-value in the trader’s private population is selected
to be evaluated next is NP
−1
. Therefore, in homoge-
neous populations of PRDE traders with larger values
of NP, it takes significantly longer to iteratively im-
prove on the initial random conditions in the entire
local population of s-values. As a result, it takes sub-
stantially longer for the PRDE traders to accumulate
a large number of s-values greater than 0.5, meaning
the market is less efficient. On the furthest end of the
spectrum, as NP → ∞, the PRDE traders in the market
would be completely unable to improve on the initial
random conditions of the market.
4 PRDE IN A HETEROGENEOUS
MARKET
The experiments conducted in the previous section
were designed to build on the work in (Cliff, 2022b).
By using different combinations of F and NP in each
experiment, I was able to study the impact of these
parameters on market efficiency. The results showed
that the most profitable combination of F and NP was
22% more profitable than the least profitable.
However, the experimental setup was simplistic:
the markets were homogeneously populated and had
perfect elasticity of supply and demand. While this
provided highly interpretable results and an impor-
tant insight into the influence of F and NP on a ho-
mogeneous coevolutionary metapopulation of PRDE
traders, it did not accurately represent most contem-
porary financial markets. Most markets contain a pop-
ulation of distinct adaptive automated trading algo-
rithms and do not have perfect elasticity of supply and
demand. As such, I conducted a series of follow-up
experiments that better represented these contempo-
rary markets. The primary purpose of the follow-up
experiments was to identify any tangible association
between the performance of each combination of F
and NP in the two sets of experiments. By doing so, I
sought to identify whether a definitive ‘optimal’ com-
bination existed that would consistently provide max-
imum profitability, regardless of the market.
In each market simulation on BSE, I implemented
a population of N
T
= 20 traders with an equal num-
ber of buyers N
B
and sellers N
S
(i.e. N
B
= N
S
= 10).
In order to introduce a form of heterogeneity into
the market, each of the N
B
buyers and N
S
sellers
were comprised of five PRDE trader-agents and five
Zero-Intelligence Plus (ZIP) (Cliff and Bruten, 1997)
trader-agents. ZIP is a widely-studied MI trader-agent
that employs an elementary form of machine learning
and was one of the first trader-agents demonstrated
to perform better than humans (Das et al., 2001). All
PRDE traders in a given experiment had identical val-
ues of F and NP. To better represent contemporary fi-
nancial markets’ supply and demand curves, the N
B
buyers and N
S
sellers were provided evenly-spaced
limit prices in the range [60, 140]. In the simulation,
after two traders engaged in a trade, they were ren-
dered inactive until their stock was replenished, which
occurred approximately every five simulated seconds.
I ran each experiment for 100 simulated days.
Figure 8 displays a heatmap showing the com-
bined profit extracted from the market by the popu-
lation of 10 PRDE traders from each experiment. The
difference in profitability for different combinations
of F and NP was significant: the most profitable com-
bination of F and NP extracted 322% more profit on
average than the least profitable combination. While
some of this effect is likely due to stochasticity inher-
ent in market simulations, it suggests that one would
require a priori information about the market to de-
ploy a PRDE trader with a near-optimal choice of F
and NP.
Figure 8: Relationship between the differential weight co-
efficient F, the number in population NP and the total profit
extracted by all PRDE traders in the market. The format is
the same as in Figure 1. See text for further discussion.
Several loose similarities can be observed with the
heatmap from the previous set of experiments in Fig-
ure 1. However, there is no discernible statistically
significant relationship between the profitability of a
PRDE trader with a given combination of F and NP
in the homogeneous experiments and the same combi-
nation in the heterogeneous experiments, as evident in
ICAART 2023 - 15th International Conference on Agents and Artificial Intelligence
140

Figure 9. The lack of association indicates that the ef-
fect of F and NP is highly dependent on either traders’
behaviour, the supply and demand schedules, or, most
likely, a combination of both.
Figure 9: Relationship between the profitability per PRDE
trader in the homogeneous experiments and the heteroge-
neous experiments. The horizontal axis is the mean profit
per trader in a given homogeneous experiment for a spe-
cific combination of F and NP; the vertical axis is the mean
profit per PRDE trader in a given heterogeneous experiment
with the same F and NP. See text for further discussion.
It is evident that the heterogeneous markets with
stepped supply and demand schedules clearly exhibit
different behaviours from Figure 10. Unlike in the ho-
mogeneous experiments with perfect elasticity of sup-
ply and demand, there is no longer a linear relation-
ship between the cumulative time the PRDE traders in
the market spent playing ‘very urgent’ strategies (i.e.
s > 0.5) and the total profit they extracted. As such,
though larger F values still induce a more bimodal
distribution of s-values, the relationship between F
and the total profit extracted is not the same.
Figure 10: Relationship between the amount of time traders
spent playing s-values greater than 0.5 and the total profit
extracted by all PRDE traders in the market in the hetero-
geneous experiments. The format is the same as in Figure 2
See text for further discussion.
Profitability being dependent on certain condi-
tions is a common theme in the broader literature on
adaptive autonomous trader-agents. The ‘dominance’
of any given algorithm is often contingent on the
other trader-agents in the market (e.g. (Vach, 2015)).
Therefore, while there are clear values of F and NP
that produce consistently poor results, namely F = 0,
I cannot conclusively say that there exists any single
‘optimal’ combination that will consistently extract
the maximum profit.
5 EXTENDING PRDE
5.1 PRZI with JADE
In light of the problems with PRDE, this section intro-
duces a new MI trader-agent: PRZI with JADE (PR-
JADE), which replaces the DE algorithm in PRDE
with a variation of JADE (Zhang and Sanderson,
2009). JADE is a generational DE algorithm, and as
such, a given trader i maintains a population of can-
didate s-values for generation g denoted S
i,g
. Each
s-value in S
i,g
, denoted s
i,g,1
, s
i,g,2
, ..., s
i,g,NP
, is eval-
uated in turn to produce a population of candidate s-
values for the next generation S
i,g+1
. Once strategy
s
i,g,x
has been evaluated, three other distinct s-values
are chosen:
• s
p
i
i,g,best
is randomly chosen as one of the top p
i
%
of s-values in the population S
i,g
.
• s
i,g,r
1
is randomly chosen from the population S
i,g
such that s
i,g,r
1
6= s
p
i
i,g,best
.
• ˜s
i,g,r
2
is randomly chosen from S
i,g
∪ A such
that ˜s
i,g,r
2
6= s
i,g,r
1
6= s
p
i
i,g,best
, and where A is an
‘archive’ set of s-values: those s-values that pre-
viously failed in the selection process.
Once these three values have been selected, a new
candidate strategy ˆs
i,g,x
is constructed as follows:
ˆs
i,g,x
← s
i,g,x
+F
i,x
s
p
i
i,g,best
− s
i,g,x
+F
i,x
(s
i,g,r
1
− ˜s
i,g,r
2
)
(3)
The fitness of ˆs
i,g,x
is evaluated, and if it performs bet-
ter than s
i,g,x
then it is placed in index x in S
i,g+1
. Oth-
erwise, it is discarded, and the following strategy in
the sequence s
i,g,x+1
is evaluated.
The main benefit that PRJADE provides over
PRDE is that one does not need to initialise a PR-
JADE trader with a differential weight coefficient. A
given PRJADE trader i generates a new F
i,x
for each
new candidate strategy ˆs
i,g,x
. It does this according
to a Cauchy distribution with location parameter µ
F
i
Differential Weight and Population Size of PRDE Traders: An Analysis of Their Impact on Market Dynamics
141

and scale parameter 0.1, which it then truncates to 2
if F
i,x
> 2 or regenerates if F
i,x
< 0. Sampling F
i,x
from the Cauchy distribution helps produce diverse
differential weights centred around µ
F
i
, which can be
considered a ‘best guess’ at the optimal value for the
differential weight. µ
F
i
is initialised to one at the start
of the market session and then updated at the end of
each generation using the following rule:
µ
F
i
← (1 − c
i
)µ
F
i
+ c
i
∑
F∈F
i
F
2
∑
F∈F
i
F
(4)
where F
i
is a set of ‘successful’ differential weights—
those that yielded candidate strategies that increased
profitability in generation g for trader i. Figure 11
shows how a PRJADE trader optimised its private µ
F
value throughout a 100-day market simulation.
Figure 11: Plot showing how the µ
F
of a PRJADE trader
can adapt through the market session. The horizontal axis
is time, measured in days; the vertical axis is the µ
F
value
of a single PRJADE trader-agent. See text for further dis-
cussion.
Whilst PRJADE no longer requires the differential
weight to be explicitly specified, it requires two new
values: the rate of parameter adaption c and the greed-
iness of the mutation strategy p. However, Zhang and
Sanderson showed c and p to be insensitive to dif-
ferent problems in (Zhang and Sanderson, 2009), so
they offer an advantage over the differential weight F,
which I proved extremely sensitive to different market
conditions in the previous sections.
5.2 PRJADE vs PRDE
In order to evaluate the performance of PRJADE,
I took inspiration from IBM’s balanced-group tests
(Tesauro and Das, 2001). I conducted a series of ex-
periments in which an equal number of PRJADE and
PRDE trader-agents competed against one another in
the same market to identify which type of trader-agent
would extract the most profit. Since the performance
of the PRDE agent had been particularly susceptible
to varying the differential weight, I conducted three
sets of experiments with F = 0, F = 1 and F = 2
to determine whether PRJADE would be consistently
‘dominant’. I initialised both the PRJADE and PRDE
traders with NP = 14 in each experiment since the
PRDE traders yielded reasonable profitability in all
prior experiments with NP = 14. I initialised each
PRJADE trader with p = 20 and c = 0.2.
I ran each trial with N
T
= 20 traders, split evenly
between N
B
= 10 buyers and N
S
= 10 sellers. The
N
B
buyers and N
S
sellers comprised five PRDE
traders and five PRJADE traders each. Both groups
were assigned evenly-spaced limit prices in the range
[60, 140]. I ran each experiment for 100 simulated
days. In the simulation, after two traders engaged in
a trade, they were rendered inactive until their stock
was replenished, which occurred approximately every
five simulated seconds.
The boxplots in Figure 12 illustrate the results.
The PRJADE traders were consistently more prof-
itable than the PRDE traders, regardless of the
PRDE traders’ differential weight. Employing the
Wilcoxon–Mann–Whitney U test and the Fligner–
Pollicello robust rank-order distributional test proved
a statistically significant improvement in the perfor-
mance of the PRJADE traders across all three sets of
experiments at the 1% significance level. Thus, I can
be reasonably confident that PRJADE is ‘dominant’
over PRDE over a range of values of F. However, it is
clear from the boxplots that the degree to which PR-
JADE is more profitable than PRDE depends on the
differential weight of the PRDE traders. As such, fu-
ture work should explore more combinations of F and
NP to identify whether PRJADE is dominant defini-
tively.
6 CONCLUSION
This study has investigated the effects of the differen-
tial weight coefficient F and the number in population
NP on the dynamics of financial markets containing
PRDE traders. The first set of experiments focused
on a market containing a homogeneous population of
PRDE traders with perfect elasticity of supply and de-
mand. I identified a strong linear relationship between
the ‘urgency’ of the individual traders in these exper-
iments and the total profit extracted from the market,
which explained 72% of the variance in profitability.
In this respect, the effect of F on profitability could
be primarily attributed to its impact on this urgency: a
simple linear relationship with F could describe 77%
of the variance in urgency. I found that the contribu-
tion of NP was more complex but could also be at-
ICAART 2023 - 15th International Conference on Agents and Artificial Intelligence
142
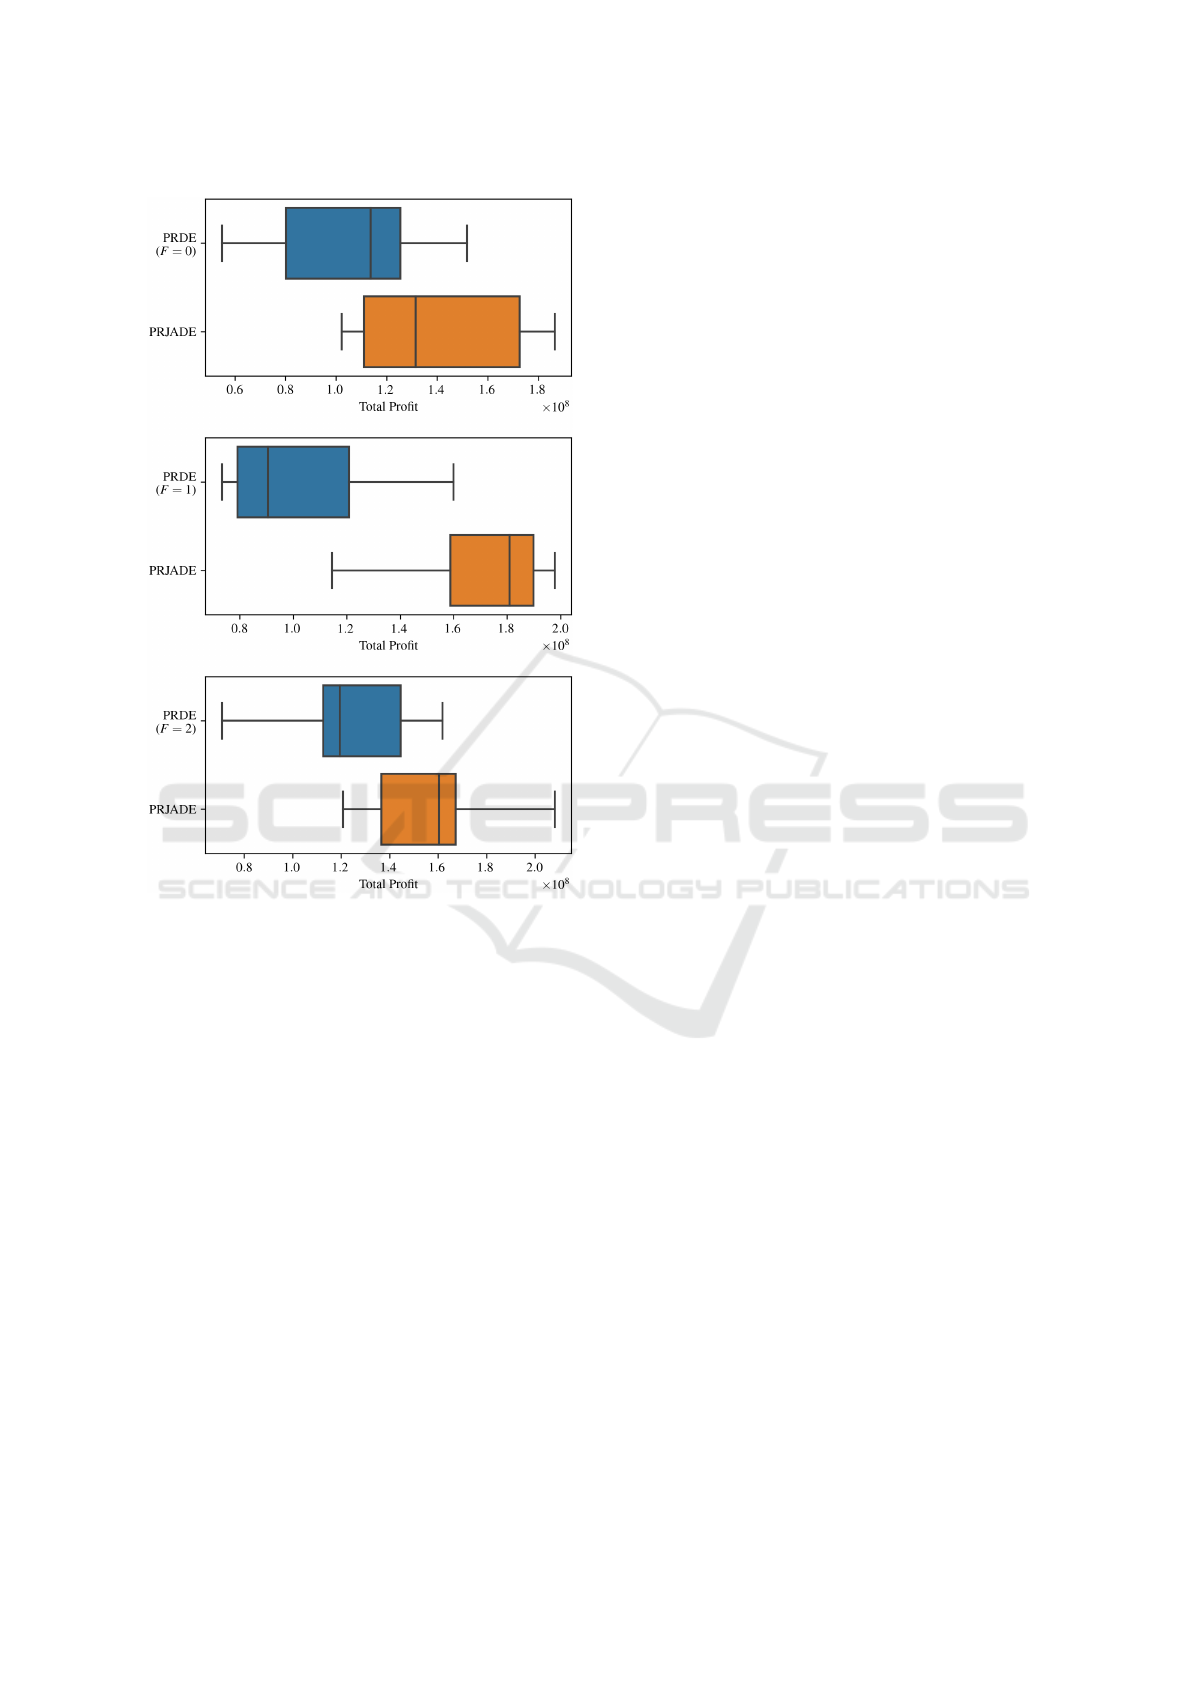
Figure 12: Three boxplots showing the performance of PR-
JADE against PRDE. In the top boxplot, all PRDE traders
were configured with F = 0; in the middle boxplot, all
PRDE traders were configured with F = 1; in the bottom
boxplot, all PRDE traders were configured with F = 2. In
all experiments, both PRDE and PRJADE were configured
with NP = 14. The horizontal axis is the combined profit
extracted from the market by traders running the same al-
gorithm (i.e. PRDE or PRJADE). See text for further dis-
cussion.
tributed to how it impacts the ‘urgency’, though the
relationship was nonlinear.
From the second set of experiments I conducted in
heterogeneous markets with stepped supply and de-
mand schedules, I identified that there appeared to
be no correlation between the profitability of combi-
nations of F and NP in different market conditions.
The lack of association means there is unlikely to be
an optimal combination that maximises profitability
across multiple markets. The optimal combination
depends on the other traders’ behaviour, the market’s
supply and demand schedules, or, most likely, a com-
bination of both. The lack of a market-independent
optimal combination highlighted one of the primary
limitations of the PRDE trader-agent. In that, de-
spite the extreme sensitivity of its profitability to the
parameters F and NP—especially in the heteroge-
neous experiments—the lack of an optimal combi-
nation means that one would almost require a priori
information about the market to extract a near maxi-
mum amount of profit.
To address these limitations, I proposed the PRZI
with JADE (PRJADE) trader-agent, an extension to
PRDE that incorporates a self-adaptive mechanism
for the differential weight parameter. This exten-
sion enables PRJADE traders to adjust their differ-
ential weight based on market conditions, thus elim-
inating the problems associated with the extremely
sensitive F parameter. The results indicate that PR-
JADE traders are more profitable than PRDE traders,
even when the PRDE traders are initialised with dif-
ferent values of F. However, further studies will be
required to test the effectiveness of PRJADE against
PRDE with different values of NP, and more values
of F, to confidently establish whether it consistently
outperforms PRDE. The results presented here also
invite another line of future work: exploring the ef-
fect on the market’s dynamics of the two new param-
eters in PRJADE, namely p and c. While Zhang and
Sanderson proposed that these two parameters are in-
sensitive to different problems in (Zhang and Sander-
son, 2009), future research should confirm that this
remains the case in PRJADE.
REFERENCES
Cliff, D. (2012). BristolStockExchange: open-source
financial exchange simulator. GitHub repository:
https://github.com/davecliff/BristolStockExchange.
Cliff, D. (2018). BSE: a minimal simulation of a limit-
order-book stock exchange. In 30th European Mod-
eling and Simulation Symposium (EMSS 2018), pages
194–203. DIME University of Genoa.
Cliff, D. (2021). Parameterised-response zero-intelligence
traders. SSRN: 3823317.
Cliff, D. (2022a). Co-evolutionary dynamics in a simu-
lation of interacting financial-market adaptive auto-
mated trading systems. In European Modeling and
Simulation Symposium (EMSS).
Cliff, D. (2022b). Metapopulation differential co-evolution
of trading strategies in a model financial market.
In European Modeling and Simulation Symposium
(EMSS).
Cliff, D. and Bruten, J. (1997). Minimal-intelligence agents
for bargaining behaviors in market-based environ-
ments. Technical report, Hewlett Packard Laborato-
ries.
Das, R., Hanson, J. E., Kephart, J. O., and Tesauro, G.
(2001). Agent-human interactions in the continuous
Differential Weight and Population Size of PRDE Traders: An Analysis of Their Impact on Market Dynamics
143

double auction. In IJCAI International Joint Confer-
ence on Artificial Intelligence.
Gode, D. K. and Sunder, S. (1993). Allocative efficiency
of markets with zero-intelligence traders: Market as a
partial substitute for individual rationality. Journal of
Political Economy, 101(1):119–137.
Storn, R. and Price, K. (1997). Differential evolution – a
simple and efficient heuristic for global optimization
over continuous spaces. Journal of Global Optimiza-
tion, 11(4):341–359.
Tesauro, G. and Das, R. (2001). High-performance bidding
agents for the continuous double auction. In ACM
Conference on Electronic Commerce.
Vach, D. (2015). Comparison of double auction bidding
strategies for automated trading agents. Master’s the-
sis, Charles University in Prague.
Zhang, J. and Sanderson, A. C. (2009). Jade: Adaptive
differential evolution with optional external archive.
IEEE Transactions on Evolutionary Computation,
13(5):945–958.
ICAART 2023 - 15th International Conference on Agents and Artificial Intelligence
144
