
Pattern Genomic Probes Inside Capillary Tubes by Magneto
Lithography Method Producing Parallel Detection of DNA and RNA
Amos Bardea
1,2 a
1
Holon Institute of Technology (HIT), Golomv Street, Holon, Israel
2
Faculty of Engineering, Holon Institute of Technology (HIT), Israel
Keywords: Lithography, Patterning, DNA Sensors, Parallel Sensing.
Abstract: Here we present a new technique that introduces the possibility to pattern inside closed volume using the
Magneto lithography (ML) method which allows the chemical patterning of the inside of the micro-channel
tube. The ML method is a bottom-up method but at the same time, it provides the desired high-throughput
capabilities for mass production. The ML method simplifies chemical surface patterning because it does not
require resist, which may contaminate the substrate. ML can also be applied for applications combining both
microelectronics and chemical patterning. Furthermore, ML does not depend on the surface topography and
planarity, and can pattern non-flat surfaces and the inside surfaces of a closed volume, therefore, ML allows
the chemical patterning of the inside of tubes.
1 INTRODUCTION
Magneto lithography (ML) is based on ‘‘patterning’’
a magnetic field on a substrate by applying a constant
magnet and using paramagnetic metal masks that
define the spatial distribution and shape of the applied
field. The second component in ML is ferromagnetic
nanoparticles that are assembled onto the substrate
according to the field induced by the mask. Similar to
Photolithography (Pease 2008), ML can be used to
apply either a positive or negative mode. In the
positive mode, the magnetic nanoparticles react
chemically or interact via chemical recognition with
the substrate. Hence, the magnetic nanoparticles are
immobilized at selected locations, where the mask
induces a magnetic field, resulting in a patterned
substrate. In the negative mode, the magnetic
nanoparticles do not interact chemically with the
substrate. Hence, once they pattern the substrate, they
block their site on the substrate. The exposed areas,
not covered by the nanoparticles, can at this stage, be
covered by molecules that chemically bind to the
substrate. After the binding of these molecules, the
nanoparticles are removed, resulting in a “negatively”
patterned substrate. We introduced the ML method,
in which a paramagnetic mask is applied for
a
https://orcid.org/0000-0002-0512-4120
patterning of surfaces with high throughput (Ito,
2000, Service 2001, Hoeppener 2003, Stewart 2007,
De Marco 2008). It can be easily applied for chemical
patterning surfaces (Li, 2003, McClelland 2002) and
for common microelectronic processes such as
etching and deposition with various magnetic masks,
permanent, dynamic and hard disk masks (Bandic
2003, Urbach 2003, Bardea 2009, Bardea 2017,
Bardea 2018). Here, we show the capabilities of ML
for patterning the inside of tubes by demonstrating
positive and negative ML processes and sequential
reactions made possible by these processes.
2 METHODOLOGY AND
RESULTS
As previously mentioned, the ability to apply the ML
method does not depend on the surface topography
and planarity; therefore, ML allows the chemical
patterning of the inside of tubes. The ML can pattern
the inside of tubes by applying either positive or
negative routes. Figure 1 shows the positive ML
process for patterning the surface of inner tubes (100-
μm inner diameter). The inner surface of a glass tube
was functionalized with mercaptosilane. Ten-
80
Bardea, A.
Pattern Genomic Probes Inside Capillary Tubes by Magneto Lithography Method Producing Parallel Detection of DNA and RNA.
DOI: 10.5220/0011872000003414
In Proceedings of the 16th International Joint Conference on Biomedical Engineering Systems and Technologies (BIOSTEC 2023) - Volume 1: BIODEVICES, pages 80-84
ISBN: 978-989-758-631-6; ISSN: 2184-4305
Copyright
c
2023 by SCITEPRESS – Science and Technology Publications, Lda. Under CC license (CC BY-NC-ND 4.0)
nanometer-diameter magnetic nanoparticles (Fe
3
O
4
)
were coated by fluorescein and sulforhodamine. A
magnetic field was applied on the tube by using a
permanent magnet. The fluorescein-labeled magnetic
nanoparticles were injected into the tube and
adsorbed at those sites where the magnetic field
gradient was maximal. Thereafter the tube was
washed with ethanol and the magnet field was shifted
to another site. Next, sulforhodamine-labeled
magnetic nanoparticles were injected into the tube
and they concentrated at the new site. This process
resulted in two fluorescence bands and profile of the
fluorescence signal as shown in Figure 1.
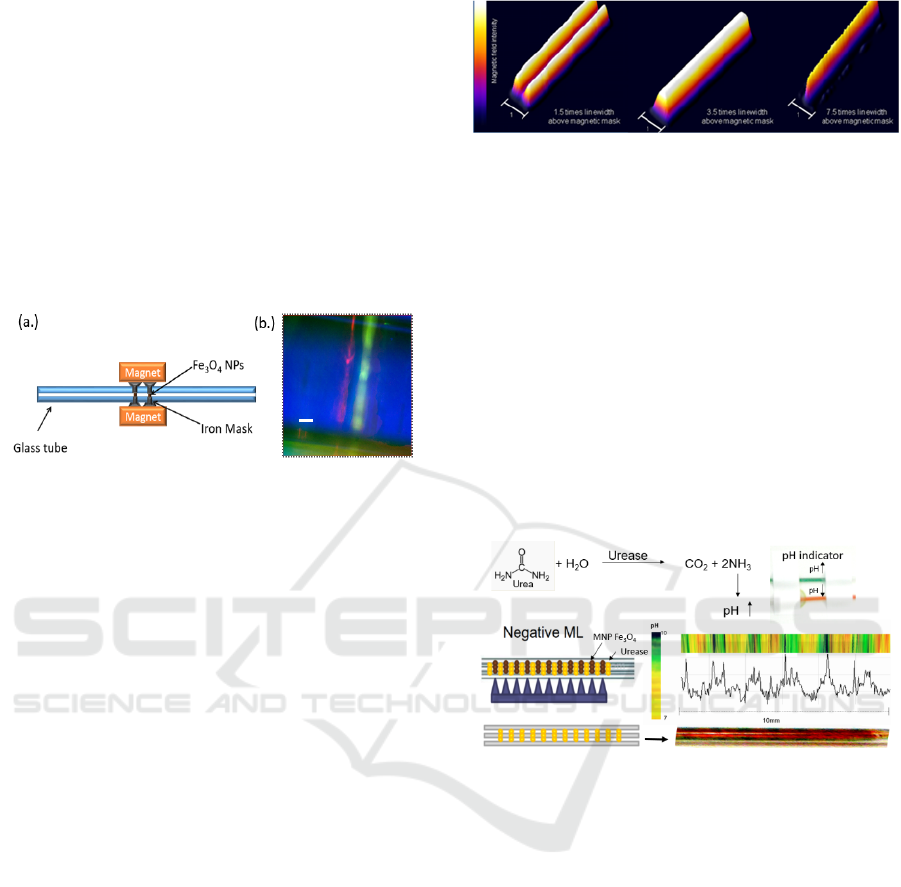
Figure 1: (a) A scheme describing the patterning of the
inner tube surface by applying positive ML. (b) The
fluorescence of both fluorescein and sulforhodamine
observed from the two bands of the nanoparticles adsorbed
within the tube.
In the ML process, we expose a substrate whose
surface is patterned by a magnetic field, to magnetic
NPs. The force applied on the magnetic NPs is given
by:
F=ΔχV(∇∙B)Bμ
0
-1
(1)
where B is the magnetic flux density (Tesla), Δχ is
the difference in susceptibility between an object and
its surroundings (10
3
-10
5
m
-3
for paramagnetic
materials in air), V is the volume (~1x10
-19
cm
3
for a
10-nm diameter particle), and μ
0
is the vacuum
permeability constant (1.2566 10
−6
H/m).
By carefully tuning the deposition time, it is
possible to obtain patterns whose width is narrower
than the width of the lines in the mask. This is due to
the gradient of the magnetic field within the line-
width defined by the mask. The magnetic field is
stronger in the center than at the edges. As a result,
the nanoparticles are first organized in the center of
the line. The simulation of the field on the mask as a
function of the distance from the mask demonstrates
an interesting property of ML, as shown in figure 2.
In the present work the average magnetic field on
the substrate is about 10
-2
Tesla. Decreasing the size
of the patterns, for example the width of a line, while
keeping good uniformity requires using smaller
particles, for example 2 nm particles. This size
of particles will allow achieving line widths of about
Figure 2: The magnetic field distribution above the mask,
as calculated using the COMSOL program. The field
distribution at distances of 1.5, 3.5, and 7.5 times the width
of the mask.
20±3 nm. Assuming that the magnetic dipole of the
NPs is proportional to its volume and that the gradient
of the field will increase proportionally with the field,
then the magnetic field required for working with 2
nm particles is about 0.1 Tesla. Such a field can be
easily applied in a dedicated ML system.
Figure 3 shows the negative ML process for
patterning the surface of inner tubes with enzyme and
we will reveal the localization of the reaction. Here,
the enzyme urease was patterned on the inside of the
500-µm diameter tube at different places using the
negative ML approach.
Figure 3: A scheme describing the multi-peg magnet for
applying ML in the tube. The color of a pH indicator
flushed in a solution of urea and pH indicator through a tube
patterned with the enzyme urease. The change in pH along
the tube, as obtained from the variation of the indicator’s
color.
The tube was exposed to a multi-peg magnet that
induced a magnetic field of 100 Gauss and a solution
of magnetic nanoparticles was injected into the tube.
The magnetic nanoparticles were arranged along the
tube according to the magnetic field induced by the
magnetic pegs, as shown in Figure 3. The urease
covalently bound to sites that were not protected by
the magnetic NPs. A solution containing urea and a
pH indicator was flown through the tube. At the
regions where the urease was patterned, the enzyme
decomposed the urea, producing NH
3
. As a result, the
pH in that region increased and the indicator changed
its color to green/blue at urease binding sites. As is
clearly shown in Figure 3, the high pH regions appear
as green spots inside the tube. The pH variation along
50μm
Pattern Genomic Probes Inside Capillary Tubes by Magneto Lithography Method Producing Parallel Detection of DNA and RNA
81
the tube can be analyzed, based on the change in the
color of the indicator.
A new method for DNA and RNA detection and
identification using ML is presented. The detectors
both DNA and RNA are determining the presence of
the pathogens and their level of activity. The apply
real time poly chain reaction (RT-PCR) are expensive
and not portable, therefore, the proposed producing
sensing device based on genomic probes inside
capillary tubes will enhance the portability and the
cost effectiveness of the detection process.
Furthermore, the RT-PCR is mostly linear and not
parallel. The new method is such RT-PCR located on
top of the surface along the inner capillary tube is
based on a Patterned Capillary Tube (PCT) in which
the internal surface of a glass tube is patterned with
rings of different single-stranded DNA probes. A
solution containing the single-stranded analytes flows
through the tube. Upon hybridization of appropriate
DNA and RNA from the solution, DNA polymerase
and reverse transcriptase (RT) are employed to
synthesize the complementary nucleic acids with
deoxynucleoside triphosphate (dNTP) labeled with
fluorophores. The sample-analyte hybrids are
detected by their fluorescence signal.
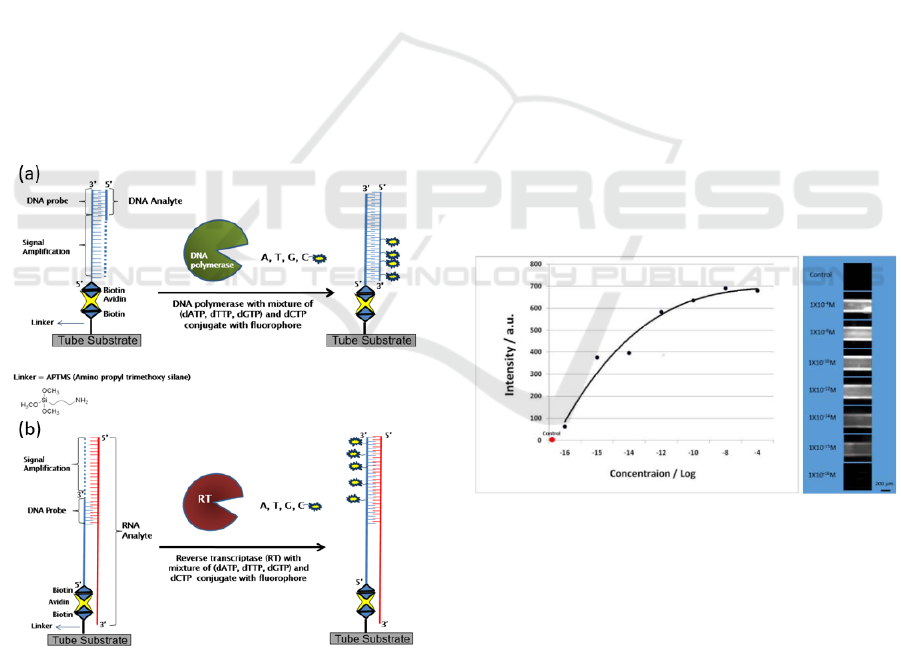
Figure 4: (a) A scheme describing the detection of DNA and
amplification of the signal by using DNA polymerase and
dNTPs, which include fluorescent dCTP. (b) A scheme
describing the detection of RNA and amplification of the
signal by using reverse transcriptase and dNTPs, which
include fluorescent dCTP.
This method is sensitive, fairly simple and can
detect both DNA and RNA simultaneously without
pre-treatment. It is based on the ability to pattern the
inner surface of a capillary tube with oligonucleotide
probe molecules in well-defined locations, and
subsequently flowing a solution containing the
analyte DNA, RNA, or both, through the tube. Upon
detection of appropriate DNA and RNA from the
sample, DNA polymerase and RT are employed to
synthesize the complementary nucleic acids with
dNTP labeled with fluorophores (Figure 4). The
formed hybrids are sensitively detected by their
fluorescence signal.
The detected fluorescence signal for injection of
1µl solution containing between 10
2
to 10
14
analyte
DNA molecules (equivalent to 10
-16
to 10
-4
M) is
shown in Figure 5. The number of molecules detected
was determined by appropriate dilution of a stock
solution. The signal was linear for solutions with
lower than 10
5
analyte molecules and it is saturated at
10
8
molecules. The detection sensitivity to the
number (rather than concentration) of molecules.
Specifically, the same number of molecules was
introduced into the tube, but they were dissolved in
different volumes of solutions; thus the
concentrations differed. The total volumes were
injected into the tubes at a rate of 40 µl min-1. The
signal intensity remained nearly constant, even when
the solution was diluted by four orders of magnitude.
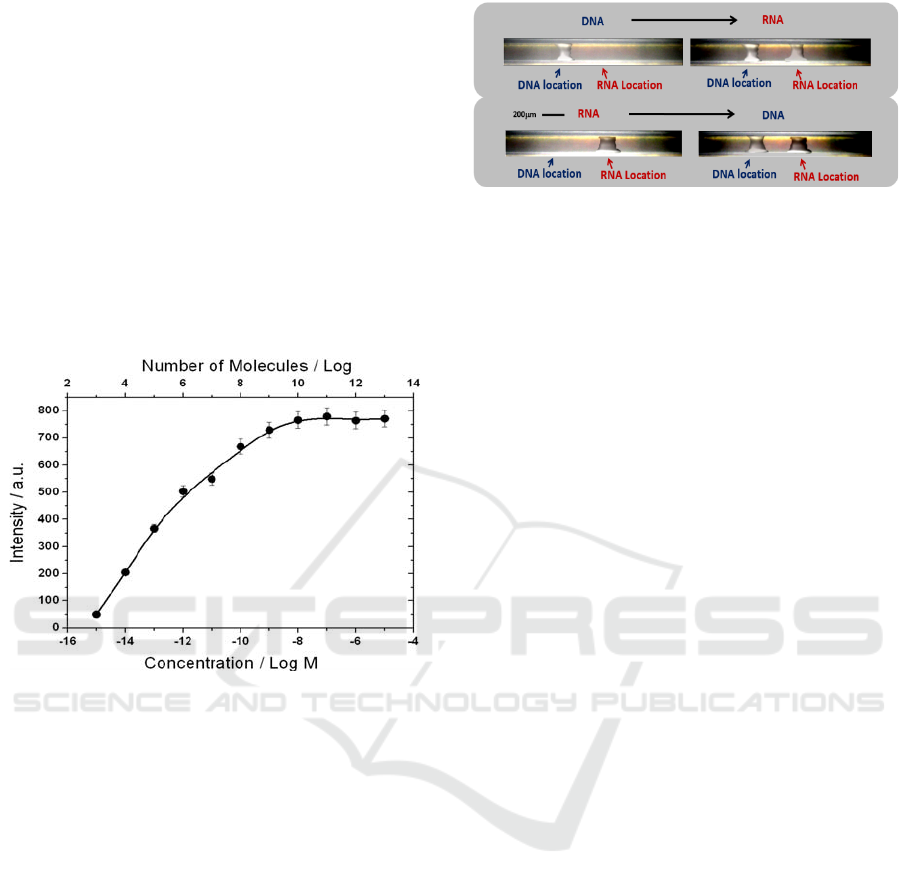
Figure 5: The fluorescence signal intensity of a DNA
analyte as a function of the number of DNA molecules
injected, spanning a concentration range of 12 orders of
magnitude.
RNA detection was studied by designing and
synthesizing a 40-base-long RNA that was used as
analyte. This analyte had two sections: 1) a 3’ end
region of 20 bases that complement the probe
(detector) sequence and 2) an additional section of a
3’ end region of 20 bases which is used as a template
for elongation. The second section included six
guanine bases, designed to incorporate six cytosine
fluorescent bases into the probe strand during RT
BIODEVICES 2023 - 16th International Conference on Biomedical Electronics and Devices
82
polymerization. Hence, six fluorescing chromophore
units were bound in every analyte-probe
hybridization event. The fluorescence signal
obtained, as a function of the RNA analyte
concentration, is shown in Figure 5. The signal
spanned a range of 10 orders of magnitude in the
RNA analyte concentration until reaching saturation
in the presence of 10
10
analyte molecules.
The sensitivity for native mRNA detection was
tested with an 80-base-long probe, where the 20 bases
at the 3’ end complement N. crassa actin mRNA. A
solution of 10
-11
M (10
7
molecules in 1 µl) total
mRNA, which is within the linear response range of
the device (Figure 6), was injected; the fluorescent
signal saturated after 20 minutes.
Figure 6: Concentration-dependent curve of a RNA analyte.
It is possible to use PCT without special sample
preparation and to characterize both DNA and RNA
from the same sample. Selectivity is obtained by
appropriate design and application of the “developing
solution”; to first include an enzyme that elongates
one type of oligonucleotide (i.e. DNA polymerase)
and subsequently injecting another developing
solution that contains the enzyme required for a
different elongation process (i.e. RT). This is
demonstrated in Figure 7, with a tube patterned with
dual-probes: one for DNA and one for RNA.
An analyte solution containing 1 pM of DNA was
first injected through the tube, followed by a solution
containing DNA polymerase and dNTPs. At this
stage, only the DNA probe was elongated, whereas
the RNA probe did not incorporate fluorescent
chromophores. After injecting a solution of 1 pM
RNA and addition of RT with dNTPs, the RNA probe
was elongated and fluorescence was observed at the
two sites. The reciprocal experiment was performed
with another patterned tube and showed similar
behavior.
Figure 7: Demonstration of specificity and selectivity of a
PCT, using a PCT patterned for both DNA and RNA
detection. A DNA analyte sample was injected into the
tube, followed by a “developing” solution containing DNA
polymerase with dNTPs. The DNA probe site fluoresces,
whereas the RNA probe site remains without signal.
Following injection of RNA analyte, and a developing
solution containing RT with dNTPs, the RNA site also
fluoresces. A reciprocal experiment is also presented.
Here we demonstrated the ability to pattern the
inside of a tube and to use the patterned substrate for
sensing and catalyzing reactions in spatially localized
regions. The new abilities demonstrated here open up
the possibility of inducing chemical and biochemical
patterning of the inner tube surfaces, especially when
using tubes with a small diameter as efficient for
sensitive detection and identification of DNA and
RNA, lab on a chip (LOC) and for DNA sequencing.
3 CONCLUSIONS
The ML can pattern the inside of tubes by applying
either positive or negative routes. The ability to
pattern tubes opens up new dimensions in sensors
development and applications. We report on a new
ultra-sensitive and fast technique for the detection and
identification of both DNA and RNA with detection
sensitivity of a few molecules based on ML method.
The new method is based on a Patterned Capillary
Tube (PCT) in which the internal surface of a glass
tube is patterned with rings of different single-
stranded DNA probes using ML.
REFERENCES
Pease, R. F., Chou, S. Y. (2008) "Lithography and other
patterning techniques for future electronics,"
Proceedings of the IEEE vol. 96, no.2, pp. 248-270.
Ito, T., Okazaki, S. (2000) "Pushing the limits of
lithography," Nature vol. 406, pp. 1027-1031.
Service R. F.
(2001) "EUV lithography - Optical
lithography goes to extremes - and beyond," Science
vol. 293, pp. 785-786.
Pattern Genomic Probes Inside Capillary Tubes by Magneto Lithography Method Producing Parallel Detection of DNA and RNA
83

Stewart M. E., Motala, M. J., Yao, J., Thompson, L. B.,
Nuzzo, R.G. (2007) "Unconventional methods for
forming nanopatterns," J. Nanoengineering and
Nanosystems vol. 220, pp. 81-138.
Hoeppener, S., Maoz, R., Sagiv, J (2003)"Constructive
microlithography: Electrochemical printing of
monolayer template patterns extends constructive
nanolithography to the micrometer-millimeter
dimension range," Nano Lett. vol. 3, pp. 761-767.
De Marco, C., Girardo S., Mele, E., Cingolania, R.,
Pisignano, D. (2008) "Ultraviolet-based bonding for
perfluoropolyether low aspect-ratio microchannels and
hybrid devices," Lab Chip vol. 8, pp. 1394–1397.
Li, H. W., Muir, B. V. O., Fichet, G., Huck, W. T. S (2003)
"Nanocontact printing: A route to sub-50-nm-scale
chemical and biological patterning," Langmuir, vol. 19,
pp. 1963-1965.
McClelland, G. M. Hart, M. W. Rettner, C. T. Best, M. E.
Carter, K. R. Terris, B. D. (2002) "Nanoscale patterning
of magnetic islands by imprint lithography using a
flexible mold," Appl. Phys. Lett. vol. 81, pp. 1483-
1485.
Bandic, Z. Z. Xu, H. Hsu, Y. Albrecht, T. R. (2003)
"Magnetic lithography using flexible magnetic masks:
applications to servowriting," IEEE Transactions on
Magnetics, vol. 39, pp. 2231-2233.
Urbach, A. R. J. Love, C. Prentiss, M. G. Whitesides, G. M.
(2003)"Sub-100 nm confinement of magnetic
nanoparticles using localized, magnetic field
gradients," JACS, vol. 125, pp. 12704-12705.
Bardea A., Naaman, R. (2009) "Magnetolithography: From
Bottom-Up Route to High Throughput," Small, vol. 5,
pp. 316-319.
Bardea A. Yoffe, A. (2017) "Magneto-Lithography, a
simple and inexpensive method for high throughput,
surface patterning,", IEEE Trans. on Nanotechnology,
vol. 16, no. 3, pp. 439-444.
Bardea A. (2018)“Novel approach of backside lithography
using dynamic magnetic mask” Int'l. Conf. on the
Science of Electrical Engineering (ICSEE).
BIODEVICES 2023 - 16th International Conference on Biomedical Electronics and Devices
84
