
Parkinson and REM Sleep Behaviour Disorder: HRV Difference
During Polysomnography
Parisa Sattar
1,2,3 a
, Giulia Baldazzi
3b
, Nicla Mandas
4,3
, Elisa Casaglia
2
, Michela Figorilli
2
,
Monica Puligheddu
2c
and Danilo Pani
3d
1
Department of Biomedical Sciences, University of Cagliari, Cagliari, Italy
2
Department of Medical Sciences and Public Health, Sleep Disorder Research Center,
University of Cagliari, Cagliari, Italy
3
Department of Electrical and Electronic Engineering, University of Cagliari, Cagliari, Italy
4
The Hardon Academy, Scuola Universitaria Superiore IUSS Pavia, Italy
nicla.mandas@iusspavia.it
Keywords: Heart Rate Variability, Parkinson Disease, REM Sleep Behavior Disorder, RBD.
Abstract: Approximately 40% to 70% of patients affected by Parkinson’s disease (PD) suffer from autonomic
dysfunction that could be related to REM sleep behavior disorder (RBD). In this work, polysomnographic
recordings were analyzed to study heart rate variability (HRV) during different sleep stages in a cohort of 20
participants, ten with Parkinson Disease with RBD (RBDpd) and ten unaffected (CG). HRV analysis was
performed by considering the first 5 min epoch from each stage (i.e., wake, N2, N3, and REM), including
time and frequency domain indexes, and entropy measures. Statistical analysis was carried out to assess any
possible significant difference between CG and RBDpd groups, but also between the wake and REM stages
in each group. Significant differences of the combined effect of RBD and PD emerged in both time and
frequency domains, but also when considering nonlinear parameters during REM and awake phases.
Accordingly, a comparison of wake and REM phase showed significant differences in all HRV parameters
for CG that was absent in the RBDpd group. Our findings reveal the potentiality of HRV as a digital biomarker
for RBDpd, by indicating distinct dysfunction of both parasympathetic and sympathetic activities in the
RBDpd group, partially in line with previous studies.
1 INTRODUCTION
Parkinson disease (PD) is one of the most common
neurodegenerative diseases that is often associated to
cardiac autonomic dysfunction. According to the
statistics, 40-70% of the PD patients experience
autonomic dysfunction (Chaudhuri, Healy, and
Schapira 2006). The type of autonomic dysfunction
can be well understood by analyzing the sympathetic
and parasympathetic activity of PD patients. Various
studies have used heart rate variability (HRV)
indexes to study the alterations in cardiovascular
autonomic system as it is a simple and non-invasive
method. Moreover, it is also one of the most
a
https://orcid.org/0000-0002-9461-0568
b
https://orcid.org/0000-0003-1275-4961
c
https://orcid.org/0000-0002-6837-6608
d
https://orcid.org/0000-0003-1924-0875
promising quantitative indicators of autonomic
balance based on cardiac rhythm (Acharya et al.
2006). HRV is a measure of the change in R-R
intervals duration and, indirectly, of the underlying
neurophysiological phenomena. Indeed, HRV is
driven by the autonomic nervous system (ANS)
activation, which reflects changes in parasympathetic
(PNS) and sympathetic nervous systems (SNS)
activities (Shaffer and Ginsberg 2017). HRV can be
evaluated using time domain, frequency domain, and
nonlinear measures.
Several studies have also employed HRV to
explore neurodegeneration, sleep and its associated
disorders such as rapid eye movement (REM) sleep
366
Sattar, P., Baldazzi, G., Mandas, N., Casaglia, E., Figorilli, M., Puligheddu, M. and Pani, D.
Parkinson and REM Sleep Behaviour Disorder: HRV Difference During Polysomnography.
DOI: 10.5220/0011838700003414
In Proceedings of the 16th International Joint Conference on Biomedical Engineering Systems and Technologies (BIOSTEC 2023) - Volume 4: BIOSIGNALS, pages 366-370
ISBN: 978-989-758-631-6; ISSN: 2184-4305
Copyright
c
2023 by SCITEPRESS – Science and Technology Publications, Lda. Under CC license (CC BY-NC-ND 4.0)

behavior disorder (RBD) or PD (Stein and Pu 2012).
HRV alterations have been investigated in PD
patients during wake stage , whereas other studies
also performed HRV analysis across combined non-
REM stages (i.e., N1, N2, and N3) versus REM
(Covassin et al. 2013). However, it is essential to
identify the alteration in HRV in different non-REM
phases because almost all PD patients experience
tremor and altered muscle tone, that impact both
REM and non-REM sleep phases. Moreover, studies
also reported that PD patients have a high probability
of developing RBD within 10 years after the
appearance of first motor signs (Jauregui-Barrutia et
al. 2010).
Interestingly, several studies on HRV revealed
that PD patients without RBD have reported
modulation in frequency components during
wakefulness compared to healthy subjects (Ke et al.
2017; Valenza et al. 2016). Moreover, HRV analysis
highlighted a stronger autonomic dysfunction
according to PD severity (Devos et al. 2003).
However, these studies only considered the impact of
PD on HRV and did not consider the impact of the
presence of RBD. On the other hand, in (Bugalho et
al. 2018; Sauvageot, Vaillant, and Diederich 2011)
considered both the impact of PD and RBD, reporting
variation in HRV without comparing it with healthy
participants.
From the aforementioned studies, it is evident that
the information about the variation in HRV due the
combined impact of PD and RBD was not completely
described. In addition, it could also be important to
analyze the SNS and PNS regulation in PD patients
with RBD (RBDpd) across each sleep phase, to
improve our knowledge about the development of
RBD and PD. Thus, in this study we aimed at
performing a preliminary evaluation of the combined
effect of PD and RBD using different HRV indexes
during sleep and wake stages.
2 METHODS
2.1 Participant
The study was approved by the Independent Ethical
Committee of the Cagliari University Hospital (AOU
Cagliari) and performed following the principles
outlined in the Helsinki Declaration of 1975, as
revised in 2000. The data from 20 participants
without cardiological disorders were taken from the
register of the Centre of Sleep Medicine and
Neurology Unit of the University Hospital of
Monserrato, Cagliari, Italy. The diagnosis of RBD
was based on the criteria of the International
Classification of Sleep Disorders (ICSD-3).
Participants were divided into two groups: the
control group (CG) was composed of ten participants,
80% females (mean age: 59.4 ± 4.9), without
neurological disorders, and the affected group was
composed of ten RBDpd patients, 70% females
(mean age: 70.5 ± 9.4), without other neurological
comorbidities. PD patients ranging between 1-3 in
HY scale, and between 0-55 in UPDRS scale, were
included in this study.
2.2 Heart Rate Variability Analysis
Full night video polysomnography exam was
performed, using EEG and PSG Holter Morpheus by
Micromed (Micromed S.p.A., Italy).
Sleep RT
program (Micromed S.p.A., Italy) was used to
perform sleep staging and produce the hypnogram,
further reviewed by an expert neurologist, in
accordance with the 2013 American Academy of
Sleep Medicine guidelines (van Hout 2013). ECG
was recorded, resampled at 512 Hz to perform HRV
analysis. The hypnogram was used to extract the ECG
of wake stage (before, during and after sleep) and
different sleep phases (N2, N3 and REM). To be
consistent in the analysis across the different patients
and sleep stages, we used the first 5-min artifact-free
epoch only.
A custom implementation of a wavelet-based
ECG delineator was employed to mark R-peak
locations (Martínez et al. 2004) and to obtain the
tachogram. An automatic tachogram correction
algorithm was introduced to compensate R-peak
misdetections, comparable to the commonly used
approaches in the field (Mendez et al. 2009). As such,
all the R-R intervals exceeding 150% of the average
R-R interval were considered as associated to the
presence of one or more false negatives; this
condition was managed by correcting the tachogram
with additional R-R intervals. Conversely, those
intervals below 15% of the average R-R interval were
considered as associated to the presence of a false
positive; this condition was managed by
automatically correcting the tachogram by discarding
those extra annotations. After all, only normal-to-
normal (NN) R-R intervals were maintained.
HRV analysis was first performed by using time
domain indexes, i.e., mean NN interval (NNmean),
root mean square of the differences between adjacent
NN intervals (RMSD), percentage of adjacent NN-
interval pairs with differences greater than 50 ms
(pR50), and percentage of adjacent NN-interval pairs
with differences greater than 20 ms (pR20).
Parkinson and REM Sleep Behaviour Disorder: HRV Difference During Polysomnography
367
We also evaluated HRV frequency-domain
indexes. To this aim, cubic spline interpolation of the
NN intervals was performed to obtain a tachogram
with a proper sampling frequency of 4 Hz. The power
spectrums in very low frequency (VLF) band [0.0033
0.04] Hz, low frequency (LF) band [0.046 0.158] Hz,
and high frequency (HF) band [0.158 0.400] Hz were
computed using the Welch’s periodogram method.
We also evaluated the power ratio between LF and
HF (LF/HF) and between VLF and LF (VLF/LF),
along with the normalized HF (nHF) and LF (nLF):
Finally, two nonlinear HRV indexes, i.e.,
approximate entropy (ApEn) and sample entropy
(SE), were used to examine the irregularity of the
tachogram. Both entropies calculate irregularity of a
signal by exploiting two parameters (i.e., the signal
length, m, and the tolerance, r). ApEn could be
sensitive to the data size whereas SE is independent
from data (Delgado-Bona and Marshak 2019).
2.3 Statistical Analysis
Statistical analysis was performed by using the
pairwise, non-parametric Wilcoxon rank sum test for
independent populations. Results were considered
significant for p < 0.05. Statistical differences were
investigated between CG and RBDpd groups, by
considering each HRV parameter computed in the
different sleep phases (i.e., wake, N2, N3 and REM)
separately. Furthermore, pairwise statistical analysis
was also carried out to investigate any possible
significant discrepancy between REM and awake
stages, independently in CG and RBDpd.
3 RESULTS
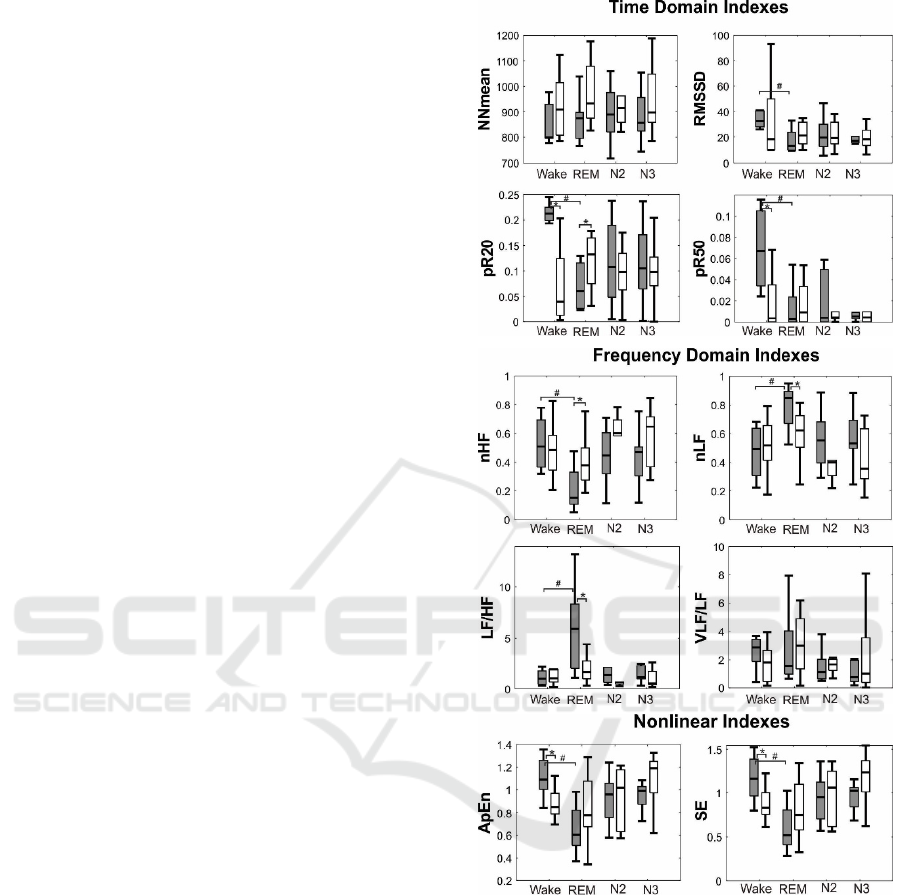
3.1 HRV Analysis Across the Groups
From Figure 1, we can perform a first comparison of
time-domain HRV indexes across groups (i.e., CG vs.
RBDpd). As can be seen, pR20 and pR50 were
significantly lower in RBDpd as compared to CG
group during wake phase (p<0.001 and p<0.02,
respectively). Conversely, pR20 was significantly
higher in RBDpd during REM phase (p<0.04). There
were no significant differences in other phases or
time-domain indexes.
Figure 1: HRV indexes for CG (in grey) and RBDpd (in
white) groups in different stages. The significant result for
CG vs. RBDpd analysis is represented as (*), whereas (#)
is adopted for wake vs. REM analysis.
The results of frequency-domain indexes are also
shown in Figure 1. A significant decrease was
observed in RBDpd group on nLF and LF/HF ratio
during REM phase, compared to CG, whereas nHF
was significantly higher in RBDpd compared to CG
in the same phase (p<0.02 for all). No significant
differences during REM phase were found during the
other phases.
Finally, Figure 1 also reports the results of the
nonlinear indexes. ApEn and SE both showed a
= ( + )
⁄
(1)
= ( + )
⁄
(2)
BIOSIGNALS 2023 - 16th International Conference on Bio-inspired Systems and Signal Processing
368

significant increase in RBDpd in comparison to CG,
but only during wakefulness (p<0.01 and p<0.03,
respectively).
3.2 HRV Analysis Within Groups
Figure 1 also highlights the significant differences in
HRV indexes within CG and RBDpd groups
comparing wake and REM phases . The results show
a significant decrease in all time-domain indexes in
REM phase when compared to wake phase in CG
group, except the NNmean one (p<0.001 for pR20,
pR50, and p<0.002 for RMSSD).
Similarly, significant differences were also
observed in CG for all frequency-domain indexes,
except for VLF/LF ratio. Indeed, nHF was
significantly higher in wake phase compared to REM
phase (p<0.002). However, nLF and LF/HF ratio
were significantly lower in wake phase as compared
to REM phase in the same group (p<0.002).
For nonlinear indexes, both ApEn and SE were
significantly higher in wake phase compared to REM
phase in CG group (p<0.001 for both). Conversely,
no significant results were found between the two
phases in the RBDpd group.
4 DISCUSSION
Based on our findings, HRV seems to be a reliable
digital biomarker to differentiate the PD people with
RBD from the unaffected ones. We found significant
differences of the combined effect of RBD and PD in
time-domain, frequency-domain and nonlinear
parameters between REM phase and wakefulness.
From the significant reduction of pR20 and pR50
in RBDpd group during wakefulness, we can deduce
a lower PNS activity than in the CG. These results are
in line with a previous study (Devos et al. 2003).
Moreover, during the REM phase, the pR20 is higher
in the RBDpd group, thus indicating an increased
PNS activity in contrast to CG, which was not
previously described in the scientific literature. Being
the decrease in PNS activity also associated with
stress condition, it may indicate that the wake phase
is more critical/stressful for RBDpd patients than
REM phase (Wang et al. 2018). In addition, for the
CG, most of the time-domain indexes were
significantly lower in REM phase, which implies a
reduced PNS activity compared to wakefulness. This
trend was absent in RBDpd group, thereby reflecting
possible PNS dysfunction.
Frequency-domain analysis showed that, during
REM phase, nLF decreased whereas nHF increased
in RBDpd compared to CG, thus indicating
alterations in SNS and PNS activity, respectively.
These findings are also in agreement with previous
studies (Ke et al. 2017; Valenza et al. 2016).
Interestingly, the behavior of nHF also complies with
the outcome of time-domain indexes, indicating
dominant PNS activity in RBDpd group during wake
phase, which emphasizes novel aspects of combined
influence of RBD and PD compared to CG.
Accordingly, the LF/HF ratio, which is a reliable
measure of SNS/PNS balance, it was found
considerably lower in RBDpd population compared
to CG, highlighting a disrupted PNS and SNS
response in RBDpd group.
Finally, the reduced value of nonlinear
parameters in RBDpd suggested a lack of normal
HRV during REM phase as compared to CG.
5 CONCLUSIONS
In this work, we used different HRV indexes to
analyze the effect of both PD and RBD when
compared to unaffected people, by considering wake,
non-REM, and REM phases. From our statistical
results, HRV seems to be a good digital biomarker to
differentiate between these populations, by indicating
distinct dysfunctions of PNS as well as SNS in the
affected people. However, the study also includes a
few limitations. First, the study did not consider the
disease severity, which could also impact the HRV.
Thus, conclusions cannot be generalized for all
RBDpd patients. Second, this study only focused on
the combined impact of RBD and PD. Finally, the
dataset size is limited. However, this preliminary
study proves that HRV is a potential digital biomarker
for RBDpd which can need to be further investigated
by analyzing different populations such as patients
with only PD or RBD. In future works, it would be
interesting to compare both the combined and
individual impact of RBD and PD that can assist in
early detection of phenoconversion with an increased
number of participants.
ACKNOWLEDGEMENTS
P. Sattar gratefully acknowledges PON R&I 2014-
2020, action IV.4, for her Ph.D. scholarship.
Parkinson and REM Sleep Behaviour Disorder: HRV Difference During Polysomnography
369

REFERENCE
Acharya, U. Rajendra, K. Paul Joseph, N. Kannathal, Choo
Min Lim, and Jasjit S. Suri. 2006. “Heart Rate
Variability: A Review.” Medical and Biological
Engineering and Computing 44(12):1031–51.
Bugalho, Paulo, Marcelo Mendonça, Tânia Lampreia, Rita
Miguel, Raquel Barbosa, and Manuel Salavisa. 2018.
“Heart Rate Variability in Parkinson Disease and
Idiopathic REM Sleep Behavior Disorder.” Clinical
Autonomic Research 28(6):557–64.
Chaudhuri, K. Ray, Daniel G. Healy, and Anthony H. v
Schapira. 2006. “Non-Motor Symptoms of Parkinson’s
Disease: Diagnosis and Management.” The Lancet
Neurology 5:235–45.
Covassin, Naima, Ariel B. Neikrug, Lianqi Liu, Jeanne
Maglione, Loki Natarajan, Jose S. Loredo, Barton W.
Palmer, Laura S. Redwine, and Sonia Ancoli-. 2013.
“Relationships between Clinical Characteristics and
Nocturnal Cardiac Autonomic Activity in Parkinson’s
Disease.” 171(0):85–88.
Delgado-Bona, Alfonso, and Alexander Marshak. 2019.
“Approximate Entropy and Sample Entropy: A
Comprehensive Tutorial.” Entropy 21(6).
Devos, D., M. Kroumova, R. Bordet, H. Vodougnon, J. D.
Guieu, C. Libersa, and A. Destee. 2003. “Heart Rate
Variability and Parkinson’s Disease Severity.” Journal
of Neural Transmission 110(9):997–1011.
van Hout, Steven. 2013. “The American Academy of Sleep
Medicine Inter-Scorer Reliability Program: Sleep Stage
Scoring Richard S. Rosenberg1.” Journal of Clinical
Sleep Medicine 9(1):81–87. doi: 10.5664/jcsm.2350.
Jauregui-Barrutia, Amaia, Beatriz Tijero-Merino, Juan
Carlos Gómez-Esteban, and Juan José Zarranz. 2010.
“Sleep Disorders in Parkinson’s Disease: REM Sleep
Behaviour Disorder and Restless Legs Syndrome.”
Revista de Neurologia 50:S15-9.
Ke, Jiang Qiong, Sheng Min Shao, Yuan Yuan Zheng, Fang
Wang Fu, Guo Qing Zheng, and Chun Feng Liu. 2017.
“Sympathetic Skin Response and Heart Rate
Variability in Predicting Autonomic Disorders in
Patients with Parkinson Disease.” Medicine (United
States) 96(18):1–5.
Martínez, Juan Pablo, Rute Almeida, Salvador Olmos, Ana
Paula Rocha, and Pablo Laguna. 2004. “A Wavelet-
Based ECG Delineator Evaluation on Standard
Databases.” IEEE Transactions on Biomedical
Engineering 51(4):570–81. doi: 10.1109/TBME.200
3.821031.
Mendez, Martin O., Anna Maria Bianchi, Matteo
Matteucci, Sergio Cerutti, and Thomas Penzel. 2009.
“Sleep Apnea Screening by Autoregressive Models
from a Single ECG Lead.” IEEE Transactions on
Biomedical Engineering 56(12):2838–50. doi:
10.1109/TBME.2009.2029563.
Sauvageot, Nicolas, Michel Vaillant, and Nico J. Diederich.
2011. “Reduced Sympathetically Driven Heart Rate
Variability during Sleep in Parkinson’s Disease: A
Case-Control Polysomnography-Based Study.”
Movement Disorders 26(2):234–40.
Shaffer, Fred, and J. P. Ginsberg. 2017. “An Overview of
Heart Rate Variability Metrics and Norms.” Frontiers
in Public Health 5(September):1–17.
Stein, Phyllis K., and Yachuan Pu. 2012. “Heart Rate
Variability, Sleep and Sleep Disorders.” Sleep
Medicine Reviews 16(1):47–66.
Valenza, Gaetano, Stefano Orsolini, Stefano Diciotti, Luca
Citi, Enzo Pasquale Scilingo, Maria Guerrisi, Sabrina
Danti, Claudio Lucetti, Carlo Tessa, Riccardo Barbieri,
and Nicola Toschi. 2016. “Assessment of Spontaneous
Cardiovascular Oscillations in Parkinson’s Disease.”
Biomedical Signal Processing and Control 26:80–89.
Wang, Man Ling, Pei Lin Lin, Chi Hsiang Huang, and Hui
Hsun Huang. 2018. “Decreased Parasympathetic
Activity of Heart Rate Variability during Anticipation
of Night Duty in Anesthesiology Residents.”
Anesthesia and Analgesia 126(3):1013–18. doi:
10.1213/ANE.0000000000002439.
BIOSIGNALS 2023 - 16th International Conference on Bio-inspired Systems and Signal Processing
370
