Deep Learning Assisted Plus Disease Screening of Retinal Image of
Infants
Vijay Kumar
1
, Vatsal Agrawal
2
, Shorya Azad
3
and Kolin Paul
1, 2
1
Khosla School of Information Technology, Indian Institute of Technology, Delhi, India
2
Department of Computer Science and Engineering, Indian Institute of Technology, Delhi, India
3
Keywords:
Fundus Image, Retinopathy of Prematurity (ROP), Plus Disease, Generative Adversarial Network (GAN),
U-Net, Blood Vessels Segmentation, Deep Learning (DL), Vessel Tortuosity.
Abstract:
Retinopathy of Prematurity (ROP) is the leading cause of blindness in premature infants in developing coun-
tries. The international classification of ROP (ICROP) classifies ROP based on location, severity, and stage.
Plus disease is a crucial feature in ROP classification. Plus is the most severe form of vascular dilatation
and tortuosity, and it causes severe ROP and visual loss if untreated. Despite decades of research, identify-
ing and quantifying Plus diseases is challenging. Understanding and detecting Plus in ROP patients can help
ophthalmologists provide better treatment, restoring vision to many infants with severe ROP. Hence, we have
proposed a robust Deep Learning-assisted framework for Blood Vessels map generation and analysis that may
effectively address the issue related to Plus disease screening and monitoring. We have extensively studied
various methods for computing and locating different blood vessel map features such as vessel branch point,
vessel width, vessel skeleton/centre-line, vessel segment tortuosity, etc. Additionally, we divided the branches
into two levels based on the width of the branches. For our investigations, we have used both local and public
databases. This work also includes a detailed analysis of these datasets’ vascular feature and their level.
To the best of our knowledge, none of the publicly available models could independently classify branches
and/or analyse the tortuousness based on the parent and child relationship of branches. For Plus, pre-Plus,
and Healthy infants, the average tortuosity index is 1.959, 1.1530, and 1.126, and the percentage of vessels
severely infected is 44%, 30%, and 20%, respectively. Moreover, our algorithm recognises and analyses many
vessels. The precision of many parameters is remarkable.
1 INTRODUCTION
Retinopathy of prematurity (ROP) is one of the most
common causes of retinal disease in preterm new-
borns across the world (Organization et al., 2019).
The International Classification of ROP (ICROP)
classifies ROP into three zones, and five stages based
on its anteroposterior position (area), severity (stage),
and vascular features (disease severity) (Chiang et al.,
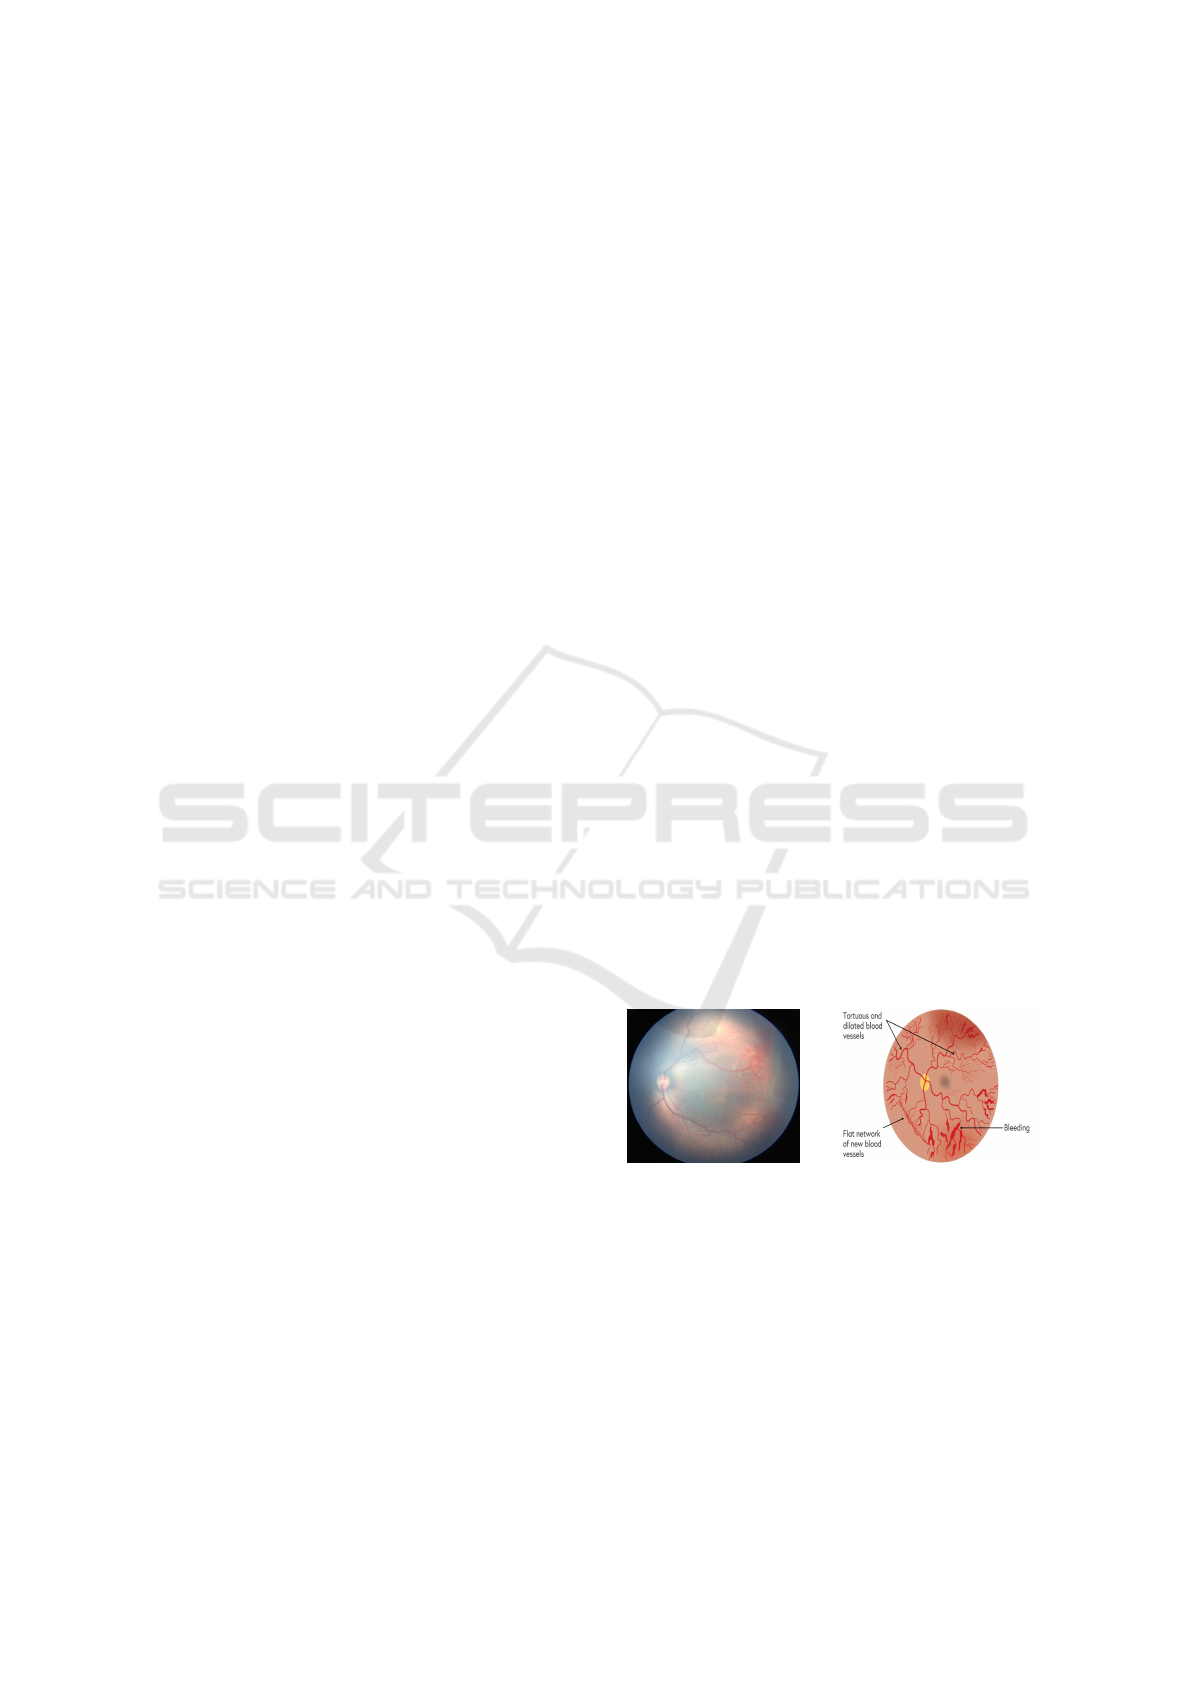
2021). Plus disease is another condition in which the
central and posterior retinal blood vessels become di-
lated and tortuous, as shown in Figure 1. In the ROP
disease classification system, Plus disease is a key
factor (Chiang et al., 2021). Plus disease causes per-
manent vision loss if left untreated. Additionally, the
neonatal care division and ophthalmologists have lim-
ited time to provide appropriate care, and prognosis
for these patients, which further worsens the condi-
tion and leads newborns to be at risk of ROP-induced
(a) ROP Zone-2 with Plus. (b) Plus disease symptoms.
Figure 1: Example infant’s retinal images with ROP-plus
disease.
visual impairment (Tian et al., 2019).
Classification of Plus disease is mostly based on
the tortuosity and dilatation of blood vessels (Tian
et al., 2019). Tortuosity refers to the curvature of
arteries and veins. Despite decades of scientific re-
search, it remains difficult to identify and quantify
vascular abnormalities (i.e., tortuosity and dilation)
accurately for Plus disease (Tian et al., 2019). Under-
538
Kumar, V., Agrawal, V., Azad, S. and Paul, K.
Deep Learning Assisted Plus Disease Screening of Retinal Image of Infants.
DOI: 10.5220/0011803700003414
In Proceedings of the 16th International Joint Conference on Biomedical Engineering Systems and Technologies (BIOSTEC 2023) - Volume 5: HEALTHINF, pages 538-545
ISBN: 978-989-758-631-6; ISSN: 2184-4305
Copyright
c
2023 by SCITEPRESS – Science and Technology Publications, Lda. Under CC license (CC BY-NC-ND 4.0)

standing vascular phenomena in ROP patients could
lead to the development of alternative treatment op-
tions that could restore the vision of a substantial
number of severely affected ROP patients. Therefore,
vessel analysis may be an effective strategy for ad-
dressing this problem.
Given its importance, authors have developed sev-
eral Plus disease diagnostic and classification algo-
rithms using image processing, computer vision, and
machine learning (ML) or deep learning (DL). In the
last few years, ML/DL algorithms have significantly
improved the performance of Plus disease diagnostic
and classification algorithms (Reid and Eaton, 2019;
Tian et al., 2019). Although DL-based methods can
accurately detect and classify Plus, they do not pro-
vide a comprehensive and quantitative understanding
of the disease. As a result, ophthalmologists often
cannot link the results of the DL-based approach to
clinical symptoms. Furthermore, DL-based systems
are data-driven and require a large amount of labeled
pathological data for training, testing, and validation.
In the case of ROP disease, acquiring many fundus
images of infants is difficult due to the lack of pub-
licly available datasets on the disease (Scruggs et al.,
2020). As a result, the advancement and usage of DL-
based methods in clinical use are restricted (Razzak
et al., 2018).
Therefore, this paper presents a solution for pro-
viding interpretable results, which can be used in clin-
ical settings by utilising a DL-assisted system that can
clearly detect and classify Plus disease by analysing
the blood vessels’ tortuosity.
The remainder of the paper is organized as fol-
lows. Section 2 highlights related studies on ROP-
Plus disease screening and monitoring. Section 3 de-
scribes the proposed DL-assisted approach for ROP-
Plus disease screening in detail. Section 4 provides
results of various pipeline stages of the proposed tech-
nique. Finally, Section 5 concludes the papers and
discusses how the work can be extended in the future.
2 RELATED WORK
Over the years, ophthalmologists have adopted many
ROP-Plus screening and diagnostic procedures. In
manual screening, an ophthalmologist uses a retinal
image to examine the signs of ROP disease. This is an
inefficient and biased method (Reid and Eaton, 2019;
Ting et al., 2019). As a result, objective evaluation
is important. Several approaches assist the physician
and ophthalmologist with computer-assistive diagno-
sis (CAD) using various disease screening tools (Doi,
2007). For instance, (Oloumi et al., 2016) ex-
plored CAD to establish some conventional ways to
aid physicians in making objective detection. In ad-
dition, the fact that standard methods (based on im-
age processing and computer vision) can only extract
basic information from fundus pictures, which is in-
sufficient to increase the accuracy of neonatal retinal
image classification (Razzak et al., 2018). When light
is uneven, the contrast between the lesion and the sur-
rounding typical region is negligible, making fundus
images challenging to interpret and lesion character-
istics to be obscured (Kumar. et al., 2022). There-
fore, an ML and particularly DL-based technique is
required to extract in-depth, high-level information
that enables automated ROP-Plus screening.
The self-learning capability of DL and its effi-
ciency and accuracy have attracted researchers’ in-
terest (Scruggs et al., 2020; Ting et al., 2019). Its
applications in ophthalmology have proven success-
ful, particularly in detecting image features of the
retina associated with glaucoma, age-related macu-
lar degeneration (AMD), diabetic retinopathy (DR),
cataract, and ROP (Ting et al., 2019). These are
data-driven approaches in which the DL model is
pre-trained on similar pathological datasets associ-
ated with the disease. DL-based solutions sur-
pass traditional CAD applications in terms of perfor-
mance. The DL-based screening method overcomes
the rule-based system’s flexibility and adaptability
constraints (Razzak et al., 2018).
For training, testing, and validation, DL-based
systems require a large amount of labelled and un-
labelled data (Ting et al., 2019; Razzak et al., 2018).
Data collection (pathological, medication, and treat-
ment history) and labelling are time-consuming pro-
cedures for medical applications (Razzak et al., 2018;
Ting et al., 2019). In some contexts, a disease’s occur-
rence is restricted, and its features are influenced by
socioeconomic factors and regional boundaries, mak-
ing it challenging to obtain high-quality critical in-
formation. In (Ting et al., 2019), the authors intro-
duced DCNN-based reinforcement learning methods
for ROP that alleviate the developer’s/researcher’s ad-
ditional burden of labelling the DL model prior to
training. Whereas the trained deep learning model is
fast and effective on a particular dataset, its perfor-
mance on any other dataset is uncertain. Addition-
ally, it is challenging for an expert to understand and
describe the relationship between the clinical mani-
festations of the disease and the DL result (Scruggs
et al., 2020).
Therefore, we presents a DL-assisted ROP screen-
ing technique to address these issues where large his-
torical datasets are lacking and interpretation of DL-
based system results is required.
Deep Learning Assisted Plus Disease Screening of Retinal Image of Infants
539
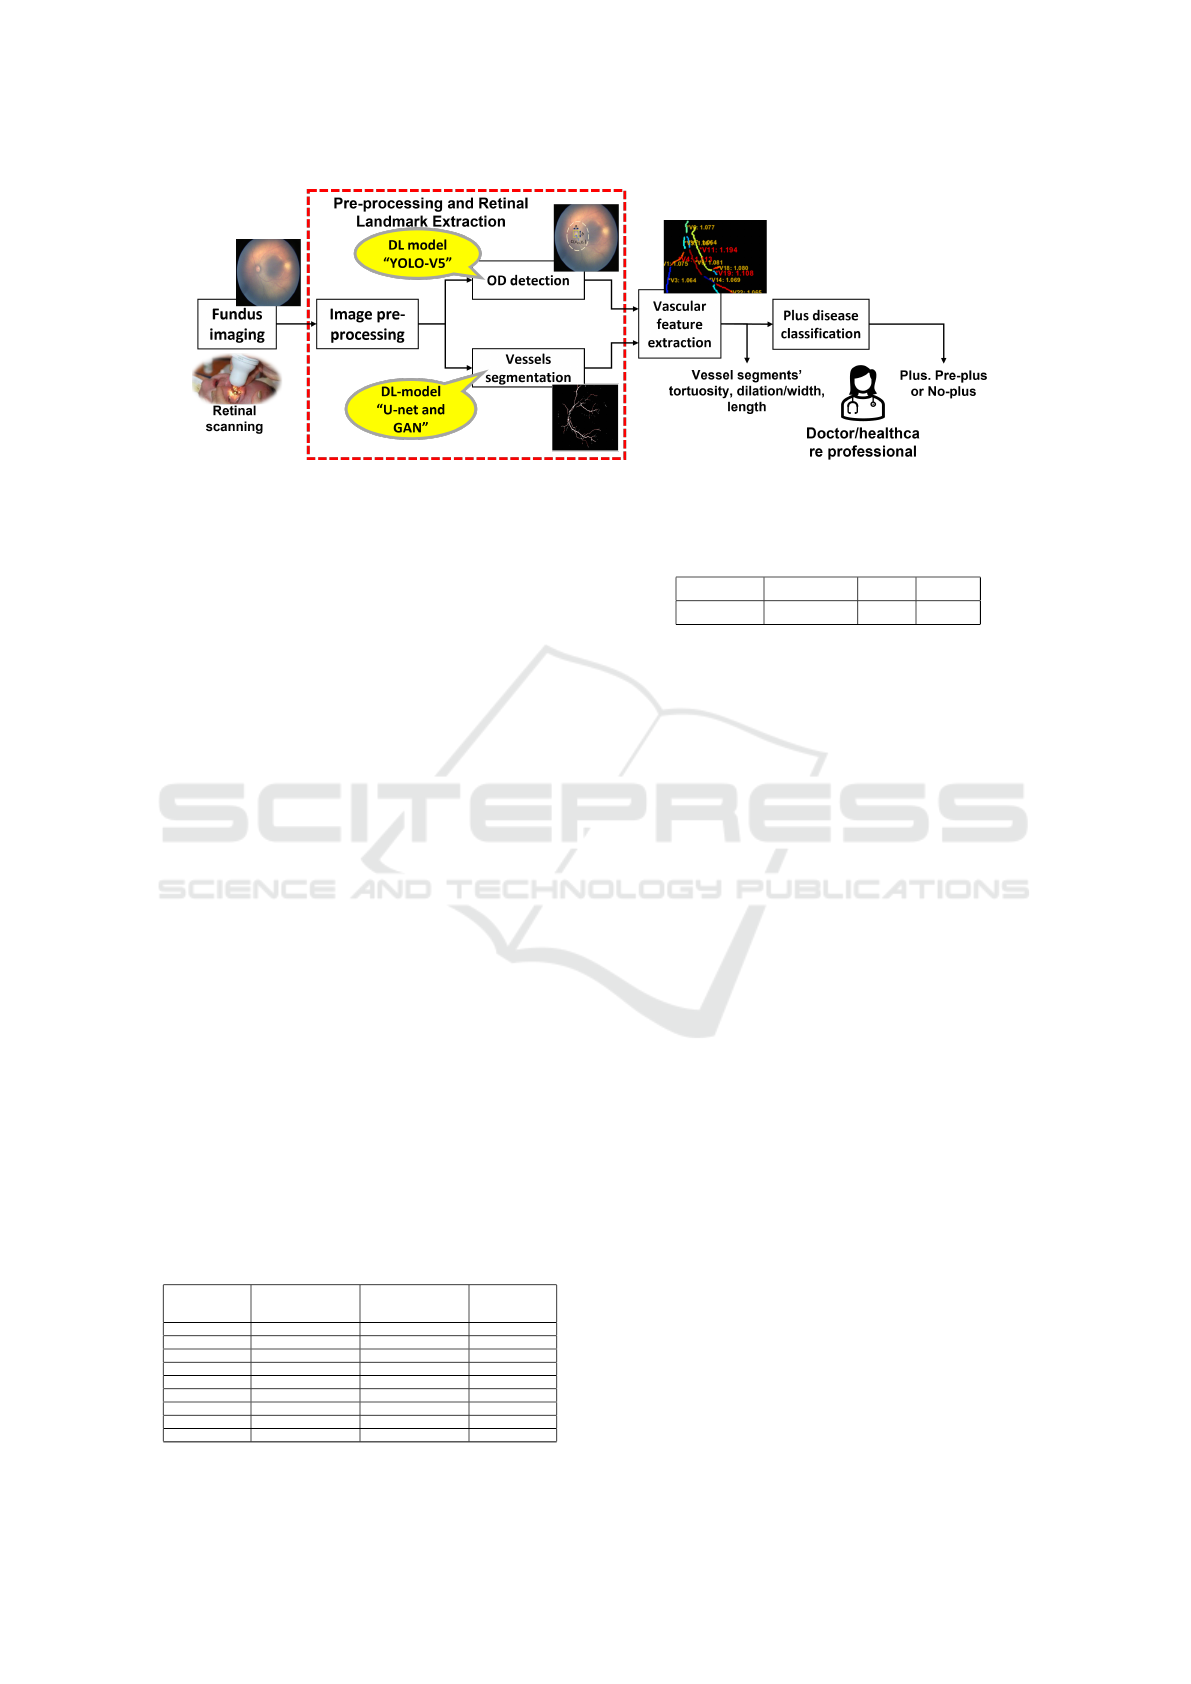
Figure 2: DL assisted fundus image feature extraction and Plus disease screening.
3 SYSTEM ARCHITECTURE
The detailed architecture of the proposed system is
shown in Figure 2. It consists of four functional units:
• Fundus imaging (or retinal scanning) unit.
• Image pre-processing and retinal feature extrac-
tion .
• Post-processing and vascular feature extraction.
• Disease classification.
3.1 Neonatal Fundus Imaging and Data
Preparation
The ophthalmologist or clinician acquired retinal im-
ages using the RetCam-3 fundus camera. RetCam-3’s
image resolution is 1600 x 1200 pixels. An infant’s
eye examination requires around ten photographs.
Figure 3 shows images of the retinas of premature
infants. Neonatal ophthalmologists use these images
in the diagnosis and monitoring of ROP as well as
other diseases. As, the quality of the picture is often
inadequate (because of uneven lighting, blurry mo-
tion, wrong set-up device, etc.) it is difficult and
time-consuming to detect and follow the patholog-
ical changes induced by newborns. Therefore, we
used image reconstruction and enhancement methods
Table 1: Retinal image datasets used for training and testing
of OD, blood vessel segmentation and Plus disease classifi-
cation modules (Here, NA: not available).
Dataset
Name
Number of im-
ages (in OD)
Number of im-
ages (in vessels
segmentation)
Number
of images
(Plus)
ARIA N/A 143 N/A
DRHAGIS N/A 40 N/A
STARE 297 20 N/A
FIRE 224 N/A N/A
DRIVE 40 20 N/A
HRF 45 45 N/A
IDRiD 511 N/A N/A
AIIMS 439 6 395
Total 1556 274 395
Table 2: AIIMS Dataset with 3-class Plus classification.
no_Plus pre_Plus Plus Total
73 109 213 395
to improve quality and reduce the noise of scanned
images, discussed in Section 3.2.1.
In order to train, test, and validate the proposed
system, especially the DL-based models, a large
amount of historical data is required. Therefore, we
created different sets of fundus datasets for training,
testing, and validation of different modules as per the
availability of relevant historical data points ( or im-
ages).
As shown in Table 1, we labelled 1556 fundus
pictures for the OD model. On the other hand, we
used 274 images for training and testing the vessel
segmentation module. In addition, to test the effec-
tiveness of the segmentation model, we annotated the
blood vessels in an image of a preterm infant’s retina
as ground truth. The process of vessel annotation is
time-consuming and laborious. Hence, six blood ves-
sels have been annotated in each image.
For the ROP disease, no fundus image datasets are
available publicly. Hence, In order to build the ROP-
Plus screening and classification system, we have use
439 images from the AIIMS dataset for ROP dis-
ease (Kumar et al., 2021; Kumar et al., 2022). Fur-
ther, a neonatal ophthalmologist classified and labeled
these images into three groups based on the severity
of Plus disease: Plus, Pre-Plus and Normal. Table 2
summarizes the overall number of Plus, Pre-Plus and
No-PLus preterm infants’ retinal scan images in the
AIIMS dataset.
We used datasets in two phases for the suggested
system of this research. In the first phase, we used it
for training and testing extraction models for retinal
features (OD and blood vessel map), and in the sec-
ond, we used it for training and testing to classify the
image as Plus, Pre-Plus, and Healthy.
HEALTHINF 2023 - 16th International Conference on Health Informatics
540

(a) (b) (c)
Figure 3: Example images from the retinal vessel segmen-
tation and OD datasets. Left to right: (a) DRIVE: retinal
image of elderly people that are publicly available; (b) AI-
IMS image: retinal images of newborns’ healthy eyes with
no-ROP and no-Plus disease; and (c) AIIMS image: retinal
images of infants’ unhealthy eye with +ve ROP Zone-2 and
+ve Plus disease.
3.2 Image-Preprocessing and Retinal
Feature Extraction
3.2.1 Image-Preprocessing
This section describes the image pre-processing
methods used by the proposed system to reduce the
amount of noise in retinal scans. The neonatal’s fun-
dus image is pale yellowish. We preferred the G-
channel and used it in subsequent image-processing
modules (Kumar et al., 2021; Kumar. et al., 2022;
Kumar et al., 2022). We utilized a median, average
filter, and contrast-limited adaptive histogram equal-
ization (CLAHE) to enhance the quality of the colour
image and eliminate illumination variations and blur-
riness (Kumar et al., 2021). However, the colour im-
age is employed as an input in the DL system for fea-
ture extraction, disease diagnosis, and classification.
3.2.2 Retinal Feature Extraction
In this section, we discuss the DL-based image analy-
sis methods used to extract retinal image feature’s OD
and blood vessels map.
OD Detection: The accuracy of a Plus classifica-
tion is governed by the fact that how well the OD lo-
cation is recognised (because the reference point re-
quired for the vessel tracing is started from the opti-
cal nerve boundary in retinal images) and how well
the vessel segments are detected by tracing. For the
OD detection, we have used (Kumar et al., 2021). In
which, authors used pre-trained DL-models, YOLO-
v5 (Jocher et al., 2021) for OD detection. Further, la-
belled the compiled dataset as per the YOLO model’s
input and then trained the network with a 416x416 in-
put pixel resolution, summarised in Table 1.
Blood Vessels Segmentation: The retinal blood
vessel map is the most significant retinal feature
used for tortuosity analysis in the proposed system.
Blood vessels of the preterm infant retina are not
distinguishable from the background as preterm in-
fants’ retinal blood vessel systems are not fully de-
veloped at the time of birth, as shown in Figure 3.
Therefore, conventional vessel segmentation meth-
ods, which perform well with publicly available reti-
nal image datasets, do not work well with an in-
fant’s retinal image. Hence, for vessels segmentation,
a Pix2Pix-GAN (Isola et al., 2018) or U-Net (Ron-
neberger et al., 2015) architecture-based vessel seg-
mentation method is used (Kumar. et al., 2022). Fur-
ther, we have use same approach for training and test-
ing as proposed in (Kumar. et al., 2022) and used
publicly available image datasets listed in Table 1.
3.3 Vascular Feature Extraction
To understand and quantify the ROP-Plus disease pro-
gression and severity, vascular features analysis is re-
quired. This includes analysis of blood vessels’ tor-
tuosity which requires the vessel’s skeleton, branch
points, width, length, and blood vessels end points.
For the vascular feature extraction, we have use
image-processing and computer vision based method
is shown in Figure 4. In this flow chart, it performs
the following steps to compute blood vessel (BV) fea-
tures (which includes BV segment curve length (S),
chord length (D), and order of BV segments(O)):
1. Centreline finding
2. Noise removal followed by branchpoint and end
point detection.
3. Branch points removal and BV segmentation.
4. Segment length (or curve length) and Segment
chord calculation.
5. Tortuosity Calculation.
6. Ordering of blood vessels segments based on
blood vessels width.
Centreline Finding. Centreline can be found with
the help of a technique known as skeletonization.
Skeletonization is morphological operation. Matlab
support many skeletonization of a 2D binary image
function includes "bwskel", "skel" and "thin". In gen-
eral, it is found that erroneous branch points are dis-
covered due to one-time skeletonization, as it is possi-
ble for a point that is not a branch point to have three
pixels to be adjacent to each other in the condition of
highly tortuous arteries. So, we have used ’thin’ for
the removal of short-end branches and spurs as it may
also include unnecessary extra pixels in the curved re-
gion. We then used ’bwskel’ for centreline due to its
accuracy.
Deep Learning Assisted Plus Disease Screening of Retinal Image of Infants
541
Figure 4: Blood vessels feature extraction.
Figure 5: Illustration of segment (PQ) is used to estimate
blood vessel tortuosity by examining segment length (s)
with respect to its chord length (d).
Branch Point and end Point Detection. In this
stage, the branch-points and endpoints of the blood
vessel network are identified. The tortuosity level
must be measured, analyzed, and quantified by lo-
cating the branch-points of a skeletonized vascular
network. Branch points are recognized via a mor-
phological process that identifies them, dilates them,
and reserves the branch point pixels that split various
segments (Wang et al., 2021; Sukkaew et al., 2008).
Therefore, we used Matlab’s morphological operation
to the binary image centerline with a simple kernel to
detect branch points with an adjacency of central pix-
els greater than 2 (MathWorks, 2023). After segmen-
tation, vessel segments are used for a tortuous assess-
ment.
Segment Length and Chord Length Calculation.
Vessel segment’s attributes segment length (S) and
chord length (D) are used for tortuosity calculation
are define below:
• Segment length or Geodesic distance (S): The
maximum non-infinity quasi-Euclidean distance
between any two endpoints of the segment’s cen-
terline skeleton (PQ as shown in Figure 5) is used
to determine the arc-length distance between the
start and endpoints of the segment, as follows:
S(γ(Q) − γ(P)) = v ∗ |Q − P|, (1)
where, v ≥ 0.
• Straight line distance (Chord): It is the straight-
line distance (Euclidean distance) between two
ends (PQ as shown in Figure 5) of the skeleton’s
centerline segments, as follows (Heneghan et al.,
2002):
Chord(D) =
q
(x
′
− x)
2
+ (y
′
− y)
2
, (2)
where, (x, y) and (x
′
, y
′
) are the co-ordinate of seg-
mented blood vessel’s start and end point, P and
Q respectively.
Tortuosity Calculation. For the tortuosity calcula-
tion, we have used two approaches. The first ap-
proach, proposed by (Hart et al., 1997), is the sim-
plest and most widely used measure for calculating
tortuosity. It computes the tortuosity of a vessel by
examining how long the curve is relative to its chord
length, as follows:
Tortuosity(τ
H
) =
Curve length(S)
Chord length (D)
− 1, (3)
where S is the arc length or curve length obtained by
counting all the points (or pixels) from the start of the
vessel to its end, and D is the length of the underlying
chord.
There was another kind of method described by
(Grisan et al., 2008). This technique works by first
segmenting each vessel into n segments of constant-
sign curvature and then combining these segments
and their respective numbers to compute as follows:
Tortuosity(τ
G
) =
n − 1
S
n
∑
i=1
[
s
i
d
i
− 1], (4)
where S is the vessel arc length, s
i
is the subsegment
arc length, and d
i
is the subsegment chord length.
HEALTHINF 2023 - 16th International Conference on Health Informatics
542
Ordering of Segmented Branches. Further, for the
analysis of retinal vascular structure, we have used
two types of blood vessel (BV) segmentation and la-
belling methods: (1) the minor analysis model and
(2) the major analysis model. In the minor analysis
model, we simply break vessels at branch points. In
the major analysis model, we break vessels at branch
points while maintaining parent-child relations.
The first is only to increment the number if its
value is smaller than the others. This approach is ap-
propriate for two to three-level categorization. The
second method involves increasing the number with-
out limits. This method is sometimes better for im-
ages with more than three levels, but the level thresh-
old must be set manually for each new image. Repeat
the above step at least four more times to get the fi-
nal output, which can be further used by the tortuosity
calculation algorithm to get a detailed analysis of ves-
sels. A two-level system is good enough for images
with a lot of noise, and a three-level system is good
enough for regular fundus image. However, higher-
level systems sometimes suffer from a false loop is-
sue.
3.4 Disease Classification
Disease classification is the fourth and final functional
unit. In the proposed system, we classified the sever-
ity of PLUS disease using two rule-based approaches.
Percentage of Infected Vessels: Computes the pro-
portion of vessel segments whose curvature index ex-
ceeds the threshold curvature index (T
H
). Here, T
H
is the mean tortuosity index of the vessel segments in
the healthy fundus image.
Cumulative Curvature Index: It estimates the cur-
vature index of vessel segments using equation ( 4),
treating all fundus image segments as sub-segments
of a segment.
After that, we utilized the ROP-Plus dataset to
compute these threshold values for Plus disease clas-
sification (i.e., healthy, pre-Plus, and Plus) using both
of the above mentioned approaches. Using a training
dataset (listed in Table 2), all threshold values were
computed. The remaining dataset is utilized to test
the suggested system.
4 RESULTS AND DISCUSSION
The proposed system and its different modules are im-
plemented and tested on a workstation with Intel(R)
Xeon(R) 40-Core CPU E5-2630 v4 @ 2.20GHz with
64 GB RAM and 8 GB NVIDIA GeForce GTX 1070
GPU. Further, we used online Matlab to post-process
the segmented blood vessel map. In this section, we
discuss the results of the proposed method for vascu-
lar feature analysis to detect and classify infant ROP-
Plus.
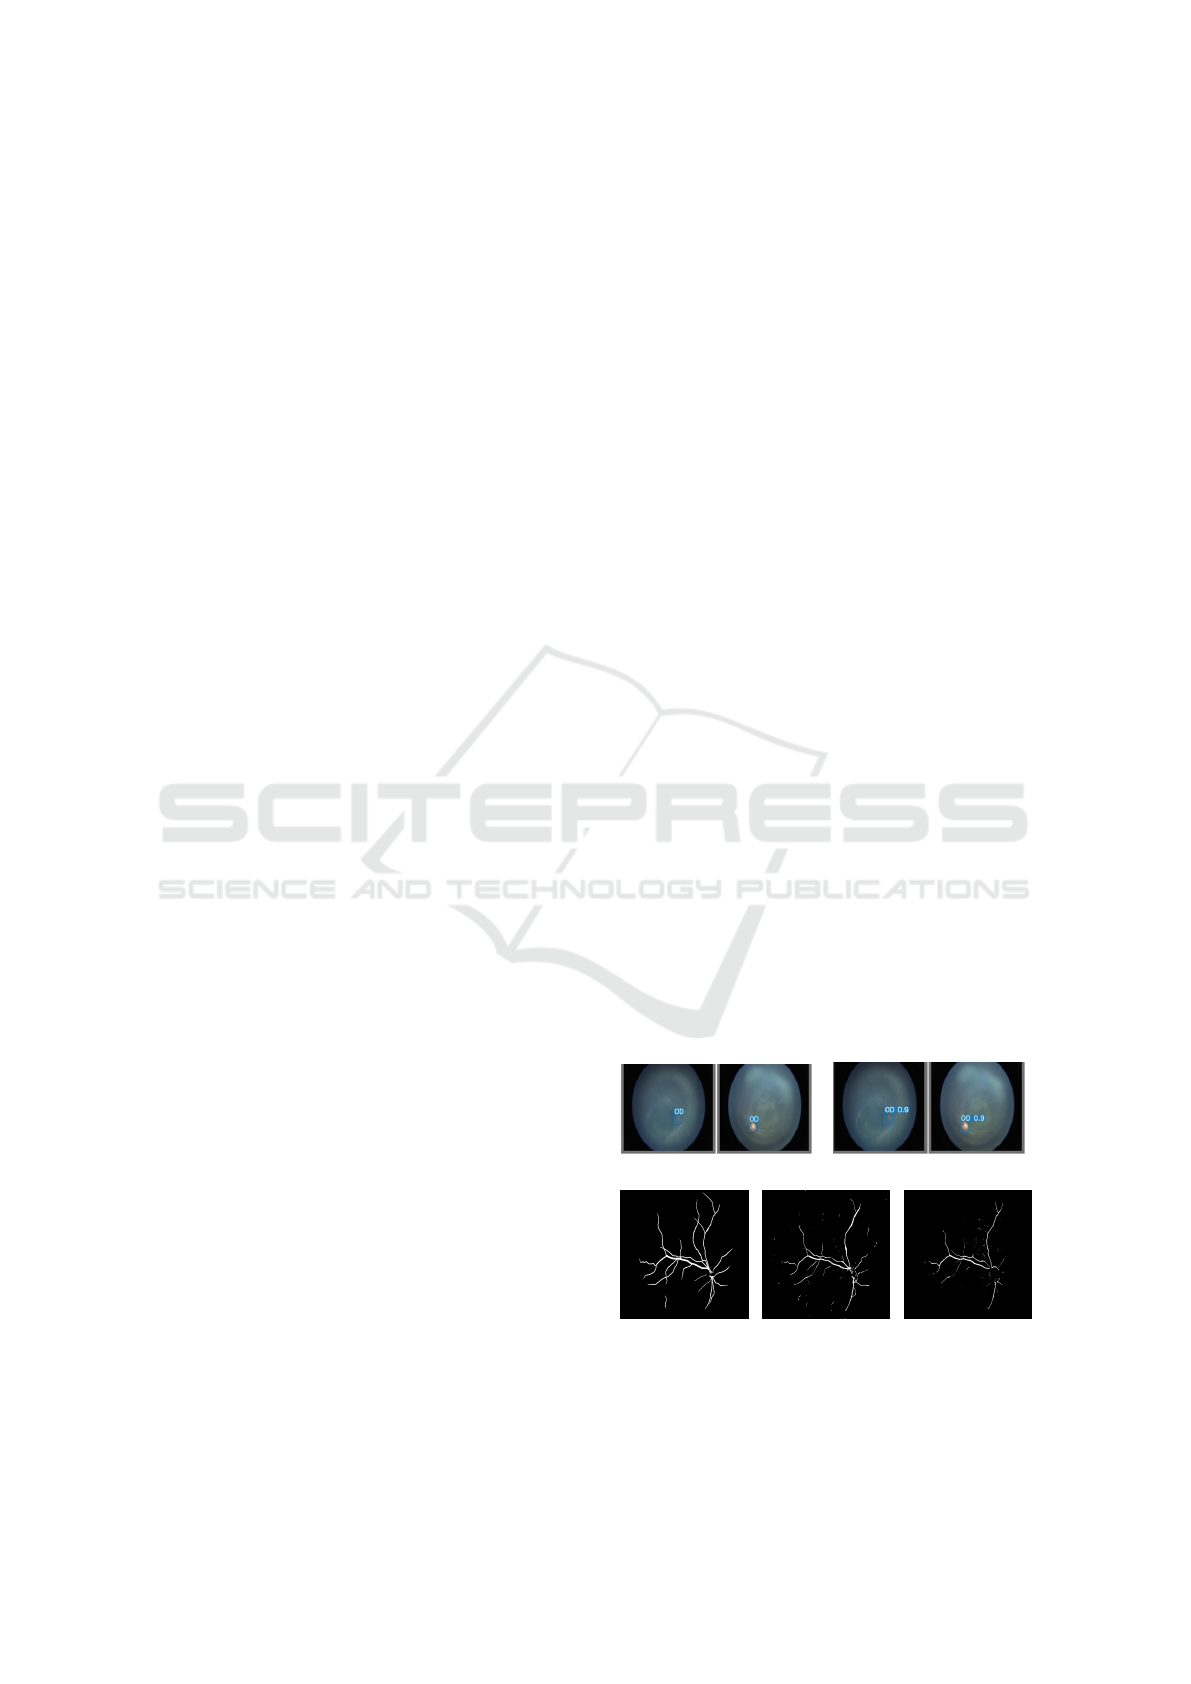
4.1 Retinal Feature Extraction
We have used YOLO-v5 and Pix2Pix-GAN Or UNet
models to extract retinal characteristics (i.e., OD and
retinal blood vessel nap). Both algorithms have also
shown excellent accuracy for OD detection and blood
vessel segmentation using the AIIMS infant’s fundus
image dataset. Figure 6 shows the results of OD de-
tection and blood vessel segmentation on images of
infant retinas.
4.2 Vessels Segmentation and Labelling
We have used the vascular feature extraction method,
discussed in Section 3.3. The proposed method solves
the problem of the false loop to a large extent and re-
duces false branches and small segment branches. We
have taken several images and calculated the number
of vessels correctly detected and the total number of
vessels correctly detected with respect to each model
for each image. Then for each model, we found out
the percentage of vessels detected correctly for each
image and averaged them to get the accuracy of our
models. As shown in Figure 7d, for minor analysis,
we have found that at least 95% of the vessel was de-
tected correctly in all test cases, with 5% having a
problem with the false loop. For major analysis, we
found that almost in all test cases, principal (or main)
branches are not disconnected and have an accuracy
(a) (b)
(c) (d) (e)
Figure 6: Example results of OD detection and blood seg-
mentation. (a) Original OD, (b) predicted OD, (c) orig-
inal blood vessels(BV) network, (d) predicted BV using
Pix2Pix-GAN, and (d) predicted BV using UNet.
Deep Learning Assisted Plus Disease Screening of Retinal Image of Infants
543
(a) (b)
(c) (d)
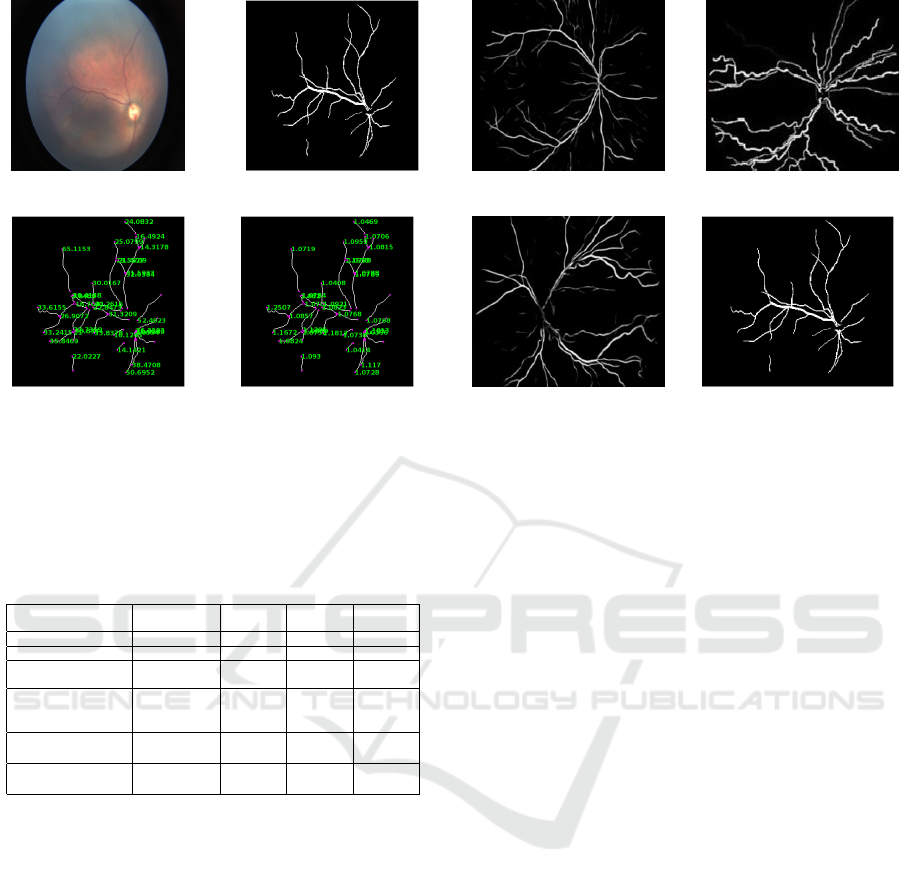
Figure 7: Minor analysis output. (a) Retinal image of
healthy infant; (b) Blood vessels map after segmentation;
(c) Length of each vessels segment (in pixels); and (d) Tor-
tuosity value of each vessel segments.
Table 3: Plus disease classification results using tortuosity
analysis of infants retinal images (Here, N/A: not applica-
ble).
Parameters Reference Healthy Pre-
Plus
Plus
Score Overall 1.0894 1.126 1.1530 1.1967
Score 2nd level 1.0739 1.117 1.1530 1.1959
% of vessel in-
fected
25% 35% 38% 56%
% of vessel
severely in-
fected
18% 20% 30% 44%
Average score
(27 patient)
N/A 1.12 1.16 1.21%
Average % (27
patient)
N/A 30% 40% 55%
of around 94% overall while detecting and segment-
ing vessels. For ordering the vessel, the accuracy was
more than 90% at 2-level classification. The accuracy
falls to 60% for 3-level classification, which can be
increased with some modification and changing the
threshold for each specific case. Also, only a few
images of the locally available datasets have three or
more levels.
4.3 Plus Disease Classification
After training on a dataset of infant retinal images
(Table 2), we identified a tortuosity threshold (T
H
) of
1.15 for labelling a blood vessel segment as healthy or
infected. Also, using this T
H
(for infected vessels), we
found a percentage threshold of 35% for pre-plus and
50% for Plus. In addition, we measured the cumu-
lative range of tortuosity and found it to be between
1.13 and 1.19 for both the pre-Plus and Plus classes.
(a) τ = 1.0894. (b) τ = 1.967.
(c) τ = 1.1530. (d) τ = 1.126.
Figure 8: Plus disease classification results: (from left to
right). (a) Healthy reference image use to find tortuosity
threshold; (b) Plus disease; (c) Pre-Plus; and (d) Healthy.
Refer to Table 3 for results. The healthy image
(from infant retinal image datasets) above has a tortu-
osity of 1.126 overall, and 1.1178 at the 2
nd
level, and
the percentage of vessels infected is 35% with 20%
vessels severely infected. The pre-Plus image shown
above in Figure 8 has a tortuosity of 1.1530, and
the percentage of vessels infected is 38%, with 30%
severely infected. In contrast, the Plus image has a
tortuosity of 1.1959 in the 2nd level and 1.1967 over-
all, with 56% of vessels infected and 44% severely in-
fected. In comparison with the healthy reference im-
age, it has a tortuosity of 1.0739 in the 2nd level, and
1.0894 overall, and the percentage of vessels infected
is 25%, with 18% vessels severely infected. Severely
infected vessels have tortuosity above 1.2, due to ves-
sels curvature (shown in Figure 8).
5 CONCLUSION
This study presents a proof of concept (POC) for a
newly proposed DL-assisted retinal disease screening
system. It investigated, developed, and implemented
a new classification system based on the tortuosity of
retinal blood vessels to diagnose ROP-Plus disease.
The proposed method allows data-driven and rule-
based systems to coexist on a single platform. Conse-
quently, it can function effectively even without a suf-
ficient number of datasets. In addition, in this method,
the doctor can view the classification results and the
visualization of the detected vessels, including their
segments, length, and tortuosity, to visually compre-
HEALTHINF 2023 - 16th International Conference on Health Informatics
544

hend and confirm the system’s decision.
In the current study, blood vessel segments that
form a loop or overlap were not considered when cal-
culating the curvature index of the vessels. In addi-
tion, the present method is trained and evaluated with
a small number of retinal image datasets for three lev-
els of ROP-Plus disease classification. Therefore, in
the future, we may enhance the proposed techniques
to address overlapping problems with more retinal
image datasets and additional disease classification
levels.
REFERENCES
Chiang, M. F., Quinn, G. E., Fielder, A. R., Ostmo, S. R.,
Chan, R. P., Berrocal, A., Binenbaum, G., Blair, M.,
Campbell, J. P., Capone Jr, A., et al. (2021). Inter-
national classification of retinopathy of prematurity.
Ophthalmology, 128(10):e51–e68.
Doi, K. (2007). Computer-aided diagnosis in medical imag-
ing: historical review, current status and future po-
tential. Computerized medical imaging and graphics,
31(4-5):198–211.
Grisan, E., Foracchia, M., and Ruggeri, A. (2008). A
novel method for the automatic grading of retinal ves-
sel tortuosity. IEEE transactions on medical imaging,
27(3):310–319.
Hart, W. E., Goldbaum, M., Cote, B., Kube, P., and Nelson,
M. R. (1997). Automated measurement of retinal vas-
cular tortuosity. In Proceedings of the AMIA Annual
Fall Symposium, page 459. American Medical Infor-
matics Association.
Heneghan, C., Flynn, J., O’Keefe, M., and Cahill, M.
(2002). Characterization of changes in blood ves-
sel width and tortuosity in retinopathy of prematu-
rity using image analysis. Medical image analysis,
6(4):407–429.
Isola, P., Zhu, J.-Y., Zhou, T., and Efros, A. A. (2018).
Image-to-image translation with conditional adversar-
ial networks.
Jocher, G., Stoken, A., Borovec, J., NanoCode012, Chaura-
sia, A., TaoXie, Changyu, L., V, A., Laughing,
tkianai, yxNONG, Hogan, A., lorenzomammana,
AlexWang1900, Hajek, J., Diaconu, L., Marc, Kwon,
Y., oleg, wanghaoyang0106, Defretin, Y., Lohia, A.,
ml5ah, Milanko, B., Fineran, B., Khromov, D., Yiwei,
D., Doug, Durgesh, and Ingham, F. (2021). ultralyt-
ics/yolov5: v5.0 - YOLOv5-P6 1280 models, AWS,
Supervise.ly and YouTube integrations.
Kumar, V., Patel, H., Azad, S., Paul, K., Surve, A., and
Chawla, R. (2022). Dl-assisted rop screening tech-
nique. In Gehin, C., Wacogne, B., Douplik, A.,
Lorenz, R., Bracken, B., Pesquita, C., Fred, A., and
Gamboa, H., editors, Biomedical Engineering Systems
and Technologies, pages 236–258, Cham. Springer In-
ternational Publishing.
Kumar, V., Patel, H., Paul, K., Surve, A., Azad, S., and
Chawla, R. (2021). Deep learning assisted retinopathy
of prematurity screening technique. In HEALTHINF,
pages 234–243.
Kumar., V., Patel., H., Paul., K., Surve., A., Azad., S., and
Chawla., R. (2022). Improved blood vessels segmen-
tation of retinal image of infants. In Proceedings of the
15th International Joint Conference on Biomedical
Engineering Systems and Technologies - HEALTH-
INF,, pages 142–153. INSTICC, SciTePress.
MathWorks (1994-2023). Morphological operations on
binary images - matlab bwmorph. https://www.
mathworks.com/help/images/ref/bwmorph.html. (Ac-
cessed on 01/07/2023).
Oloumi, F., Rangayyan, R. M., and Ells, A. L. (2016).
Computer-aided diagnosis of retinopathy in retinal
fundus images of preterm infants via quantification
of vascular tortuosity. Journal of Medical Imaging,
3(4):044505.
Organization, W. H. et al. (2019). World report on vision.
Technical report, Geneva: World Health Organization.
Razzak, M. I., Naz, S., and Zaib, A. (2018). Deep learning
for medical image processing: Overview, challenges
and the future. Classification in BioApps, pages 323–
350.
Reid, J. E. and Eaton, E. (2019). Artificial intelligence for
pediatric ophthalmology. Current opinion in ophthal-
mology, 30(5):337–346.
Ronneberger, O., Fischer, P., and Brox, T. (2015). U-net:
Convolutional networks for biomedical image seg-
mentation.
Scruggs, B. A., Chan, R. P., Kalpathy-Cramer, J., Chiang,
M. F., and Campbell, J. P. (2020). Artificial intelli-
gence in retinopathy of prematurity diagnosis. Trans-
lational Vision Science & Technology, 9(2):5–5.
Sukkaew, L., Uyyanonvara, B., Makhanov, S. S., Bar-
man, S., and Pangputhipong, P. (2008). Automatic
tortuosity-based retinopathy of prematurity screening
system. IEICE transactions on information and sys-
tems, 91(12):2868–2874.
Tian, P., Guo, Y., Kalpathy-Cramer, J., Ostmo, S., Camp-
bell, J. P., Chiang, M. F., Dy, J., Erdogmus, D., and
Ioannidis, S. (2019). A severity score for retinopa-
thy of prematurity. In Proceedings of the 25th
ACM SIGKDD International Conference on Knowl-
edge Discovery & Data Mining, KDD ’19, page
1809–1819, New York, NY, USA. Association for
Computing Machinery.
Ting, D. S. W., Pasquale, L. R., Peng, L., Campbell, J. P.,
Lee, A. Y., Raman, R., Tan, G. S. W., Schmetterer, L.,
Keane, P. A., and Wong, T. Y. (2019). Artificial intel-
ligence and deep learning in ophthalmology. British
Journal of Ophthalmology, 103(2):167–175.
Wang, G., Li, M., Yun, Z., Duan, Z., Ma, K., Luo, Z., Xiao,
P., and Yuan, J. (2021). A novel multiple subdivision-
based algorithm for quantitative assessment of reti-
nal vascular tortuosity. Experimental Biology and
Medicine, 246(20):2222–2229.
Deep Learning Assisted Plus Disease Screening of Retinal Image of Infants
545
