
Can Visual Information Reduce Anxiety During Autonomous
Driving? Analysis and Reduction of Anxiety Based on Eye
Movements in Passengers of Autonomous Personal Mobility Vehicles
Ryunosuke Harada
a
, Hiroshi Yoshitake
b
and Motoki Shino
Department of Human & Engineered Environmental Studies, The University of Tokyo, 5-1-5 Kashiwanoha, Kashiwa,
Chiba, 277-8563 Japan
Keywords: Autonomous Transportation, Personal Mobility Vehicles, Anxiety, Cognition, Eye Movements, Visual
Information.
Abstract: It is important to consider reducing passenger anxiety when promoting autonomous transportation services of
personal mobility vehicles (PMVs). This research aims to identify when anxiety occurs based on the eye
movements and subjective assessment of autonomous vehicle passengers and to reduce that anxiety by
presenting visual information. Temporal changes in passenger’s anxiety while passing through a group of
pedestrians were investigated by an experiment using a driving simulator. By analyzing the passenger’s eye
movements and subjective assessment, it was suggested that anxiety occurs with changes in the positional
relationship with surrounding pedestrians and the sudden change in behavior of the PMV. Moreover, the
results suggested that anxiety can be reduced by the presentation of visual information with the effect of visual
guidance that diverts passenger’s attention from anxiogenic pedestrians and provides content that conveys
PMV’s intention of its behavior. Additional experiments revealed that the visual information presented in this
study significantly reduced passenger anxiety during the autonomous transportation of PMVs.
1 INTRODUCTION
In the midst of global aging, securing means of
transportation for older people, whose physical and
cognitive functions tend to decline, has become a
global issue. This is important for maintaining the
frequency of going out and ensuring their quality of
life. Personal Mobility Vehicles (PMVs), like electric
wheelchairs, are one of the means of transportation,
and the number of users is increasing year by year in
Japan, where aging is a major social problem. Since
many of the PMV users are older people, it is
necessary to consider mobility assistance to
compensate for the deterioration of their cognitive
and physical functions. Assistance using autonomous
navigation is one way to realize this support that does
not depend on the cognitive and physical ability of the
passenger. Although there are many studies on the
reliability and safety of autonomous navigation, it is
also important to avoid passengers from feeling
a
https://orcid.org/0000-0003-1069-9110
b
https://orcid.org/0000-0001-6875-0957
anxious while it moves automatically through
pedestrians. Autonomous PMV passengers may
experience various types of anxiety. For example,
given that the PMV drives through pedestrians, there
is a possibility that the passenger may feel anxious
about collisions due to the positional relationship with
surrounding pedestrians. This anxiety is thought to be
similar to the anxiety that occurs when pedestrians
approach each other. Interactions between traffic
participants in pedestrian spaces have been
extensively studied. Hall (1966) has revealed the
existence of a space called Personal Space (PS),
where pedestrians feel uncomfortable with the
intrusion of others. PS is an egg-shaped space that
scales according to the velocity vector of the
individuals. The idea of PS has been extended to the
interaction between pedestrians and robots (Shiomi et
al., 2014). Helbing and Molnar (1995) suggested that
the movement path of a group of pedestrians can be
represented by a dynamic model called Social Force
Model (SFM), which is based on the repulsive force
318
Harada, R., Yoshitake, H. and Shino, M.
Can Visual Information Reduce Anxiety During Autonomous Driving? Analysis and Reduction of Anxiety Based on Eye Movements in Passengers of Autonomous Personal Mobility Vehicles.
DOI: 10.5220/0011802800003417
In Proceedings of the 18th International Joint Conference on Computer Vision, Imaging and Computer Graphics Theory and Applications (VISIGRAPP 2023) - Volume 2: HUCAPP, pages
318-325
ISBN: 978-989-758-634-7; ISSN: 2184-4321
Copyright
c
2023 by SCITEPRESS – Science and Technology Publications, Lda. Under CC license (CC BY-NC-ND 4.0)

between pedestrians and the attractive force from the
target point, which is built from a concept similar to
PS. Previous research also suggests that passengers of
PMV also shows negative reaction to surrounding
pedestrians approaching them (Isono et al., 2022).
Moreover, anxiety caused by autonomous navigation
is also assumed. Watanabe et al. (2015) suggested
that passengers feel discomfort not knowing the
future behavior of the PMV and its intentions. They
succeed in reducing this discomfort by presenting
visual information about the PMV’s intention.
However, only a simple passing scenario with one
pedestrian was examined, and it is not clear what the
passenger received from the presented visual
information and why it led to the reduction of
discomfort. Therefore, this study aims to clarify the
trigger of anxiety and reduce them by displaying
visual information, as was the case in previous studies
that reduced discomfort. Experiments were
conducted using a driving simulator to repeatedly
reproduce the scene passing through a group of
pedestrians according to the route calculated by an
autonomous navigation strategy. The anxiety of the
participants was analyzed based on eye movements
and their subjective assessments.
This paper is structured as follows. Section 2
describes the triggers of anxiety and how visual
information reduces them. It also shows several types
of visual information considered in this study. Section
3 describes the method of the experiment, followed
by Section 4 showing the results. Section 5 describes
the additional experiment conducted to evaluate the
effectiveness of the proposed visual information.
Lastly, Section 6 summarizes the findings of this
study.
2 VISUAL INFORMATION
REDUCING ANXIETY
This section describes the triggers of passenger’s
anxiety and how visual information reduces them.
Among the various possible factors of anxiety, two
types of triggers were extracted based on previous
research, some of which were mentioned in the
previous section. With the aim of reducing anxiety,
three types of visual information were proposed.
2.1 Triggers of Anxiety
Roseman (2001) suggests that cognitive appraisal
plays an important role in the arousal of emotions
such as anxiety. This model describes that human
selects the stimuli from the environment using their
perception filter and interpret whether the stimuli
have a negative effect on them. This process is called
the primary appraisal. When they interpret the stimuli
as negative, they estimate the amount of resources
they need to be able to cope with the situation related
to that stimuli. This is called the secondly appraisal.
Once they estimate the required resources occupy an
excessive proportion of the attentional resource, they
find the stimuli as their stress (Lazarus and Folkman,
1984). Roseman suggests that negative emotions such
as anxiety arouse from stimuli that individuals apprise
as inconsistent with their motives, which is often due
to an uncontrollable circumstance caused by others.
Roseman also points out that the predictability of the
stimuli is one of the key factors of cognitive appraisal.
In the case of autonomous PMV passengers, there
are two main stakeholders who might give them
stimuli that they apprise as inconsistent with their
motives: the surrounding pedestrians and the
autonomous PMV. As for the surrounding
pedestrians, proximity that evokes the danger of
collision is one of the stimuli which leads to
passenger’s anxiety (Isono et al., 2022). On the other
hand, sudden changes in PMV’s behavior, such as
velocity and angular velocity, are stimuli that are hard
to predict and can result in the arousal of negative
emotions (Watanabe et al., 2015).
2.2 Visual Information
In the model of cognitive appraisal, it is explained
that once individuals feel some stress, they try to
overcome it by changing those stimuli with their
actions. However, since an autonomous PMV
operates independently of the passenger’s intentions,
it basically cannot be affected by them. Therefore, in
order to fill this gap in intention, it is important to
communicate the PMV’s intentions to the passenger
in advance. In this study, visual information was
examined as a means of this communication. Visual
information may improve the predictability of the
stimuli given by the PMV and reduce the anxiety of
the passengers. There is also an expectation that the
perception filter will exclude anxiety-causing stimuli
from nearby pedestrians through the effect of visual
guidance toward the presented information.
There are three types of parameters that determine
the behavior of a PMV: position, velocity, and
posture angle. In this study, three types of visual
information were examined as a means of presenting
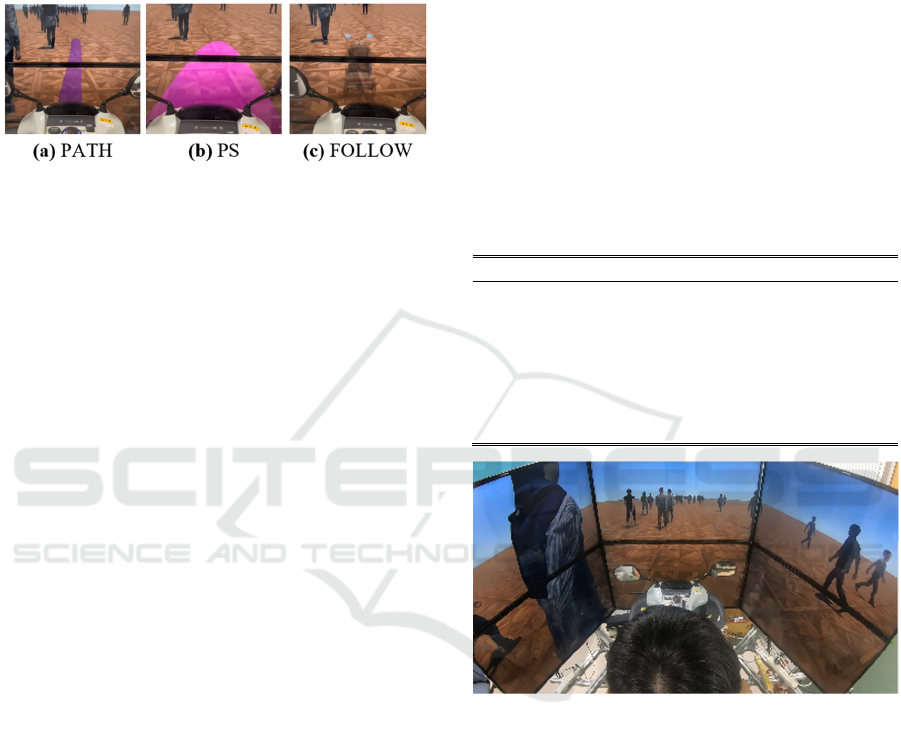
these parameters to passengers. Figure 1 describes
these three types of visual information and which
parameters they represent. In general, information
Can Visual Information Reduce Anxiety During Autonomous Driving? Analysis and Reduction of Anxiety Based on Eye Movements in
Passengers of Autonomous Personal Mobility Vehicles
319
presentation is said to be processed differently
depending on the presentation timing and from the
perspective of iconic memory. Thus, we prepared
conditions for presenting information 1 second ahead
and 3 seconds ahead for each type (Kitajima and
Toyota, 2013).
Figure 1: Visual information examined in this study. (a)
PATH type describes future position information as a line
on the ground. (b) PS type describes future velocity
information as an egg-shaped space scaling according to its
vector, which imitates PS. (c) FOLLOW type describes the
future posture angle along with its position as a leading
vehicle.
3 METHODS
This section describes the method of an experiment
that aims to clarify the trigger of anxiety and how
passengers react to them. We also investigated how
visual information changes those anxiety and
reactions. In order to clarify the timing of passenger
anxiety and its factors, subjective assessment and eye
movements were measured. The experiment was
conducted with the approval of the Ethics Committee
of The University of Tokyo.
3.1 Conditions
One hundred fifty pedestrians were randomly placed
in a 10 m width aisle at an interval of 0.1 person/m
2
.
Half of the people walked in the same direction as the
PMV, and the other half walked in the opposite
direction. Pedestrians moved at about 1.1 m/s based
on an SFM mentioned in Section 1. The PMV drove
through this group of pedestrians at 0.7 m/s based on
an autonomous navigation strategy called the Dynamic
Windows Approach (Fox et al., 1997). Participants
experienced the same scene with seven different visual
information conditions listed in Table 1.
3.2 Experimental Procedure
Three males (A–C) with an average age of 26.3 years
old (SD = 4.2) participated in this experiment. After
obtaining informed consent, participants were
equipped with an eye tracking device (
Tobii Pro
Glasses 2, Tobii AB)
and given a button that they
were instructed to press when they felt anxious while
watching a 30-second driving scene on the driving
simulator (Figure 2). On the screen with a field of
view of 180 degrees, a PMV that drives through a
group of pedestrians using autonomous navigation
was projected from a first-person perspective. After
each scene, participants were asked why they pressed
the button and the factors which caused their anxiety.
Since the driving scene was fixed in the experiment,
we prepared a dummy scene to prevent the influence
of familiarity and let the participants experience it
between the experiment target conditions. There was
a 1-minute interval between each scene experience.
Table 1: Experimental conditions.
ID Visual Info. Presenting Info.
None n/a n/a
Pa01 PATH 1 sec. ahead
Pa03 PATH 3 sec. ahead
PS01 PS 1 sec. ahead
PS03 PS 3 sec. ahead
Fo01 FOLLOW 1 sec.
Fo03 FOLLOW 3 sec.
Figure 2: Driving simulator used in the experiment.
3.3 Analysis of Eye Movements
In this study, by analyzing visual behavior, we expect
to clarify why passengers feel anxious and how they
visually recognize the surrounding objects when the
anxiety occurs. If the passenger feels anxious about
the proximity of surrounding pedestrians, it is
conceivable for them to keep watching the target
pedestrian. On the other hand, when the vehicle
suddenly changes its behavior, it is reasonable that the
passenger tries to obtain information by looking at
various places. Janelle (1999) discovered that
saccades increase when drivers feel anxious in an
auto racing simulator. Therefore, if the intention of
the PMV can be conveyed to the passenger through
HUCAPP 2023 - 7th International Conference on Human Computer Interaction Theory and Applications
320
the visual information, it is more likely that the
frequency of this saccade decreases as the rate of
attention to the visual information increases and the
evaluation of anxiety decreases. Moreover, increasing
attention to visual information might also decrease the
anxiety against pedestrians as the possibility of seeing
the target, which triggers anxiety, decreases.
To test this hypothesis, a metric that quantifies
saccade frequency is in need. Krejtz et al. (2014)
proposed two indices for gaze transition using the
concept of Shannon’s entropy (Ciuperca and Girardin,
2005). This metric is used in the eye movement
analysis of car drivers (Dillen et al., 2020). These
entropies are calculated based on the stationary rate
and the transition rate of the Area of Interest (AOI),
which is an area where fixation points are dense
(Salvucci and Goldberg, 2000). Stationary entropy H
s
is defined as equation (1), where i represents one AOI,
n is the total number of AOIs, and π
i
is the stationary
probability distribution of AOI within a certain period
of time. When passengers distribute their visual
attention more equally between AOIs, this stationary
entropy will show a higher value. The other entropy
is called transition entropy which is defined as
equation (2), where p
ij
is the probability of the
subject’s fixation transiting from AOI i to AOI j. A
higher value of transition entropy means that there are
more saccades between the AOIs.
H
ln
(1)
H
ln
,ij
(2)
4 RESULTS
This section describes the result of the experiment.
First, factors of anxiety were classified using a
subjective assessment of the condition without visual
information presentation. Then, eye movements
during that duration of anxiety were analyzed.
Changes in eye movements and anxiety evaluation on
visual information presented conditions were also
analyzed.
4.1 Factors of Anxiety
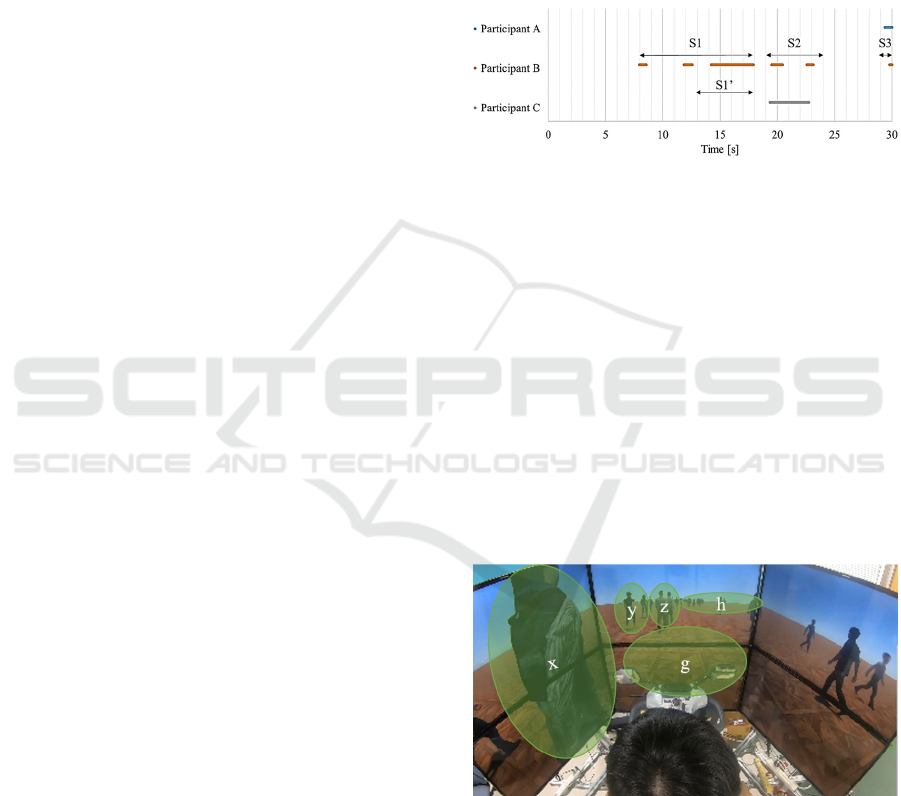
Figure 3 shows when the participants felt anxiety
during the scene without any information
presentation. Participant B, who felt particularly
anxious, commented that he felt anxious about the
proximity of a pedestrian in S1 and that he was
anxious about not being able to understand the
behavior of PMV in S2. Participant C commented the
same way in S2. Anxiety in S3 was excluded because
it was associated with changes that occurred when the
scene finished playing in the simulator. Therefore,
factors that cause anxiety in this scene can be broadly
classified into two sections, S1 and S2. S2 is a scene
in which the vehicle makes a large left turn after
meandering to avoid pedestrians.
Figure 3: Occurrence of anxiety in the condition without
presentation of visual information.
4.2 Eye Movement Analysis
4.2.1 Analysis Conditions
The video recorded by the eye tracking device was 25
fps which means there are 40 ms intervals between
the frames. The minimum fixation duration was set to
80 ms, referring to the previous research (Krejtz et al.,
2014). The analysis time was set to 5 seconds in line
with S2. From S1, S1’ was extracted, which is a 5-
second section that participant B felt more anxious
(Figure 3). From S1’ and S2, five areas were set as
AOIs shown in Figure 4. All fixations in the two
sections were classified into these five AOIs.
Figure 4: AOIs in S1’ and S2. (x) AOI-x Pedestrian X,
which is the pedestrian participant B was anxious about. (y)
AOI-y Pedestrian Y. (z) AOI-z A group of pedestrians Z.
(g) AOI-g Ground, including visual information. (h) AOI-h
Horizon.
4.2.2 Analysis of S1’
S1’ is where the proximity of pedestrian X causes
anxiety. The results of eye movement analysis in the
Can Visual Information Reduce Anxiety During Autonomous Driving? Analysis and Reduction of Anxiety Based on Eye Movements in
Passengers of Autonomous Personal Mobility Vehicles
321
condition without visual information are shown in
Figure 5. Participant B, who claimed that the
proximity of pedestrian X was anxious, had a longer
fixation against AOI-x. Leading to a decrease of
stationary entropy H
s
. Participant B also showed a
low value in the transition entropy H
t
, which means
that once he saw pedestrian X, which made him
anxious, he tended to keep looking at it.
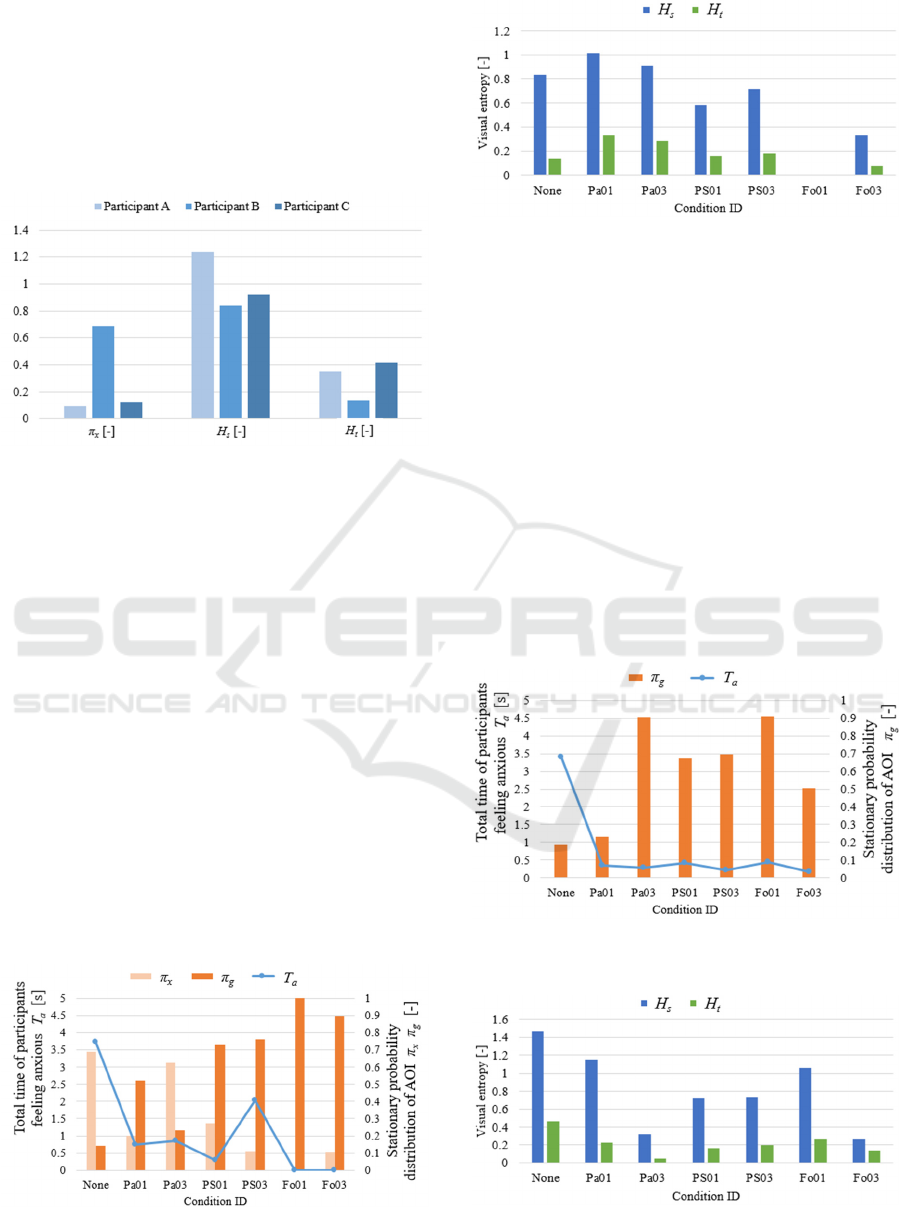
Figure 5: Eye movement of S1’ in the condition without
visual information (ID: None). π
x
is the stationary
probability distribution of AOI-x.
Figures 6 and 7 show the result of the changes in
anxiety and eye movements of participant B under
different visual information conditions. In the
condition with visual information, the amount of time
during which the participants felt anxious was shorter
than in the condition without visual information
(None), and the rate of fixation on X (π
x
), which was
the target of anxiety, decreased while the rate of
fixation on the ground (π
g
), including information
presentation, increased. This result suggests that
visual information attracts passenger attention which
has the effect of diverting the passenger’s attention
from the object that makes them feel anxious.
Especially FOLLOW type has a strong effect of
visual guidance given that both entropy is lower than
others. Comments reveal that high anxiety in PS03
was due to the difficulty in interpreting visual
information.
Figure 6: Anxiety and eye movement of S1’ in different
conditions (Participant B).
Figure 7: Visual entropy of S1’ in different conditions
(Participant B).
4.2.3 Analysis of S2
S2 is where the difficulty in understanding PMV’s
behavior causes anxiety. Participant C felt more
anxious than A and B in S2. Thus, the effect of visual
information on participant C is analyzed.
Figures 8 and 9 show the result of the changes in
anxiety and eye movements of participant C. In the
conditions in which visual information was shown, T
a
decreased while π
g
increased, leading to a decrease in
both entropies. Thus, it can be said that when
passengers feel anxious about PMV’s behavior, they
tend to seek information from their surroundings,
increasing their saccades, and the content of visual
information contributes to reducing this anxiety by
providing clues of PMV’s intention of its behavior.
Figure 8: Anxiety and eye movement of S2 in different
conditions (Participant C).
Figure 9: Visual entropy of S2 in different conditions
(Participant C).
HUCAPP 2023 - 7th International Conference on Human Computer Interaction Theory and Applications
322
5 EVALUATION OF VISUAL
INFORMATION
Results in the previous section suggested two effects
of visual information, which reduce anxiety; visual
guidance that diverts the passenger’s attention from
the object, which might cause anxiety, and providing
content that conveys PMV’s intention of its behavior.
However, this tendency did not consider the influence
of individual differences, and it only focused on
specific sections (S1’ and S2). Thus, an additional
experiment was conducted to evaluate whether it
contributes to reducing anxiety throughout the scene
for a larger number of participants. Nine males and
females with an average age of 23.0 years old (SD =
1.1) participated in this experiment.
Methods of this experiment mostly conform with
the former, except that participants rated their anxiety
after each condition on a 7-point Likert scale, with -3
to -1 feeling relaxed, 0 feeling neutral, and 1 to 3
feeling anxious.
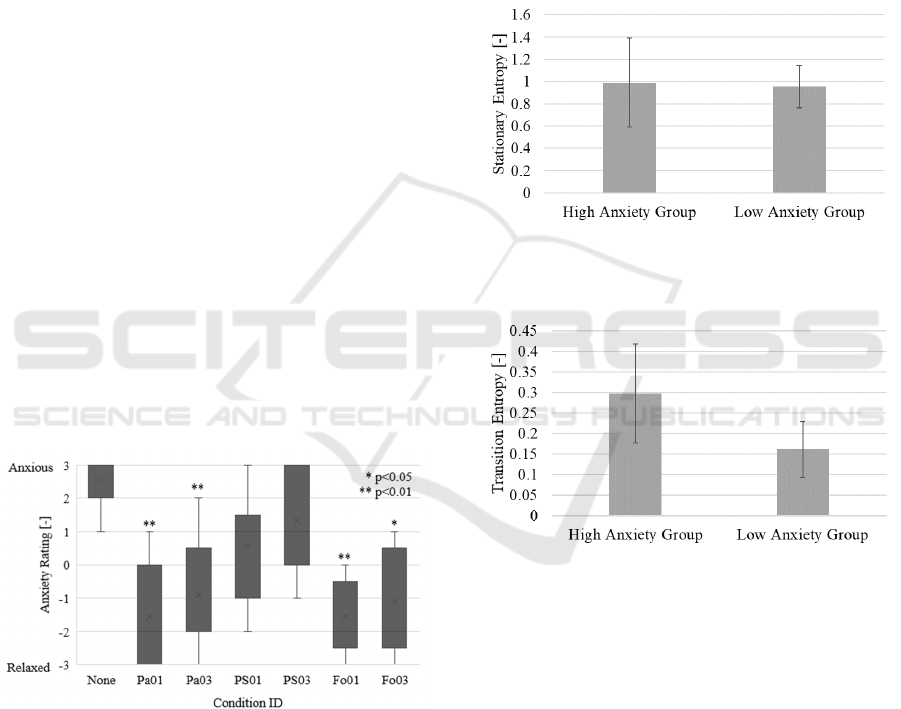
Figure 10 shows the subjective assessment scores
for anxiety under each conditions. Visual information
of PATH and FOLLOW significantly reduced
anxiety, while PS did not. This result might be due to
the difficulty of interpreting PS, as mentioned in
Section 4.2.2. Combined with the results in Section 4,
it can be said that visual information which displays
a path or a leading vehicle has the effect of visual
guidance and intention communication, which
significantly reduces anxiety throughout the scene.
Figure 10: Subjective assessment scores for anxiety under
different conditions. The asterisk indicates a significant
difference from the None condition, which did not display
visual information.
It was also examined whether the findings on
visual behaviour obtained in section 4 would be
applicable to a large group of people. First, the
characteristics of visual behaviour in None condition
were analysed, and then it was clarified how the
behaviour changed when information was presented.
Figure 11 and 12 shows the visual entropy in
condition None which did not provide any visual
information. Participants were classified into two
groups according to their rated anxiety values. Those
who rated their anxiety as 3 points were in the high
anxiety group, and those who rated their anxiety as 1
or 2 points were in the low anxiety group. Results
show that there was no difference in stationary
entropy, while transition entropy increased in the high
anxiety group. This indicates that when passengers
feel anxious, they engage in exploratory visual
behaviour to obtain information that reduces anxiety.
Figure 11: Difference of stationary entropy between the
perception of anxiety among participants in condition
None.
Figure 12: Difference of transition entropy between the
perception of anxiety among participants in condition
None.
Figure 13 describes the transition entropy in
different visual information conditions. Result shows
that visual information has the effect to decrease
transition entropy. This suggests that passengers no
longer engaged in exploratory visual behaviour
because they found that visual information provided
content that could alleviate their anxiety, which is
likely to be the PMV’s intention of its behaviour.
Moreover, this experiment also suggested that
visual information was effective in reducing the
anxiety associated with approaching pedestrians by
visual guidance. Figure 14 describes the stationary
probability distribution of AOI in different visual
information conditions. Result shows that visual
Can Visual Information Reduce Anxiety During Autonomous Driving? Analysis and Reduction of Anxiety Based on Eye Movements in
Passengers of Autonomous Personal Mobility Vehicles
323
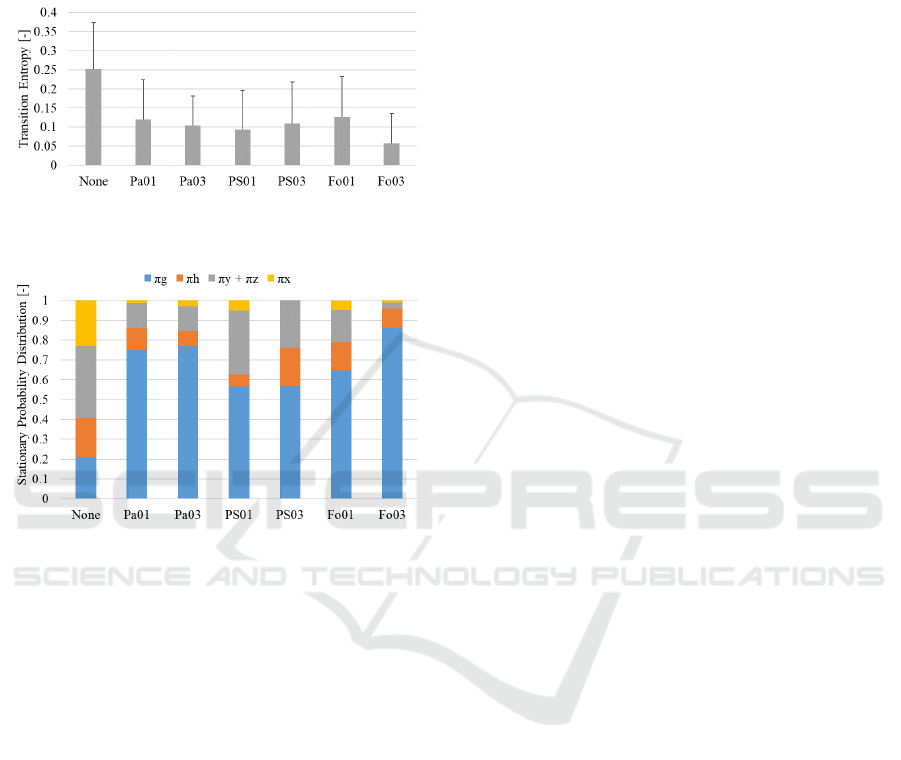
information increases the stationary probability
distribution of AOI-g while decreases AOI-x which
includes the pedestrian that provokes anxiety. This
effect was more pronounced in the visual condition
which significantly reduced anxiety (Fig.10).
Figure 13: Transition entropy in different visual
information conditions.
Figure 14: Stationary probability distribution of AOI in
different visual information conditions.
6 CONCLUSIONS
In this study, the relationship between anxiety and eye
movements of autonomous PMV passengers was
investigated in an experiment using a driving
simulator. As a result, the following human
characteristics were obtained:
• In the experimental scene in this study, there
were two types of anxiogenic factors: proximity
of pedestrians and sudden change in behavior of
the PMV.
• People who feel anxious about the proximity of
pedestrians tend to fixate on the pedestrian for a
longer period of time and find it difficult to
change their fixation on other objects.
• People who feel anxious about the sudden
change in behavior of the PMV tend to increase
saccades and explore surrounding information.
In addition, the effect of visual information on
anxiety and the reason for it were investigated. The
followings are the findings obtained in this study:
• By the effect of visual guidance of the visual
information, it was able to divert attention from
the pedestrian which gives them anxiety and
make the passenger feel relatively relaxed.
• Visual information had the effect of conveying
the PMV’s intentions for future behavior, which
reduced passenger’s anxiety when the PMV
makes abrupt movements.
From this research, it is suggested that when
humans feel anxiety, they search for the cause of
anxiety, and when they identify it, they try to obtain
information by paying attention to the object which
gives them clues for future situation.
However, the scene of the experiment was limited
in this study. Thus, further investigations in more
diverse scenes are needed, such as a scene with a
sudden change in velocity, gaining a deeper
understanding of the relationship between passenger
anxiety and eye movements. Furthermore,
considering the actual implementation of information
presentation in society, it will be necessary to
examine information projection methods such as
using MR glasses and conduct experiments in real
environments.
ACKNOWLEDGEMENTS
This paper is based on results obtained from a project,
JPNP18014, commissioned by the New Energy and
Industrial Technology Development Organization
(NEDO).
REFERENCES
Ciuperca, G., Bernard, C., (2005). On the estimation of the
entropy rate of finite Markov chains, In Proceedings of
the international symposium on applied stochastic
models and data analysis, pp. 1109-1117.
Dillen, N., Ilievski, M., Law, E., Nacke, L. E., Czarnecki,
K., & Schneider, O. (2020). Keep calm and ride along:
Passenger comfort and anxiety as physiological
responses to autonomous driving styles. In Proceedings
of the 2020 CHI conference on human factors in
computing systems, pp. 1-13.
Fox, D., Burgard, W., Thrun, S., (1997). The dynamic
window approach to collision avoidance, In IEEE
Robotics & Automation Magazine, Vol. 4, No.1, pp. 23-
33.
Hall, E. T. (1966). The hidden dimension, New York:
Doubleday.
Helbing, D., Molnar, P., (1995). Social force model for
pedestrian dynamics, Physical Review E, Vol. 51, pp.
4282-4286.
HUCAPP 2023 - 7th International Conference on Human Computer Interaction Theory and Applications
324

Isono, Y., Yoshitake, H., Shino, M (2022). Passenger
comfort recognition during autonomous navigation of
personal mobility vehicles in crowded pedestrian
spaces., In Proceedings of the 17th International Joint
Conference on Computer Vision, Imaging and
Computer Graphics Theory and Applications, Vol. 2,
HUCAPP, pp. 58–67. INSTICC, SciTePress.
Janelle, C. M., (2002). Anxiety, arousal and visual
attention: A mechanistic account of performance
variability. Journal of Sports Sciences, Vol. 20, pp.
237–251.
Kitajima, M., Toyota, M. (2013). Decision-making and
action selection in Two Minds: An analysis based on
Model Human Processor with Realtime Constraints
(MHP/RT). Biologically Inspired Cognitive
Architectures, Vol. 5, pp. 82-93.
Krejtz, K., Duchowski, A. T., Krejtz, I., Kopacz, A.,
Chrząstowski-Wachtel, P., (2016). Gaze transitions
when learning with multimedia, Journal of Eye
Movement Research, Vol. 9, No.1, pp. 1-17.
Lazarus, R. S., Folkman, S. (1984). Stress, appraisal and
coping. New York: Springer.
Roseman, I. J., (2001). A model of appraisal in the emotion
system: Integrating theory, research, and applications,
In K. R. Scherer, A. Schorr, T. Johnstone (Eds.),
Appraisal processes in emotion, Oxford University
Press, pp. 68–91.
Salvucci, D. D., Goldberg, J. H. (2000). Identifying
fixations and saccades in eye-tracking protocols. In
Proceedings of the 2000 symposium on Eye tracking
research & applications, pp. 71-78.
Shiomi, M., Zanlungo F.,Hayashi K., Kanda T. (2014).
Towards a Socially Acceptable Collision Avoidance for
a Mobile Robot Navigating Among Pedestrians Using
a Pedestrian Model, International Journal of Social
Robotics, Vol. 6, pp. 443-455.
Watanabe, A., Ikeda, T., Morales, Y., Shinozawa, K.,
Miyashita, T., Hagita, N., (2015). Communicating
robotic navigational intentions, 2015 IEEE/RSJ
International Conference on Intelligent Robots and
Systems (IROS), pp. 5763-5769
Can Visual Information Reduce Anxiety During Autonomous Driving? Analysis and Reduction of Anxiety Based on Eye Movements in
Passengers of Autonomous Personal Mobility Vehicles
325
