
An Agent-Based Model Study on Subsidy Fraud Risk in
Technological Transition
Hao Yang, Xifeng Wu and Yu Chen
SCS Lab, Department of Human and Engineered Environment, Graduate School of Frontier Sciences,
The University of Tokyo, Chiba 277-8563, Japan
Keywords: Agent-Based Model, Technological Transition, Subsidy Fraud, Subsidy Policy.
Abstract: In modern society, government subsidy policies play a pivotal role in developing new technologies. Although
subsidy policies have a long history, the resulting subsidy fraud problem consumes social resources and
hinders the development of new technologies. In this paper, we attempt to derive the factors affecting the risk
of performing the subsidy fraud based on a validated agent-based model for technological transition. We first
review the literature on subsidies and the definition of subsidy policies. We perform a mathematical analysis
of the agent-based model and calculate the critical value for subsidy rates, which may cause a dramatic change
in the probability of subsidy fraud to occur. We conducted a series of numerical experiments to show the
validity of the critical subsidy rates. And we also correlates and classifies three scenarios between the situation
of technology diffusion and development and the risk of subsidy fraud. Finally, the causal factors of subsidy
fraud are examined by analyzing the various stakeholders involved in the subsidy fraud in the actual situation.
1 INTRODUCTION
Technological innovation is of great importance for
the development of human society. Especially in
modern societies, national innovation ability is
essential in measuring modern countries’
development level and their potential. There is a
critical need for the government to help and stimulate
technological innovation in the country. Subsidies for
specific industries, particularly for those new
technology industries, are widely used to achieve this
goal.
As the opposite of taxation, subsidies to
enterprises are considered part of government
spending and non-reimbursable payments by the
government to targeted enterprises. However, when
we strictly define the concept of "subsidy,” we find
that the concept has been evolving, and the definition
has been formally made differently across countries,
regions, and industries.
The World Trade Organization (1999) defines the
concept of "subsidies" in great detail to reconcile the
interests of the members of each organization. The
core idea is that "subsidies" are defined as indirect
financial support in the form of direct transfers
(grants, loans, capital injections, etc.), tax breaks, and
government (other than the general infrastructure)
purchases to specific industries or enterprises, either
with a direct government capacity or indirectly
through the establishment of agents.
However, according to R.Steenblik (2003),
statisticians and economists classify subsidies into
different types depending on what is covered and how
they are calculated. For example, distinctions are
made according to the target, the benefits route, etc.
Different calculation methods will result in benefits
for different recipients of subsidies, which may
further result in different results on the calculation of
the size and impact of subsidies. In the literature,
however, it has been noted that differences in the
analysis of subsidies within different industries are
often a consequence of historical factors and the
prerogatives of the policy groups targeted by the
research rather than inherent differences within the
sectors under investigation (World Trade
Organisation, 1999). This fundamental conflict of
interest, in turn, makes it more challenging to make
an unambiguous definition of "subsidy" that can be
widely accepted. As Hendrik S. Houthakker (1972)
states: "My starting point was also an attempt to
define subsidies. However, in the course of doing so,
I concluded that the concept of a subsidy is just too
elusive. " Rather than reading too much into the
412
Yang, H., Wu, X. and Chen, Y.
An Agent-Based Model Study on Subsidy Fraud Risk in Technological Transition.
DOI: 10.5220/0011801200003393
In Proceedings of the 15th International Conference on Agents and Artificial Intelligence (ICAART 2023) - Volume 1, pages 412-421
ISBN: 978-989-758-623-1; ISSN: 2184-433X
Copyright
c
2023 by SCITEPRESS – Science and Technology Publications, Lda. Under CC license (CC BY-NC-ND 4.0)

definition of subsidies in our study, we take a
fundamental approach, defining a subsidy as "a
gratuitous payment based on the cost of production of
the firm."
Sound effects are only occasionally produced by
subsidy policies. Subsidy fraud is a crime that
accompanies subsidy policy and has long plagued the
government. In traditional studies, subsidy fraud is
often associated with tax evasion. The neoclassical
economic model of tax fraud proposed by Allingham
and Sandmo (1972) is considered one of the
cornerstones of the financial analysis of tax evasion.
It shows how individuals decide to evade taxes and
how the government will eventually punish them.
However, the model cannot explain the low levels of
fraud at soft penalty and detection rates (Chica M et
al., 2021). In the study by Prichard et al. (2014), an
attempt was made to explore the reasons for the
failure of the above model. Two possible paths were
introduced to address the limitations of the
neoclassical model, namely the empirical research
and the agent-based model (ABM). This paper will
mathematically derive the critical factor that may
cause subsidy fraud by analyzing an established ABM
for technological transformation.
In our previous study (Yang et al., 2021), we
conducted a preliminary analysis of the agent-based
model proposed by Lopolito.A et al. (2013). In this
paper, we shall extend our previous study to complete
the following three tasks:
(1) Derive the critical subsidy rates.
(2) Conduct numerical experiments to show the
effects of these critical rates.
(3) Relate the derived subsidy rates with the
subsidy fraud in reality.
2 MODEL
2.1 Model Descriptions
The conceptual framework of the agent-based model
for technological transition is shown in Fig 1.
Our model has two types of agents, firm agent and
spreader agent. The firm agent may transform from
the primary state to the supporter state and/or
switcher state through the coupling of three
mechanisms. The supporter state means "the state in
which the agent supports the new technology,” and
the switcher state means "the state in which the state
uses the new technology for its production activities.”
Figure 1: Conceptual framework of the agent-based model
for technological transition.
On the other hand, as shown on the right side of
Figure 1, we divide the model space into three
abstract layers: the primary activity space, the
supporter activity space, and the switcher activity
space, which correspond to different states of the firm
agents.
The bottom left of Figure 1 shows the two policy
tools in our model, namely the lobbying policy and
the subsidy policy, which affect the firm agents and
spreader agents, respectively.
In the following text, we give details of each part
of the model.
2.1.1 Basic Assumption
We assume that there are two technologies in the
market, the new technology and the old technology,
and assume that the market has reached equilibrium
when the old technology is used.
We use 𝛱
,
and 𝛱
,
to represent the profit
obtained by using the old technology and the new
technology, respectively.
𝛱
,
=𝑅
,
−𝐶
,
=0 , (1)
𝛱
,
=
𝑅
−𝐶
,
𝑤𝑖𝑡ℎ 𝑝𝑟𝑜𝑏𝑎𝑏𝑖𝑙𝑖𝑡𝑦 𝑝
0.5𝑅
−𝐶
,
𝑤𝑖𝑡ℎ 𝑝𝑟𝑜𝑏𝑎𝑏𝑖𝑙𝑖𝑡𝑦 1 −𝑝
(2)
where 𝛱
,
, 𝑅
,
and 𝐶
,
represent the profit, revenue
and cost associated with the production at time 𝑡 of
firm 𝑖 which use the traditional technology; 𝛱
,
, 𝑅
and 𝐶
,
represent the profit, revenue and cost
associated with the production at time 𝑡 of firm 𝑖
which use the new technology.
In addition, for the case that a company choose to
use the new technology but leads to failure, we set the
profit to be 0.5𝑅
. The reason for setting the
coefficient 0.5 is that we want to be able to describe
the expectation using the success probability 𝑝
exclusively. Consider that for a new technology with
a risk of failure, the net profit deviation from the
original technology will not be large when it is first
An Agent-Based Model Study on Subsidy Fraud Risk in Technological Transition
413

adopted by the company. A setting higher than 0.5
would easily lead to a failure penalty that is too small,
corresponding to a situation where the new
technology outperforms the old one across the board
and all companies would adopt it quickly; a setting
less than 0.5 would again lead to a failure penalty that
is too severe, thus making it difficult for the new
technology to produce a stable state within the time
period we set for the experiment, which means that
the new technology would develop too slowly.
Therefore we set it to 0.5, because too high or too low
would lead to trivial dynamics.
The firm agent is mainly controlled by three
mechanisms, namely, the expectation mechanism,
networking mechanism, and learning mechanism,
which work together and maintain the transformation
process of the firm agent to supporter and switcher.
2.1.2 Expectation Mechanism
Expectation mechanism mainly controls the
parameter 𝑒𝑥
,
. The parameter 𝑒𝑥
,
represents firm
𝑖's expectation of the new technology at time 𝑡. The
Expectation mechanism affects the magnitude of the
parameter 𝑒𝑥
,
in the following two ways.
1) The parameter 𝑒𝑥
,
is positively correlated with
the profit generated after using the new technology.
𝑒𝑥
,
=𝑒𝑥
,
+𝛱
,
, (3)
2) Increase the expectation value of the new
technology when the firm agent meets with the
spreader agent.
𝑒𝑥
,
=𝑒𝑥
,
+𝜂, (4)
where 𝜂 means a control parameter the lobbying
effect on new technologies when a firm agent
encounters a spreader agent.
2.1.3 Networking Mechanism
The Networking mechanism mainly controls the
generation of supporter networks and the related
parameter changes.
Establishment of Supporter Network
When two firm agents are supporters of a new
technology and are close enough to each other, the
two firm agents will establish a connection.
It should be noted that since we use the Netlogo
platform to run our program, we define "close
enough" between the two firm agents as being in the
same patch.
Once the connection is established, the firm agent
that becomes a supporter can join the supporter
network and share the resources in the network.
When a firm agent no longer supports new
technology, the agent will quit the supporter network.
At this time, all the ties connected to this agent will
be broken.
Here we introduce a matrix 𝑒
for the linkage for
the network as the following
𝑒
=
1 𝑖𝑓 𝑖 𝑎𝑛𝑑 𝑗 𝑎𝑟𝑒 𝑙𝑖𝑛𝑘𝑒𝑑
0 𝑖𝑓 𝑖 𝑎𝑛𝑑 𝑗 𝑎𝑟𝑒 𝑛𝑜𝑡 𝑙𝑖𝑛𝑘𝑒𝑑
. (5)
When a connection is generated between firm 𝑖 and
firm 𝑗, 𝑒
is equal to 1, otherwise it is 0. And in each
turn of the simulations, we update 𝑒
first, then we
will calculate the other state variables.
Resource Sharing in Supporter Network
For each firm agent, we define the individual power
(𝐼
,
) as all its shareable resources related to the
new technology other than knowledge.
We assume that in a supporter network,
companies will share not only their knowledge, but
also their R&D and production experience. These are
essential to reduce the production costs of using new
technologies.
Therefore, we update the cost of using new
technologies in each round in the following way.
𝐶
,
=𝐶
,
−𝑐∙𝐼
,
−
𝑛∙
∑
𝑒
∙𝐼
,
+𝐼
,
,
,
(6)
where c and n are parameters that adjust the impact of
individual and aggregated powers, the latter of which
is defined as the sum of the individual power of two
endpoint of all ties, as shown in Eq. 6.
2.1.4 Learning Mechanism
We assume that the members of the supporter
network will share their knowledge ( 𝐾
,
) about
using the new technology with each other and thus
reduce the cost of using the new technology.
The learning mechanism mainly affects the
success rate of profitability after using the new
technology.
𝐾
,
=𝑟𝑎𝑛𝑑𝑜𝑚
𝐸𝑣𝑒𝑛𝑙𝑦 𝑑𝑖𝑠𝑡𝑟𝑖𝑏𝑢𝑡𝑒𝑑
𝐾
,
=𝐾
,
+𝜃𝐾
,
,
(7)
𝑅𝑠𝑘
=𝑅𝑠𝑘
−𝜀∙
∑
𝑒
∙
𝐾
,
+𝐾
,
,
, (8)
where 𝐾
,
represents the knowledge of firm 𝑖 at time
𝑡 , 𝑅𝑠𝑘
represents failure rate of using the new
technology to all the firm agents at time 𝑡, 𝜃 and 𝜀 are
the parameters that adjust the effect of 𝐾
,
.
ICAART 2023 - 15th International Conference on Agents and Artificial Intelligence
414

2.1.5 Technological Transition
Finally, we control the transformation of firm agent
to supporter and switcher by two conditions.
a) For the condition of whether to become a
supporter
𝑠𝑢𝑝
,
=
1 𝑖𝑓 𝑒𝑥
,
>𝑒𝑥
0 𝑖𝑓 𝑒𝑥
,
≤𝑒𝑥
, (9)
when 𝑠𝑢𝑝
,
=1,firm 𝑖 transformed into supporter.
b) For the judgment condition of whether to become
switcher
𝑠𝑤
,
=
1 𝑖𝑓 𝐸𝛱
,
≤0
0 𝑖𝑓 𝐸𝛱
,
>0
, (10)
when 𝑠𝑤
,
=1,firm 𝑖 transformed into switcher.
Firm agents are mainly active in 3 abstract spaces.
The first space where firm agents can randomly
roam is called activity space. Activity space
represents the abstract social network space rather
than geographic space.
When a firm agent becomes a supporter,
supporters can build a network. The networking
mechanism mainly controls this process. We assume
that when the distance between two agents satisfies
certain conditions, a connection based on social
relations of identification with the new technology
can be established between each other. This
connection allows both endpoints to share part of the
knowledge and information about the new technology.
At this point, the agents that meet the conditions to
join the supporter network enter the second layer of
Activity Space - Supporter.
When a firm agent satisfies the condition to
become a switcher, it can enter the third activity space
- Switcher from the first or second space.
2.1.6 Policy Tools
The policy tools in our model consist of two main
components: lobbying policy and subsidy policy.
Lobbying policy mainly controls the number of
another type of agent, the spreader agent. The
spreader agent is not involved in the production but
focuses on the diffusion of new technologies. It
represents the government's efforts to diffuse new
technologies in real life. When the Spreader agent
meets the firm agent, the spreader introduces and
promotes the new technology, while the
corresponding firm agent increases the understanding
and confidence in the new technology. The control of
lobbying policy in our model is mainly reflected in
the number of spreader agents. Our model’s number
of spreader agents increases as the government
invests more in lobbying policy. In turn, the
encounter probability between the firm agent and the
spreader agent is increased to achieve the effect of
propaganda and lobbying for the new technology.
Subsidy policy mainly controls the size of the
subsidy. As we explained in the previous section, a
subsidy policy is very important for a technology that
is not yet mature. However, the size of the subsidy
should be strictly controlled and reviewed. Too few
subsidies do little to help develop and sustain new
technologies, while too many subsidies can lead to
subsidy fraud. Such subsidy fraud consumes social
resources and may reduce the public's awareness and
enthusiasm for new technologies. Both are heavy
blows to the development of new technologies. How
to set the size of subsidies reasonably to guide the new
technology to maturity is precisely the problem we
want to solve.
3 RESULTS
Our main results have three parts. As we have
previously described, there is currently no accepted
definition of "subsidy" or "subsidy fraud" in the
academic community. In our model, we describe
subsidy fraud as an observable risk measure. It is
mainly described by the number of Supporters and
Switchers and their relationship with each other.
Our model theory builds on the multi-level
perspective (MLP) framework developed by Geels et
al. (2002, 2020).
MLP divides technology development into
horizontal directions representing the maturity and
diffusion of technology: Emergence stage, Diffusion
stage, and Reconfiguration stage, and vertical
directions representing the state of access to the
public and the degree of impact on social structures:
Niche innovations, Social-financial regime, and
Landscape development.
Thus, a mature technology should not only be
successful in the development and diffusion of the
technology itself but also profoundly impact public
perception and social structure.
Combined with our model, the number of
companies that become supporters and the number of
companies that become switchers are both high to be
considered a well-developed and booming
technology.
Under normal circumstances, a company should
first understand and see the new technology and then
try to use it for production. However, when a
technology has a high number of switchers with a low
An Agent-Based Model Study on Subsidy Fraud Risk in Technological Transition
415
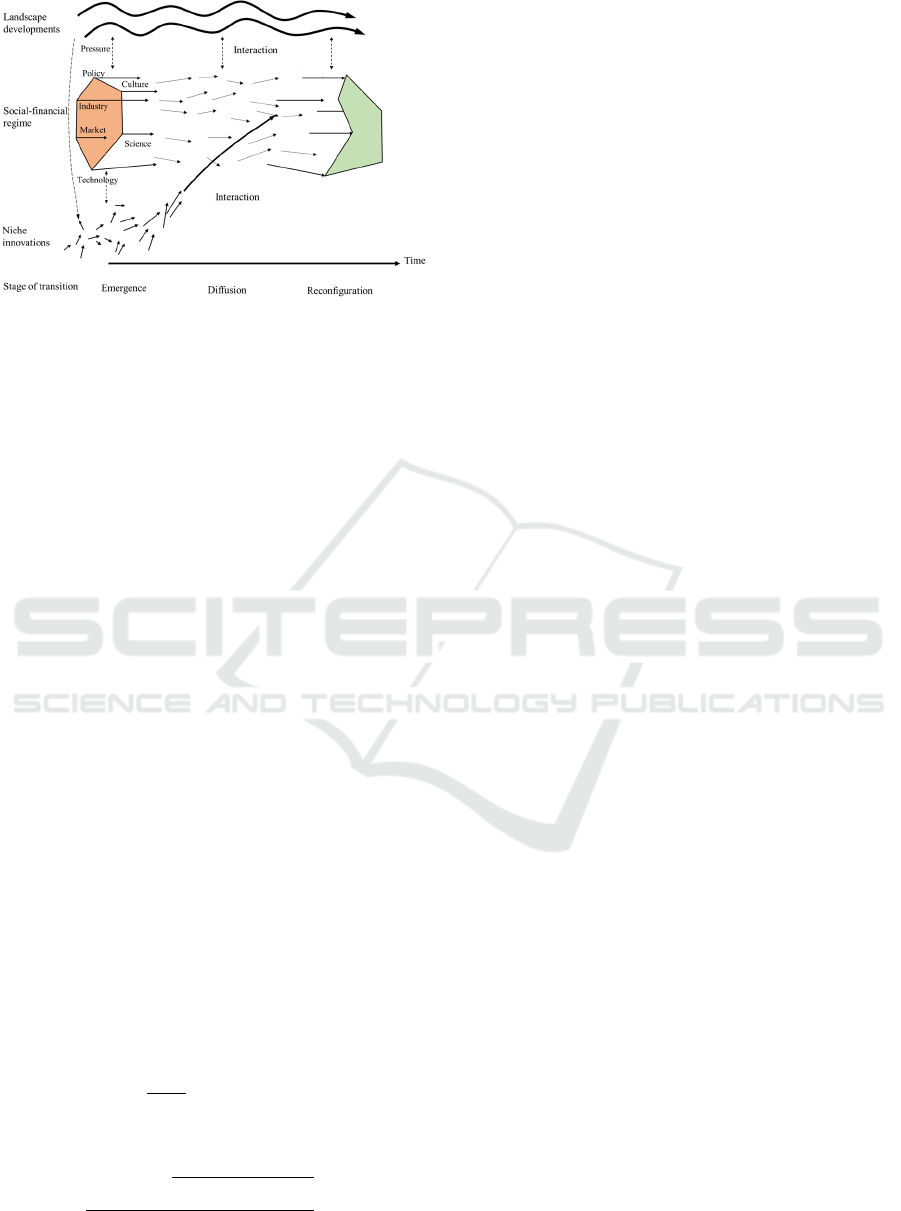
Figure 2: The multi-level perspective on sustainability
transitions (Geels et al., 2020).
number of supporters, we consider the model
anomalous. In the actual numerical simulation, we
found that such anomalies occur steadily when the
size of the subsidy is more significant than specific
values. Therefore, we classify this situation as a
"description of the risk of subsidy fraud.” And due to
our model setup, the number of supporters and the
number of switchers are counted separately and do
not affect each other. So, when the number of
switchers in the model is steadily higher than the
number of supporters, we believe that the probability
of subsidy fraud is higher.
The values of all other parameters required in the
experiments are given in appendix.
3.1 The Critical Condition
3.1.1 Derive the Critical Value
For a firm who is making decision on the adoption of
the new technology, we assume that the higher the
expectation of the new technology, the higher
expectations of the profit, and the lower expectations
of the cost. This assumption means that 𝐸
𝑅
is
proportional to 𝑒𝑥
,
, and 𝐸𝐶
,
and 𝑒𝑥
,
are
inversely related with each other. From the model, it
can be seen that the conditions for firms to use the
new technology are as follow:
𝐸𝛱
,
=𝐸
𝑅
−𝐸𝐶
,
+𝑆𝑢𝑏𝑠𝑖𝑑𝑦
(11)
=𝑒𝑥
,
∙𝑅
−
1
𝑒𝑥
,
∙𝐶
,
+𝑆𝑢𝑏𝑠𝑖𝑑𝑦>0
Therefore:
𝑒𝑥
,
>
∙
∙
,
∙
≝𝑒𝑥
(12)
We can find three important conditions by
changing the size of subsidy (shown as in Table 1).
In our model, under normal circumstances, firms
go through three states: neutral, supporter, and
switcher, depending on their expectations of the new
technology and the benefits of using it, which
represent, respectively, "neutral attitude toward the
new technology". They represent, "supportive
attitude towards new technology", "using new
technology for production".
From Eq. 11 and Eq. 12, we set the condition of
the state variable 𝑒𝑥
,
that satisfies the condition of
making firm agent a switcher under the corresponding
subsidy policy as 𝐸
; the condition of the
parameter 𝑒𝑥
,
that satisfies the condition of making
firm agent a supporter as 𝐸
; the condition of the
parameter 𝑒𝑥
,
that satisfies the condition of making
firm agent a neutral as 𝐸
.
At this point, we can derive three important
boundary conditions based on the size of the subsidy
and the relationship between the condition of
becoming supporter and the condition of becoming
switcher.
At the initial stage, all the firm agents have a
neutral rather than supportive attitude to the new
technology.
1. when there is no subsidy policy, the boundary
condition that 𝑒𝑥
needs to satisfy is set 𝐸
.
2. when the condition of being switcher is weaker
than the condition of being supporter, the
boundary condition that 𝑒𝑥
needs to satisfy is
set to 𝐸
.
𝑒𝑥
≤𝐸
(13)
3. when the condition of becoming switcher is
weaker than the condition of becoming neutral,
the boundary condition to be satisfied by the 𝑒𝑥
is set to 𝐸
.
𝑒𝑥
≤𝐸
(14)
From Eq. 13 and 14, after substituting the
numerical calculation, we can get the critical size of
the subsidy as 20.8% and 125%, which are derived
from Eq. 12.
1. When 𝑆𝑢𝑏𝑠𝑖𝑑𝑦≤20.8%, the condition to
become a switcher is stronger than the condition
to become a supporter. In other words, the
prerequisite for becoming a switcher is to
become a supporter.
2. But when 𝑆𝑢𝑏𝑠𝑖𝑑𝑦>20.8%, the situation will
change, and the prerequisite is no longer
necessary. Because the government subsidies are
too solid, many firms are willing to try to use new
ICAART 2023 - 15th International Conference on Agents and Artificial Intelligence
416

technology for production even if they have not
yet become supporters of it.
3. When 𝑆𝑢𝑏𝑠𝑖𝑑𝑦>125% , the condition to
become a switcher is more vital than the
condition to become neutral. Regardless of the
attitude toward the new technology, all firm
agents will immediately switch to the new
technology because of the excessive subsidy.
In our paper, the subsidy rate is associated with
the cost. Therefore, we introduce two parameters 𝛽
and 𝛾 and set them to 20.8% and 125%, respectively.
And use a form like 𝛽∙𝐶
,
or 𝛾∙𝐶
,
to express the
size of the subsidy.
Table 1: Conditions to become a switcher.
Subsidy Size
Critical
expectation
for a switcher
Condition to
become a switcher
0
(
No subsid
y)
𝑒𝑥
≤𝐸
Stronger than to
b
ecome a supporte
r
>𝛽∙𝐶
,
𝑒𝑥
≤𝐸
Weaker than to
b
ecome a su
pp
orte
r
>𝛾∙𝐶
,
𝑒𝑥
≤𝐸
No condition to
b
ecome a switche
r
*
Condition to become a supporter: 𝑒𝑥
,
>0.75
Therefore, we believe that when the size of the
subsidy is between 0 and 𝛽∙𝐶
,
, the subsidy is
reasonable and the probability of subsidy fraud is
small; however, when the size of the subsidy is
between 𝛽∙𝐶
,
and 𝛾∙𝐶
,
, there is a high risk of
subsidy fraud due to unreasonable subsidy setting;
when the size of the subsidy is larger than 𝛾∙𝐶
,
, the
subsidy setting is exceptionally unreasonable, and
there is a very high risk of subsidy fraud.
3.2 Scenarios
It should be noted that for the development of the
technology, there are two important state variable in
our model, one is the number of supporter and the
other is the number of switcher. We describe
development of the technology diffusion by
comparing these two quantities. The development
rate of new technologies can be interpret as the rate
of which the number of supporter and switcher
approaches 100%. It is worth mentioning that the
same firm agent can be identified of both supporter
and switcher.
We believe that normally a company should
understand a technology and become a proponent of
the new technology before it may decide to use it.
Therefore for the case of skipping the supporter stage
and becoming a direct switcher, we believe that the
risk of subsidy fraud would be high. We will define
the following three scenarios for development of
technology diffusion in order to discuss the risk of the
subsidy fraud respectively.
3.2.1 Success Diffusion (SD) Scenario
When the number of supporter is more than the
number of switcher, both of them increase rapidly.
This means that the development of the new
technology is good. Eventually both are close to
100%, then it means that the development of the new
technology is successful. This development pattern is
the best quality pattern. Therefore, we define this
scenario as SD Scenario, which means the success
diffusion scenario.
3.2.2 Failure Diffusion & Low Risk (FDLR)
Scenario
When the number of supporter is more than the
number of switcher, both of them increase rapidly.
But eventually both are less than 100%, or the number
of switcher is less than 100%, then it means that the
development of new technology is not very successful.
Improved policies are needed to stimulate the
proliferation and development of new technologies.
However, the probability of subsidy fraud in this
development model is low, because most firm agents
become supporter first and then switcher. Therefore,
we define this scenario as FDLR Scenario, which
means the failure diffusion and low subsidy fraud risk
scenario.
3.2.3 Failure Diffusion & High Risk (FDHR)
Scenario
In some cases, when the number of switcher is
significantly more than the number of supporter, it is
thought that the way of development is not very
healthy. There are a large number of companies that
do not understand the new technology that are using
it in exchange for subsidies, and at this point we
believe that there is a higher risk of subsidy fraud.
Therefore, we define this scenario as FDHR Scenario,
which means the failure diffusion and high subsidy
fraud risk scenario.
3.3 Numerical Experiments
In this subsection, we conduct numerical experiments
for the critical values derived in the previous
subsection. Our model is based on the Netlogo
platform, and each experiment is generated by
running a population of N = 100 firms located on a 32
An Agent-Based Model Study on Subsidy Fraud Risk in Technological Transition
417
× 32 grid. Each experiment will consist of 2600 time-
steps to simulate the evolution of a company that
makes technology decisions once a week for
approximately 50 years. Because even based on the
same parameter settings, the model is still affected by
random factors. As a result, we plot the average of
100 experiments under the same initial conditions. In
this way, we can eliminate the influence of random
factors as much as possible and further ensure the
stability of our results. The following is an analysis of
the figure results.
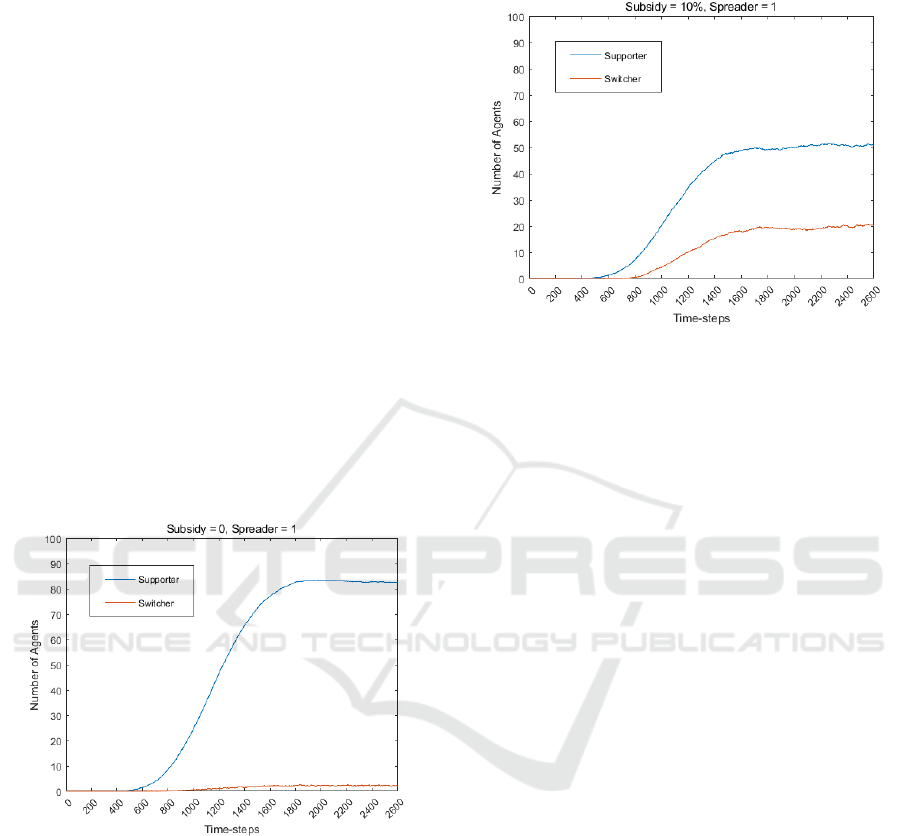
3.3.1 No Subsidy Policy
In the first scenario, the government adopts a policy
of no subsidy rates, which is equal to 0 (Subsidy =
0%).
As shown in Fig 3, we can see that the technology
diffusion development is very smooth, and the
number of supporters is going up until it is smooth.
However, technology development only takes off
because of the lack of policy support. Finally, the
number of switchers is low.
This is a typical FDLR scenario. We name this
scenario the FDLR scenario
Ⅰ
Figure 3: The numerical experiment of FDLR scenario Ⅰ
0 - 2600 time-steps: Subsidy = 0 , Spreader = 1.
3.3.2 Low Risk Range of Subsidy Fraud
In the second scenario, the government adopts a
policy of low subsidy rates, which is between 0 and
𝛽∙𝐶
,
(Subsidy = 10%).
As shown in Fig 4, we can see that the technology
is developing more rapidly than in the first case; the
number of supporters is increasing until it plateaus.
The number of final switchers has increased because
of sufficient policy support. This also means that the
risk of subsidy fraud is low at this scenario.
This is also a kind of FDLR scenario. We name
this scenario the FDLR scenario
Ⅱ
Figure 4: The numerical experiment of FDLR scenario Ⅱ
0 - 2600 time-steps: Subsidy = 10% , Spreader = 1.
3.3.3 Middle Risk Range of Subsidy Fraud
In the third scenario, the government adopts a policy
of high subsidy rates, which is between 𝛽∙𝐶
,
and 𝛾∙
𝐶
,
(Subsidy = 21%).
This case has been described in detail in our
previous study (Yang et al., 2021). When the subsidy
rate is set between Critical value Ⅱ and Critical value
Ⅲ, As shown in Fig 5, the number of supporters and
switchers increases rapidly to 100%. However, this
situation holds only when the subsidy policy is
maintained. If we remove the subsidy policy, the
number of switchers immediately returns to the state
when it is not subsidized. This represents a complete
policy failure, consuming a large amount of revenue
without really generating the goal of promoting the
diffusion and development of new technologies.
At this point we consider the risk of subsidy fraud
to be slightly higher. The reason is that after the
subsidy is removed, the firm agent abandons the new
technology in large numbers. The utilization rate of
the new technology has dropped to almost single
digits. So this development model we think is an
unhealthy way of development.
This is also a kind of FDHR scenario. We name
this scenario the FDHR scenario
Ⅰ
ICAART 2023 - 15th International Conference on Agents and Artificial Intelligence
418
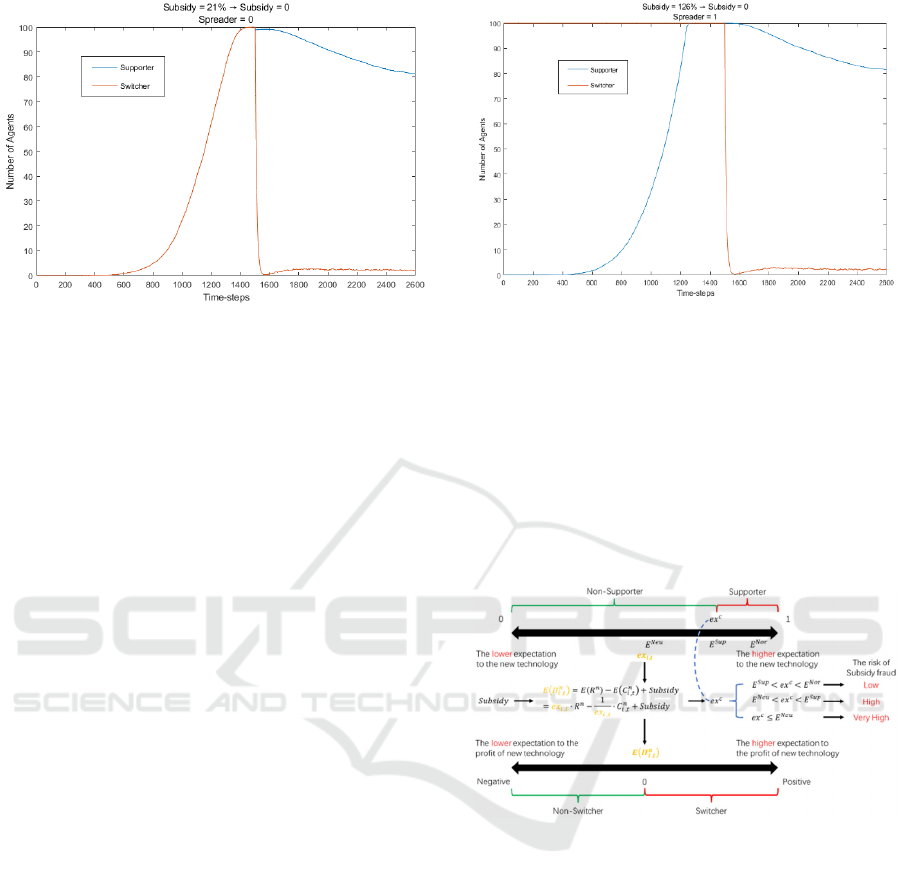
Figure 5: The numerical experiment of FDHR scenario Ⅰ
0 - 1500 time-steps: Subsidy = 21% , Spreader = 1 ;
1500 - 2600 time-steps: Subsidy = 0 , Spreader = 1.
3.3.4 High Risk Range of Subsidy Fraud
In the fourth scenario, the government adopts a policy
of super high subsidy rates, which is bigger than 𝛾∙
𝐶
,
(Subsidy = 126%).
In another numerical experiment, we find that if
the subsidy amount exceeds 125%, all firms will
instantly become switchers. Then, as time increases,
every firm will gradually become a supporter, and the
market becomes steady. However, after it, if we
cancel the subsidy, we can find that the proportion of
switchers has decreased to single digits in a short
period, and the proportion of supporters has
continued to decrease until it stabilizes at around
80%, see the details in Fig. 6.
In the end, it is consistent with the previous case
and returns to the steady state under the same
parameter setting. This also means the complete
failure of the policy.
At this point we believe that almost all the firm
agents in the market are using new technologies for
the sake of subsidies. Too strong subsidy policy, so
that those who were in a neutral attitude, but also
directly began to use the new technology. It is a very
unhealthy way of development.
This is a typical FDHR scenario. We name this
scenario the FDHR scenario
Ⅱ.
3.4 Mechanism and Principal Analysis
We have organized the mechanism of the model and
obtained the following mechanism diagram of the
model. As shown in Fig 7.
Regarding how the firm agent converts to
supporter or switcher, it is mainly influenced by the
parameters 𝑒𝑥
,
and 𝐸𝛱
,
, respectively. And the
Figure 6: The numerical experiment of FDHR scenario Ⅱ
0 - 1500 time-steps: Subsidy = 126% , Spreader = 1 ;
1500 - 2600 time-steps: Subsidy = 0 , Spreader = 1.
subsidy fraud risk of the firm agent in the model
system is mainly controlled by the magnitude of the
variable 𝑒𝑥
.
According to our previous conclusion, the risk of
subsidy fraud can be minimized at the source when
the following conditions are satisfied.
𝐸
𝑒𝑥
𝐸
(5)
Figure 7: Mechanism diagram of the model.
Moreover, this leads to another question: why are
subsidies less likely to be fraudulent when they are in
this range?
In conjunction with Fig 7. we try to shed light on
the fundamental mechanisms of subsidies. As shown
in Fig 8., we illustrate the principles and linkages of
the actions of the designed stakeholders in the subsidy
policy.
The government’s main objective is to solve a
problem, which may be developing a specific
industry or technology. The solution to this problem
requires the assistance of a firm in the relevant
industry. On the other hand, for a firm, the only
concern is profit, so in order to attract the firm to solve
the problem, the essence of the government's subsidy
policy is to create a related subsidiary for the problem
An Agent-Based Model Study on Subsidy Fraud Risk in Technological Transition
419
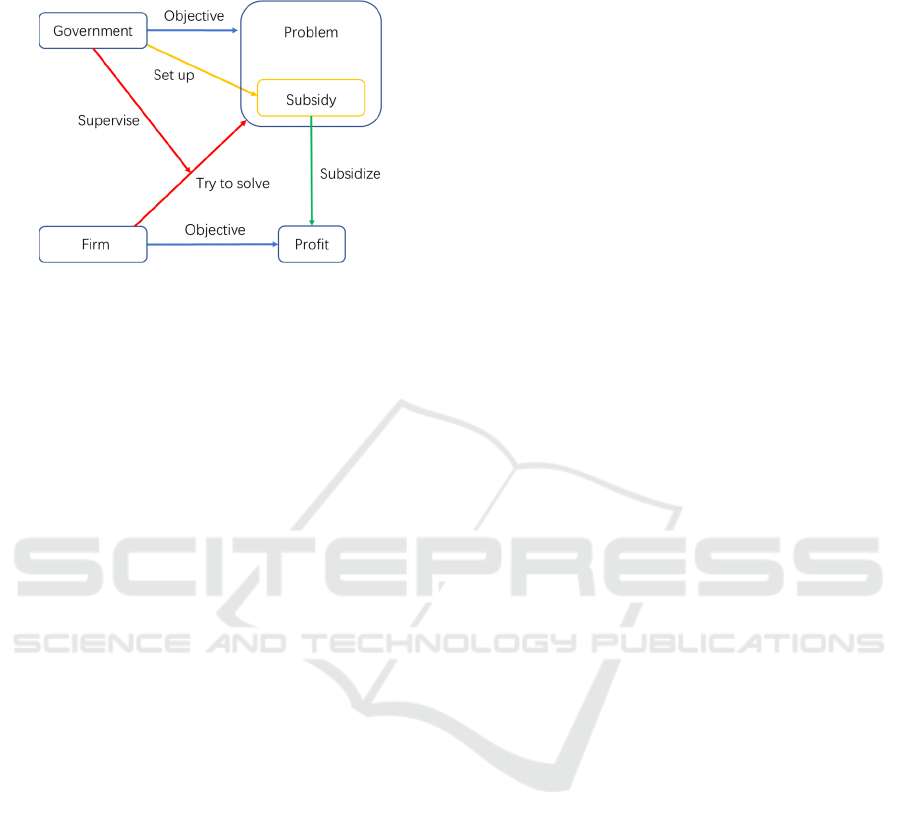
and subsidize all the firms that try to solve the
problem.
Figure 8: Principles of action and linkages of designed
stakeholders in the subsidy policy.
The two parties' actions were divergent from the
beginning. On the one hand, the company must try to
show the government that it is solving the problem in
order to get the subsidy in order to deal with
government regulation; on the other hand, the
objective of the firm has always been to get more
subsidies rather than to help the government solve the
problem, so the company side is always motivated to
cheat the policy regulation.
When subsidies are small relative to production or
R&D costs, the firm is more inclined to obtain
subsidies through formal channels than to be
punished if it is found to be a subsidy fraud. Although
the purpose of the firm attracted at this point is often
more in line with the government's aspirations, it is
relatively less attractive to the firm as a whole.
The cost of concealing government regulation can
be covered by the number of subsidies obtained when
the amount of subsidies assumed is more significant
than a particular threshold value. At this point, the
subsidy policy will be more attractive for many
companies. Moreover, when subsidies increase
further, the incentive to commit subsidy fraud will be
more than sufficient. This can lead to tragedy, as in
the case of the 2004 subsidy fraud by a Norwegian
ferry operator (J⊘ rgensen F et al., 2010) and the 2016
subsidy fraud by 20 new energy vehicle companies in
China (Wang et al., 2022).
4 CONCLUSIONS
Subsidy policy, the central policy used by
governments to support innovative industries in
modern society, is a critical factor in promoting
innovation in a country. It stimulates the diffusion and
development of new technologies by providing
tangible financial support to companies that adopt
them. However, often the objectives of firms and
governments do not precisely coincide. When
governments use subsidy policies as a stimulus, firms
that engage in fraud targeting specifically for
subsidies can also arise. As Goodhart's law says,
"When a measure becomes a target, it ceases to be a
good measure.” When companies make access to
subsidies their target, the subsidy policy is no longer
as perfect as it was designed.
Although subsidy fraud may be unavoidable, we
can still design subsidy policies to reduce the risk of
subsidy fraud. Based on such a viewpoint, this paper
attempts to present a quantitative approach to assess
the risk of subsidy policies.
In this study, firstly, we review the literature on
subsidy and subsidy fraud concepts and define these
two concepts in a clearer manner. After that, we
analyze the agent-based model designed on the basis
of MLP mathematically, from which we find the three
critical values of subsidy rates in the theoretical
model. Lastly, four different scenarios designated by
different ranges of subsidy rate, that are separated the
three critical points, are simulated numerically. From
the numerical experiments, we do find a specific
range of subsidy rates, that the size of the subsidy
should be less than 20.8% of the cost in our model,
relative to the production cost which can effectively
reduce the risk of criminal behaviours.
Also, we analysed the mechanism behind
different behaviours of the model. We identified in
the diagram showing the work of various factors (Fig.
8), the most related stakeholders in the subsidy policy.
Indeed we find that subsidy fraud is almost
unavoidable in emerging technology fields where
subsidy policies exist. In the meantime, we believe
that we can continue to explore the causes of subsidy
fraud based on the diagram in the future, which may
bring about a breaking through in the field.
REFERENCES
Lopolito, Antonio, Piergiuseppe Morone, and Richard
Taylor. An agent-based model approach to innovation
niche creation in sociotechnical transition pathways.
Economics Bulletin 31.2 (2011): 1780- 1792.
Lopolito, Antonio, Piergiuseppe Morone, and Roberta Sisto.
Innovation niches and socio-technical transition: A case
study of bio-refinery production. Futures 43.1 (2011):
27-38
Lopolito, Antonio, Piergiuseppe Morone, and Richard
Taylor. Emerging innovation niches: An agent-based
model. Research Policy 42.6-7 (2013): 1225-1238.
ICAART 2023 - 15th International Conference on Agents and Artificial Intelligence
420

Morone P, Lopolito A. Socio-technical transition pathways
and social networks: a toolkit for empirical innovation
studies[J]. Economics Bulletin, 2010, 30(4): 2720–
2731.
Victor, D., Geels, F. and Sharpe, S. Accelerating the low
carbon transition the case for more robust, more
targeted and coordinated international action. (2019).
[online] Available at: http://www.energytransitions.
org/sites/default/files/Accelerating-
TheTransitions_Report.pdf [Accessed 21 Jan. 2020]
Geels F W. Technological transitions as evolutionary
reconfiguration processes: a multi-level perspective and
a case study. Research Policy, 2002, 31(8-9): 1257–
1274.
Yang H, Wu X, Zhao S, et al. An Agent-based Model Study
on Subsidy Fraud in Technological Transition[C]//
ICAART (1). 2022: 353–358.
World Trade Organisation (1999), The results of the
Uruguay Round of Multilateral Trade Negotiations:
The Legal Texts, Geneva
Steenblik R. Subsidy measurement and classification:
developing a common framework[J]. Environmentally
harmful subsidies: policy issues and challenges, 2003:
101.
The Economics of Federal Subsidy Programs: A
Compendium of Papers[M]. US Government Printing
Office, 1972.
Fedeli S, Forte F. Models of cross-border VAT fraud[J].
2009.
Allingham M G, Sandmo A. Income tax evasion: A
theoretical analysis[J]. Journal of public economics,
1972, 1(3-4): 323–338.
Wang Z, Li X, Xue X, et al. More government subsidies,
more green innovation? The evidence from Chinese
new energy vehicle enterprises[J]. Renewable Energy,
2022, 197: 11-21.
J⊘ rgensen F, Mathisen T A. Using standardized revenue
and cost norm analyses to reveal subsidy fraud in
contracted public transport services[J]. Transport
Reviews, 2010, 30(3): 299-313.
Prichard W, Cobham A, Goodall A. The ICTD government
revenue dataset[J]. 2014.
Chica M, Hernández J M, Manrique-de-Lara-Penate C, et
al. An evolutionary game model for understanding
fraud in consumption taxes [research frontier][J]. IEEE
Computational Intelligence Magazine, 2021, 16(2): 62–
76.
Traxler C. Social norms and conditional cooperative
taxpayers[J]. European Journal of Political Economy,
2010, 26(1): 89–103.
APPENDIX
Table 1: Parameter setting.
Type Denotation Valuation Type Denotation Valuation
𝐺𝑙𝑜𝑏𝑎𝑙
𝑁𝐸 0.75
𝐺𝑙𝑜𝑏𝑎𝑙
𝑝
0.5
𝜂 0.02 𝑅𝑠𝑘
1−𝑝
𝜋 0.001 𝐶𝑒𝑥
0.5
𝑛 0.01
𝑐 0.01
𝜃 0.025
𝐹𝑖𝑟𝑚 𝑖
𝑒𝑥
,
0.5
𝜐 2 𝐼
[0, 0.3]
𝑆𝑢𝑏𝑠𝑖𝑑𝑦 0 𝐾
,
[0, 0.01]
𝑅
1.5 𝐶𝑛
,
0.5
An Agent-Based Model Study on Subsidy Fraud Risk in Technological Transition
421
