
Quantitative Performance Analysis from Discrete Perspective: A
Case Study of Chip Detection in Turning Process
Sharmin Sultana Sheuly
1
, Mobyen Uddin Ahmed
2
and Shahina Begum
3
School of Innovation, Design and Engineering, Mälardalen University, 722 20 Västerås, Sweden
Keywords: Machine Learning, Manufacturing System, Quantification, Performance Analysis.
Abstract: Good performance of the Machine Learning (ML) model is an important requirement associated with ML-
integrated manufacturing. An increase in performance improvement methods such as hyperparameter tuning,
data size increment, feature extraction, and architecture change leads to random attempts while improving
performance. This can result in unnecessary consumption of time and performance improvement solely
depending on luck. In the proposed study, a quantitative performance analysis on the case study of chip
detection is performed from six perspectives: hyperparameter change, feature extraction method, data size
increment, and concatenated Artificial Neural Network (ANN) architecture. The focus of the analysis is to
create a consolidated knowledge of factors affecting ML model performance in turning process quality
prediction. Metal peels such as chips are designed at the time of metal cutting (turning process) and the shape
of these chips indicates the quality of the turning process. The result of the proposed study shows that
following a fixed recipe does not always improve performance. In the case of performance improvement, data
quality plays the main role. Additionally, the choice of an ML algorithm and hyperparameter tuning plays an
essential role in performance.
1 INTRODUCTION
The concept of ”zero human intervention” stepped
into the scene with the rise of Artificial intelligence
(AI). AI is the science of intelligent machine
development (Watson, 2005) (McCarthy, 2007).
Machine Learning(ML) is a black-box AI technology
which learns an unknown function based on provided
data (Zhang, 2020). Sensor technologies have
advanced in an unprecedented manner. These new
sensors can produce large amounts of data which
paves the way for ML applications in the
manufacturing domain (Kusiak, 2018), (Tiwari,
2021) . Distributed and autonomous manufacturing
has laid a new milestone (Wang, 2015), (Zhuang,
2007). Data in the manufacturing domain are stored
for a short period for maintenance purposes and have
a chaotic structure (Wuest, 2016).
These data can foster automation in the
manufacturing domain with the application of ML for
managing uncertainties (Zhang, 2020), tool condition
1
https://orcid.org/0000-0003-0883-0044
2
https://orcid.org/0000-0003-1953-6086
3
https://orcid.org/0000-0002-1212-7637
monitoring (Alfaro-Cortes, 2020), process modelling,
adaptive control (Monostori, 2003), quality
prediction (CHO, 2020) etc. Cloud and IoT-based
devices are used for deploying models for scheduling
(Jian, 2021), self-organised task scheduling (Chen,
2018), and manufacturing collaboration (Tao, 2019).
Supervised and unsupervised learning are the two
main contributors to manufacturing from an ML
perspective (Dogan, 2021) (Bricher, 2020). The
widely used algorithms are the Support vector
machine (SVM) (Liao, 2019), Artificial Neural
Network (ANN) (Casalino, 2016), Decision Trees
(DT) (Ronowicz, 2015), and k Nearest Neighbors
(kNN) (Kong, 2016).
In the period 2015-2020, research publications
were mainly focused on the application of ML in the
manufacturing domain (Sheuly, 2021), (Hamidur,
2023). However, after 2020 only an application of ML
to a certain domain is no more considered a significant
contribution to the state of the art (Doulgkeroglou,
2020), (Syafrudin, 2018), (Romero, 2019).
368
Sheuly, S., Ahmed, M. and Begum, S.
Quantitative Performance Analysis from Discrete Perspective: A Case Study of Chip Detection in Turning Process.
DOI: 10.5220/0011800100003393
In Proceedings of the 15th International Conference on Agents and Artificial Intelligence (ICAART 2023) - Volume 2, pages 368-379
ISBN: 978-989-758-623-1; ISSN: 2184-433X
Copyright
c
2023 by SCITEPRESS – Science and Technology Publications, Lda. Under CC license (CC BY-NC-ND 4.0)
Additionally, according to (Chui, 2017), 64% of total
work spent in the manufacturing domain can be
automated with the latest technology instead of human
resource and it could save 478 billion working hours.
ML with significant performance can reduce
economic loss and required time in manufacturing
(Zhao, 2020), (Uzkent, 2019), (Brisk, 2019). As a
result of this new requirement for improved
performance, the application of ML with changed ML
architecture, versatile data source, and edge device
found its way into the manufacturing domain.
However, good performance is a prerequisite in the
case of ML applications in the manufacturing domain
(Sharmin 2021). No research study quantifies the
change in performance with perspective variation such
as a change in ML architecture, the inclusion of
versatile data sources, and hyperparameter tuning.
This can give rise to a random search for performance
improvement methods which is a time-consuming and
unrealistic method.
In the proposed study, a case study combining
cutting-edge technologies such as ML, embedded
systems and cloud technology of chip detection is
presented where a change in performance is quantified
with perspective variation such as hyperparameter
change, the inclusion of feature extractor and new data
source, change in ML model architecture.
The proposed study contributes to the state-of-the-
art works by creating hyperparameter-tuned models,
followed by performance comparison from a different
perspective and a complete hardware setup. The
proposed work will create an efficient path of
performance improvement for the future researcher.
Most turning process prediction systems predict
surface roughness (Singh, 2007), cutting parameters
(Jurkovic, 2018), and tool life (Laghari, 2019). To our
knowledge, no other study implements a turning
process prediction system for machine health
monitoring with ML, embedded systems and cloud
technology followed by an analysis of different
perspectives. A local manufacturing company
1
manufactures cutting tools that cut metal into a
predefined shape. One of the cutting processes is
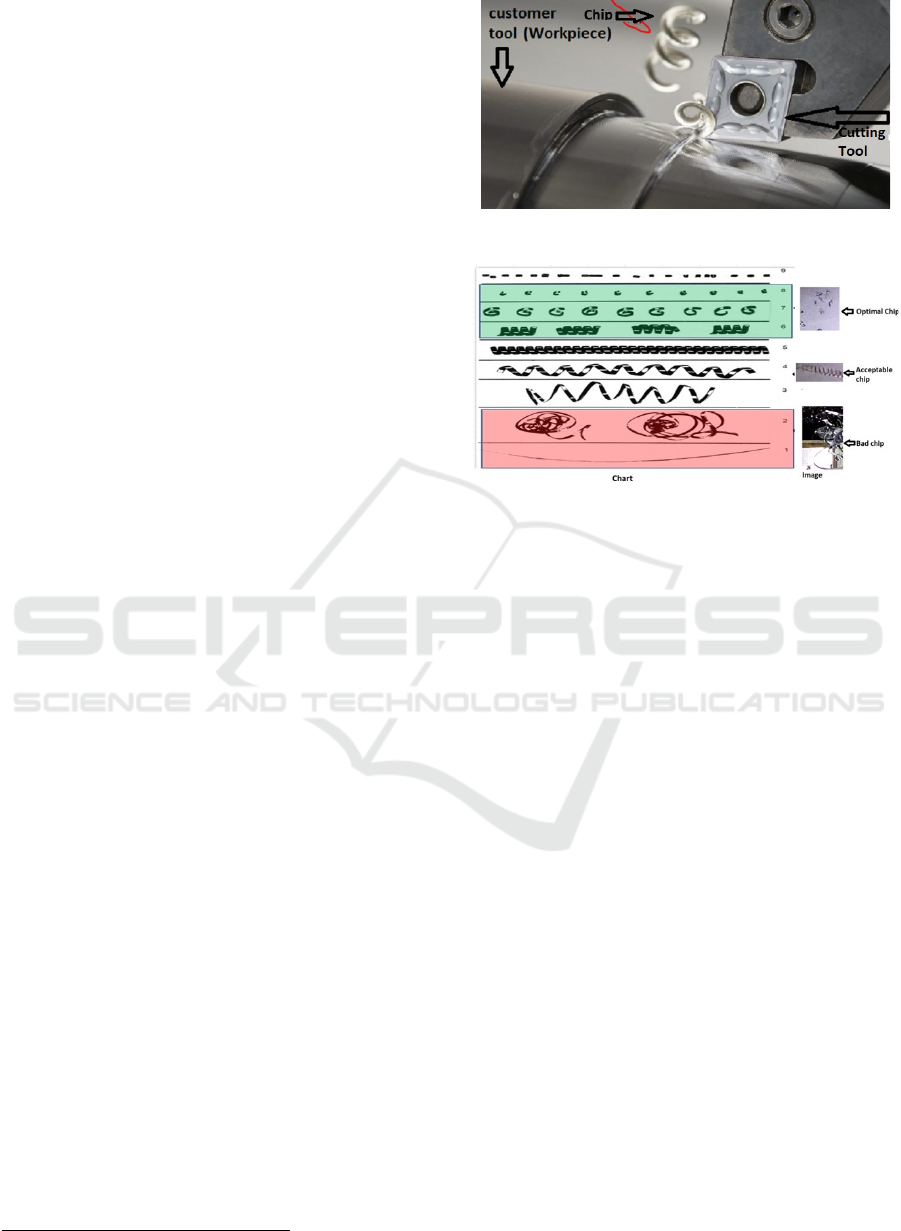
turning (kim, 2018). In the turning process, the
workpiece moves, and the cutting tool remains
stationary while cutting the metal. The by-product of
the turning process is metal chips and technicians
examine these chips to understand whether the turning
process is in a good condition. Figure 1 shows the
turning process using a cutting tool and Figure 2
shows chip classes:(a)acceptable chip (b)optimal chip
(c)bad chip.
1
https://www.secotools.com/
Figure 1: Turning Process with a cutting tool.
Figure 2: Chip classes depending on size.
In this proposed study, the final ML model runs
on Raspberry Pi replacing the human technician by
predicting the chip class based on the chip image and
machine parameters. In addition, the images were
saved on the Azure cloud platform. The rest of the
paper is structured as follows: Section 2 presents an
overview of the approach, section 3 presents the
implementation method, section 4 shows the results
and finally section 5 concludes the study with a
discussion.
2 OVERVIEWS OF APPROACH
This research study started with the offline process by
gathering domain knowledge, data, requirements, and
ideas provided by the local manufacturing company
(Figure 3). The formulated problem was to automate
the turning process using ML models and
quantification of change in performance because of
the changed perspective. The state of the art in the
manufacturing domain was reviewed to find
concurrent ML algorithms appropriate for the
formulated problem. ML algorithms such as ANN,
Convolutional Neural Network (CNN), SVM, kNN
and RF were selected. There are two types of data: the
image of chips and numerical machine parameters.
Quantitative Performance Analysis from Discrete Perspective: A Case Study of Chip Detection in Turning Process
369
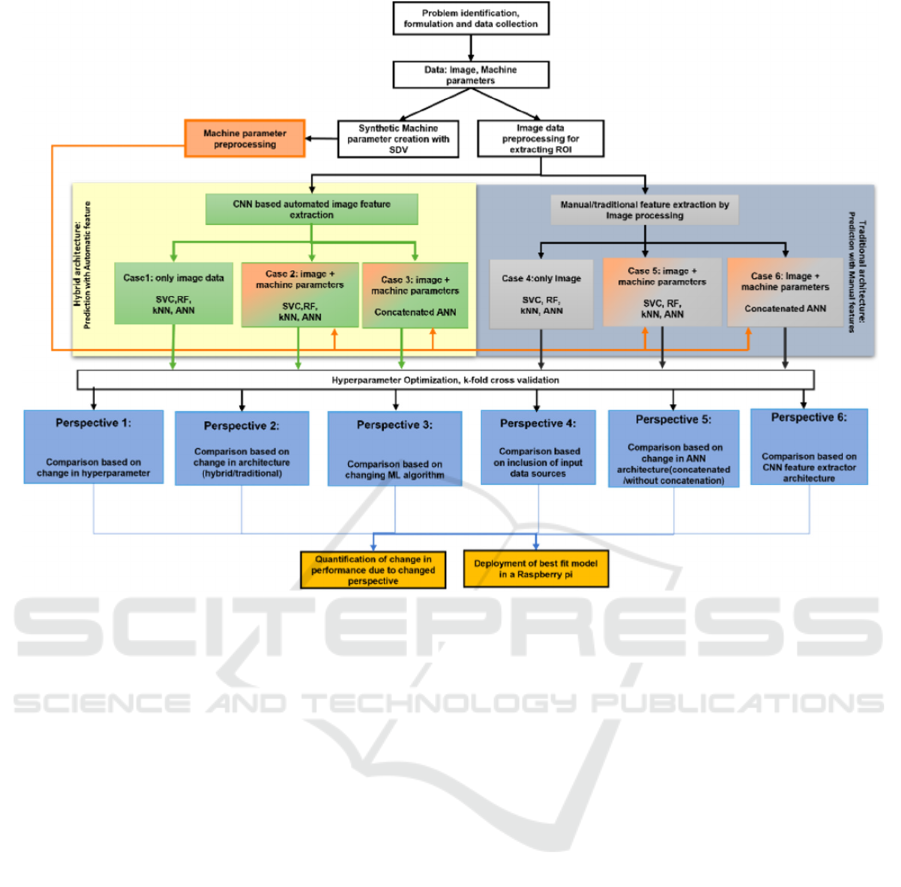
Figure 3: Step-by-step offline process.
On image data several pre-processing steps such
as Gaussian blur filter, foreground mask, and Canny
edge filter were performed to convert the images to
an appropriate form. For the numeric machine
parameters cardinality, missing values were checked.
After pre-processing, classification models were
trained on the processed data. Two sets of models
were created: one set with automatic features such as
features extracted with help of CNN which are named
‘hybrid architecture’. Conversely, another set of
models was created with manually extracted features
which are named ‘traditional architecture’.
Both hybrid and traditional architecture have
varying inputs. Certain models were created with
only image data as input such as Case 1 and Case 4
(coloured in green) while certain models were created
with both image and machine parameters as input
such as Case 2, Case 3, Case 5, Case 6 (coloured in
green and orange). Two types of models were created
for ANN: one set with concatenated architecture
(Case 3 and Case 6) and the other set without
concatenation (Case 2 and Case 5 ). In the case of
concatenated architecture, two ANN models, one
considering machine parameters as input (Model 1)
and one considering the image as input (Model 2)
were concatenated at the final layer. Conversely, in
the case of a model without concatenation machine
parameters were combined with the image and the
combined data was used as input to the ANN model.
All the models were created with hyperparameter
optimization. SVC, RF, and kNN were created with
5-fold cross-validation while ANN (both
concatenated and without concatenation) were
created with train, validation, and test split (80%,
10% and 10%). In the following stage, the created
eighteen ML models were evaluated to quantify the
change in performance with change in perspective.
The considered perspectives are
1) Change in hyperparameter.
2) Change in architecture (Hybrid/traditional
feature extraction).
3) Change in ML algorithm (ANN, SVC, RF or
kNN).
4) Inclusion of new data sources such as machine
parameters.
5) Change in ANN architecture (Concatenated or
without concatenation).
6) Change in CNN feature extractor architecture
(shallow layer or deep layer).
The ML model with the best performance was
deployed in raspberry pi. In case of bad chips, the
raspberry Pi switched the red LED on and signalling
the technician.
ICAART 2023 - 15th International Conference on Agents and Artificial Intelligence
370
3 IMPLEMENTATIONS
3.1 Data Collection and Pre-Processing
There was no image-capturing system at the local
manufacturing company. To capture images during
the turning process a GoPro Hero 9 camera was
installed on top of the workpiece. An additional light
source was used in the setup. In total, 42 videos were
captured with the highest speed, feed, and chip
breaker (a tool that breaks the chips). A total of 20023
images were extracted from the videos for training. In
addition, 6429 images were extracted for testing.
In the case of machine parameters, 2105 data
instances were provided by the manufacturing
company. Synthetic Data Vault (SDV) (Watson,
2005) is a set of libraries that were used to generate
synthetic data of the same format and statistical
properties. The SDV was used to create a hierarchical
statistical model of the machine parameters. This
fitted model was subsequently used to generate
additional data instances. A total of 20023 data
instances of machine parameters were created to align
with 20023 image data.
The primary goal of pre-processing is to improve
image quality by suppressing irrelevant information
and enhancing important features for ML
classification. However, this step adds additional time
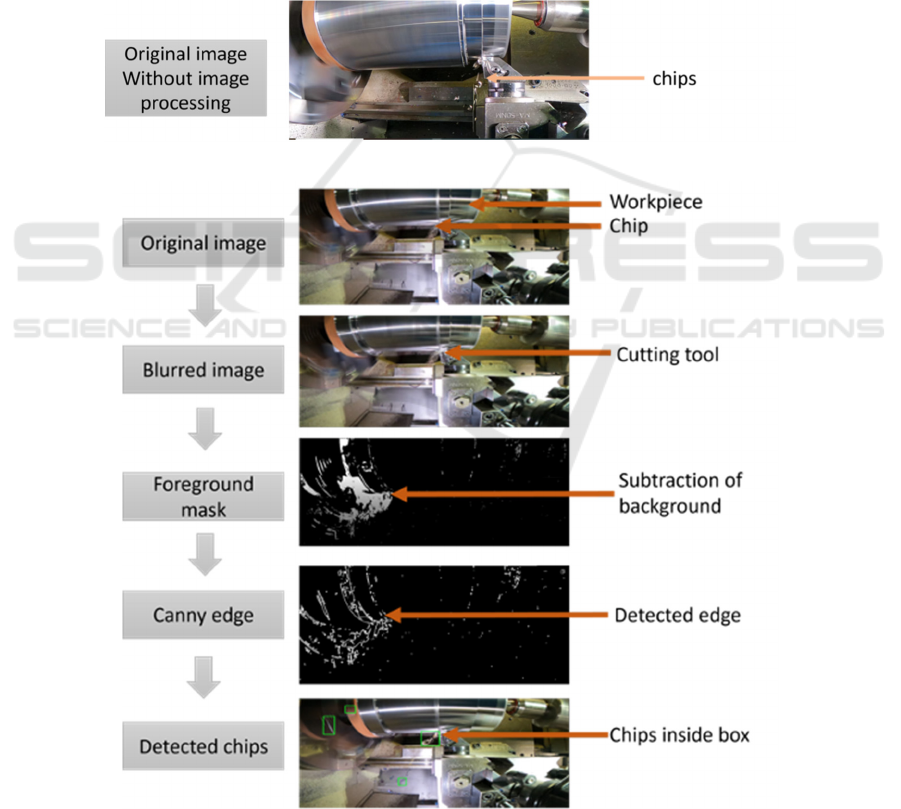
to the classification. Figure 4b shows pre-processing
a) Undetected chips because of an absence of image processing
b) Detected chips because of image processing
Figure 4: Comparison of the image in the presence and absence of image processing techniques.
Quantitative Performance Analysis from Discrete Perspective: A Case Study of Chip Detection in Turning Process
371
steps performed on the images while Figure 4a shows
an image without pre-processing. It is visible that
without pre-processing chip detection is not
possible. In this work, the images were at first
smoothed with help of a Gaussian filter (Figure 4b).
Gaussian filter reduces the details of an image by
replacing pixel values with a value closer to the
nearby pixel value. This smoothing helps detect
edges. In the later stage, a foreground mask was
applied to the blurred image. The white area in the
figure represents the moving objects (rotating
workpieces and chips) and the black area is the
stationary background. The stationary background is
removed from the image to enhance only the
moving chips. To detect the edges of an object, the
canny edge detection technique is used. In the
proposed work, canny edge detection is used to
separate chips from other moving parts. Changes in
pixel, intensity are used to define the boundary. A fast
change in pixel intensity is regarded as an edge. In the
last stage, the green bounding box is showing the
potential chips. In the case of numerical data, the
missing values were first located and populated with
the median value. In the later stage, the cardinality
of the variables was checked, one of the variables
had cardinality 1 (all the values were the same), and
it was removed from the dataset because it does not
contribute any information. To identify outliers
minimum and maximum values of each variable were
investigated. Outliers are absent in the dataset. The
variables were scaled to the range [0,1] resulting in
similar effects from all data instances.
3.2 Feature Extraction with CNN
CNN was used for feature extraction. Two CNN
models were trained on the image data and the final
layer output of CNN is used as the input feature. The
first model has seven layers while the second model
was created with two layers. The performance of
these two models was compared considering
accuracy.
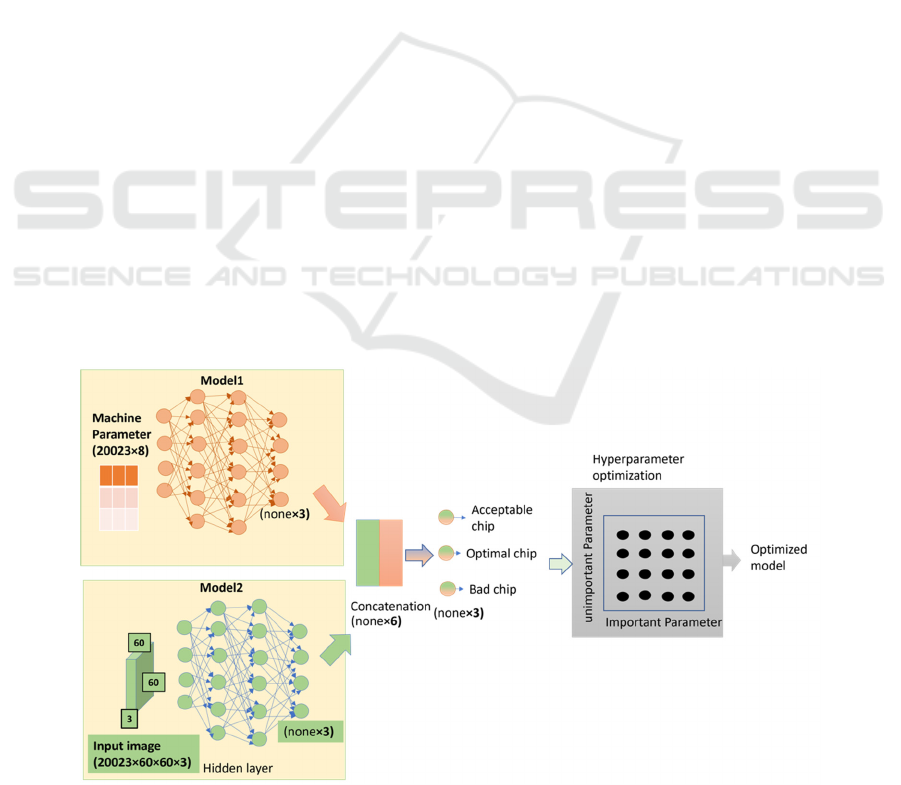
3.3 Classification Model Building and
Concatenation
Several classification models were created to classify
the chip images and machine parameters into three
classes: (a) acceptable chip (b) optimal chip (c) bad
chip (Figure 2).
The hyperparameter of the SVC was tuned with
the help of the scikit-learn function ‘GridSearchCV’
through an exhaustive search over specified
hyperparameter space. A 5-fold cross-validation was
used. A linear kernel along with ‘C’ value 1000
stopped the grid search process, for this reason, the
linear kernel was removed from the candidate
hyperparameter list. The grid search process for the
SVC model hyperparameter took 48 hours. The final
optimized hyperparameter values are provided in
Table 1. Hyperparameters of the kNN and RF model
were tuned with help of ‘GridSearchCV’ with 5-fold
cross-validation. The grid search process for the kNN
model hyperparameter took 5 minutes. The final
optimized hyperparameter values are provided in
Table 1.
Figure 5: Concatenated model construction.
ICAART 2023 - 15th International Conference on Agents and Artificial Intelligence
372
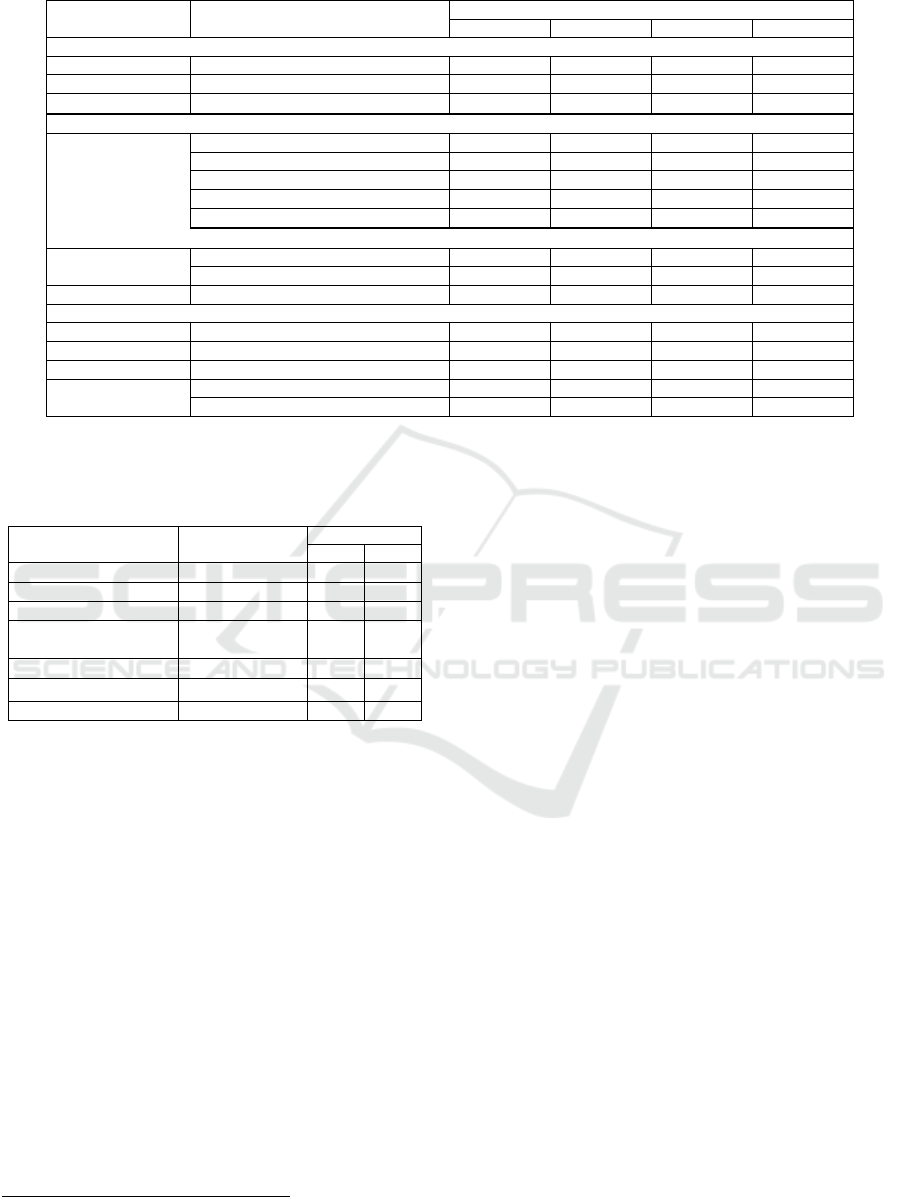
Table 1: Optimized hyperparameter values of the ML models.
Hyperparameter Candidate value
Optimized value
Case 1 Case 2 Case
4
Case 5
SVC
C
0.1, 1, 10, 100, 1000 1000 1000 0.1
1
gamma 1, 0.1, 0.01, 0.001, 0.0001
11
0.0001 0.001
kernel ’rbf’ ’rbf’ ’rbf’ ’rbf’ ’rbf’
Random Forest
max depth 10, 20, 30 30 30 30 30
max features ’auto’, ’sqrt’ ’sqrt’ ’auto’ ’auto’ ’sqrt’
min samples leaf 1, 2
1 1 1 1
min samples spli
t
2, 5
2 2 2 2
n estimators 800, 1000 1000 1000 800 1000
k Nearest Neighbour
n neighbors 5,7,9,11,13,15
5
11
5 5
Weights ’uniform’,’distance’ ’distance’ ’distance’ ’distance’ ’distance’
Metric ’minkowski’,’euclidean’,’manhattan’ ’manhattan’ ’manhattan’ ’manhattan’ ’manhattan’
ANN
Learning rate 1,0.1,0.01,0.001 0.1 0.1 0.1 0.1
Activation ’relu’, ’elu’ ’relu’ ’relu’ ’relu’ ’relu’
Neurons 10, 20, 30, 40, 80 40 40 40 30
b
atch siz
e
16, 32, 64, 128 64 64 64 16
Optimize
r
‘Nadam’,’Adam’ ‘Nadam’ ‘Nadam’ ‘Nadam’ ‘Nadam’
Table 2: Optimized Hyperparameter values of the concrete-
naked model.
Hyperparameter Candidate value
Optimized value
Case 3 Case
6
Activation ’relu’, ’elu’ ’relu’ ’relu’
Batch siz
e
16,32,64,128 64 64
model1 neuron numbe
r
10,20, 30, 40,100 10 10
learning rate
0.01,0.1,0.001,
0.00001
0.1 0.1
dropou
t
0, 0.1, 0.2
0 0
Optimize
r
’Adam’,’Nadam’ ’Nadam’’Nadam’
model2 neuron numbe
r
20,30,100, 300 30 30
In the concatenated model, three dense layers were
used which is followed by a flattened layer and finally
the output layer (Figure 5). At the time of training, the
model ‘Categorical Crossentropy’ was used as the
loss. After building both ANN models’, the outputs
were concatenated (Figure 5). The models’
hyperparameters were optimized with Talos
21
. The
output is the probability of a specific class. The final
optimized hyperparameter values are provided in
Table 2.
3.4 Deployment in Raspberry Pi
The model with significant performance was
deployed in Raspberry Pi. The Raspberry Pi 4 Model
B with 8GB of RAM was used in the proposed study.
The Raspberry Pi can send the results of the ML
model and extracted images to the Azure cloud.
2
Autonomio Talos [Computer software]
4 RESULTS
4.1 Perspective 1: Change in
Hyperparameter
In this perspective, change in performance with
hyperparameters is focused. Table 1 shows the
candidate and optimized hyperparameters while
Figure 6 shows the change in hyperparameters with
cases (hyperparameters that remained constant are
not included in the figure).
The C value in SVC is the term used to control
misclassification for hybrid architecture (Case 1 and
Case 2), C in SVC has a value of 1000 while for
traditional architecture (Case 5 and Case 6), the value
is 1. The hybrid architecture has higher accuracy on
test data with a higher C value. The penalty for
misclassification is higher in the case of hybrid
architecture which implies hybrid architecture
considers the outliers in the case of classification.
Conversely, in traditional architecture outliers are not
considered. However, the test accuracy increased
with the inclusion of outliers (Figure 6).
The data distributions of pixel values explain this
result (Figure 7). The figure shows, for an acceptable
and optimal chip the pixel values follow a normal
distribution, and most data points fall within the
distribution curve. However, for bad chips, pixel
values do not ideally follow any distribution. The
closest data distribution is the ‘rayleigh’ distribution.
Quantitative Performance Analysis from Discrete Perspective: A Case Study of Chip Detection in Turning Process
373
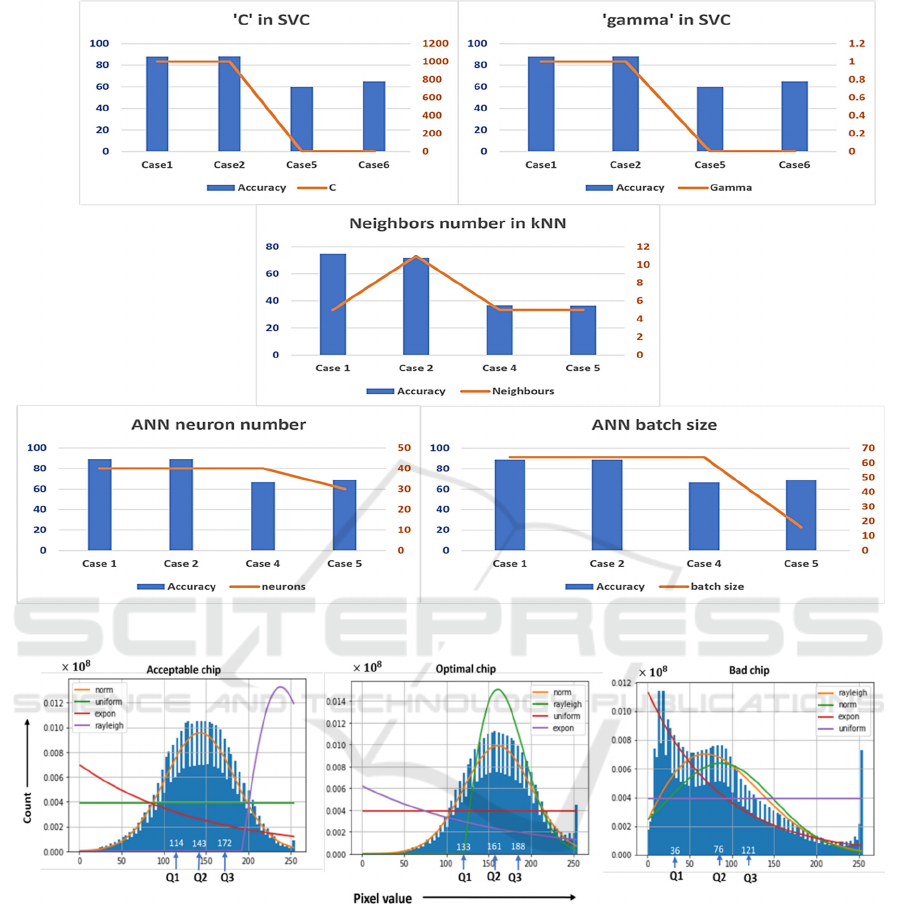
Figure 6: Change in performance with hyperparameter.
Figure 7: Data distribution of image pixels.
However, most data point shows random
frequency. Considering outliers while creating the
model showed success because of this distribution.
4.2 Perspective 2: Change in
Architecture
In this perspective, two types of architecture such as
hybrid (Case 1, Case 2, Case 3) and traditional (Case
4, Case 5, Case 6) architecture were considered
(Figure 8). Hybrid architecture comprised of CNN
features extractor and ML model while traditional
architecture comprised of manual feature extractor
and ML model. The accuracy increased by 20%
because of hybrid architecture.
4.3 Perspective 3: Change in ML
Algorithm
Certain ML algorithms such as SVC, RF, kNN, and
ANN were used to find the best model. ANN
outperformed all the other models. The accuracy
increased by a factor of 15% because of the changed
ML algorithm (ANN:90% and kNN:75%).
ICAART 2023 - 15th International Conference on Agents and Artificial Intelligence
374
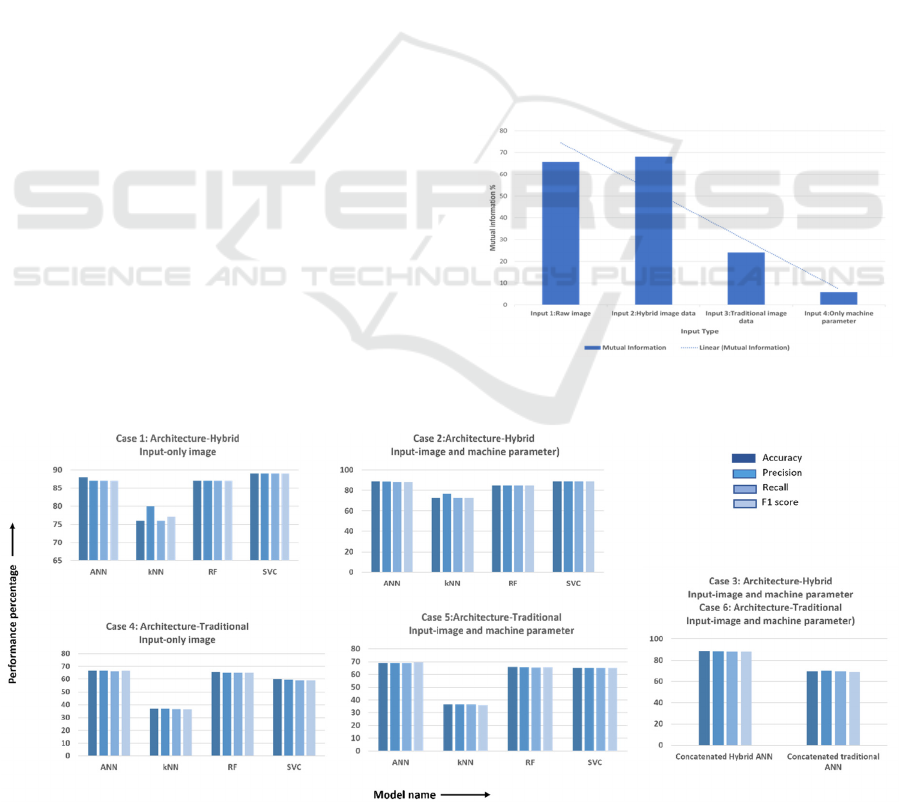
4.4 Perspective 4: Inclusion of New
Data Source
In this perspective, a new data set i.e., machine
parameters were used as input in addition to image
data resulting in two sets of cases ((a)Only image set,
(b)Image and machine parameter set). Only the image
set includes Case 1 and Case 4 while the image and
machine parameter set includes Case 2, Case 3, Case
5, and Case 6 (Figure 8).
Both the image and machine parameter set (Case
2) and only the image set (Case 1) have 90%
accuracy. This implies the inclusion of a new data
source does not increase the accuracy.
4.5 Perspective 5: Change in ANN
Architecture
In this perspective, concatenated ANN architecture
(Case 3 and Case 6) was compared with ANN without
concatenation (Case 2 and Case 5). A concatenated
ANN architecture was created to test if the changed
architecture can improve accuracy in addition to the
inclusion of a new data source (perspective 2). In
hybrid architecture, accuracy decreased by a factor of
2% with the introduction of concatenated architecture
(Case 2 and Case 3) while in traditional architecture,
the introduction of concatenated architecture did not
affect accuracy (Case 5 and Case 6).
Conversely, the inclusion of feature extractors
such as hybrid or traditional architecture (Perspective
2: Change in architecture) changed performance
significantly which indicates feature extraction can
lead to the loss of significant information. To quantify
the change in information aspect with change in
input such as the inclusion of feature extractor and
machine parameter data normalized mutual
information was calculated.
Normalized mutual information considers
Shanon’s entropy for the quantification of change in
the information aspect of one variable with the
observation of another variable. In the proposed
study, the added information to the true response
because of the predictions from the ML models is
quantified (Figure 9). As shown in the figure, 4 sets
of input are considered:
• Input 1: Raw (no feature extraction) image data
• Input 2: Hybrid (feature extraction with CNN)
image data
• Input 3: Traditional (manual feature extraction)
image data
• Input 4: Only Machine parameter
The information bits added by the raw image is
65% while feature extractions from the raw image with
CNN increased the information aspect by only 3%.
Manual feature extraction decreased the information
aspect by 40%. Conversely, for only machine
parameters, mutual information is only 5%. This
Figure 9: Mutual information associated with a different set
of data.
Figure 8: Change in performance with change in perspective.
Quantitative Performance Analysis from Discrete Perspective: A Case Study of Chip Detection in Turning Process
375
explains unchanged accuracy with the addition of
machine parameters (Perspective 4).
4.6 Perspective 6: Change in CNN
Feature Extractor Architecture
Several research studies state deep layers such as 14
layers (Rahman, 2021), and 50 layers (Qadir, 2019)
of CNN for feature extraction. However, in the
proposed study it is observed that with an increment
of the CNN feature extractor layer the accuracy
dropped in a proportional way.
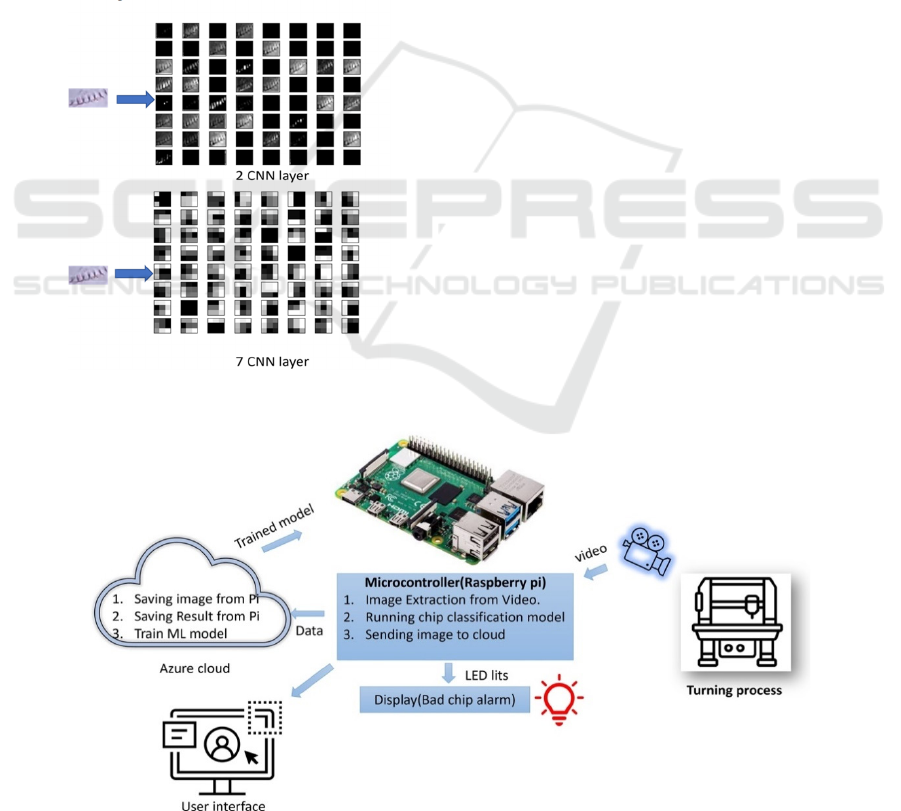
To find the reason for degraded performance the
extracted features are plotted as an image for 2-layer
CNN and 7-layer CNN, (Figure 10). It is shown in the
figure that with an increase in the feature extractor
layer the images become abstract and it loses
information significant for classification.
Figure 10: Chip image feature extraction with 2-layer and
7-layer CNN.
4.7 Significance Test
Wilcoxon signed-rank test is a non-parametric test
used for the hypothesis test. In the proposed study, all
the data do not follow the Gaussian distribution
(Figure 7). For this reason, parametric test such as
ANOVA was not used.
Wilcoxon signed-rank test was performed to test
the null hypothesis ”The difference in true response
and ML predicted response is equal to 0” The p-value
for hybrid ANN (Case 2) is 0.664 while the p-value
for traditional ANN (Case 5) is 0.443. Therefore, the
null hypothesis cannot be rejected because the p-
value is greater than the significance level alpha =
0.05. Additionally, hybrid ANN (Case 2) has a higher
p-value compared to traditional ANN (Case 5) which
implies hybrid ANN (Case 2) is more related to true
response.
4.8 Hardware Setup Result
The complete hardware setup deployed in the
manufacturing company workshop is shown in Figure
11. The microcontroller extracts frames from the
video and sends them to the Azure cloud. To send
8603 frames to the azure cloud through an internet of
speed 9 MB/s the microcontroller takes 8 seconds.
5 DISCUSSION AND
CONCLUSION
The manufacturing industry is stepping into the era of
industry 4.0 with the advancement of technology. A
manufacturing system comprises numerous parts and
Figure 11: Complete setup in the manufacturing workshop.
ICAART 2023 - 15th International Conference on Agents and Artificial Intelligence
376

malfunction of any of these parts can lead to faulty
functionality. ML-integrated manufacturing can
solve this problem by reducing economic loss.
However, good ML performance is a prerequisite.
In the proposed study, chip images and machine
parameters are used as input to several ML models for
the prediction of the chip class and a quantified
performance analysis from six discrete perspectives
was performed.
One of the findings of the proposed study is that
SVC, kNN and ANN are the top three ML models
which are affected by hyperparameters significantly.
The C value of the SVC classifier is an indication of
data distribution. A significant C value indicates the
presence of an outlier. Additionally, accuracy can be
increased by a factor of 30% with hyperparameter
tuning.
However, ML performance improvement can be a
paradox. In the proposed study, the initial target was
to achieve an accuracy above 90%. For this reason,
hyperparameters were tuned increasing accuracy by
30%. For further improvement, automatic feature
extraction with CNN instead of traditional feature
extraction was implemented which increased the
accuracy by a factor of 20%.
Several state-of-the-art ML models such as SVC,
kNN, RF and ANN are trained to find the best-
performing model. Changing the ML model increased
the performance by a factor of 15%. The best-
performing model is ANN.
The findings of the proposed analysis show that
an increment of data which does not contribute any
information will not increase performance. The pitfall
of data is the widely accepted belief ”more data
means better performance”. However, more data does
not always lead to better performance. An added data
source only increases performance if the posterior
probability of the response variable changes
significantly with the inclusion of a new data source.
Additionally, the concatenation two ANN model will
contribute to better performance only if the input data
quality is better. Therefore, data plays a significant
role compared to model architecture.
A significant number of scientific publications
show performance increment with the extraction of
features such as edge, and colour. However, the
analysis based on perspectives 5 and 6 shows feature
extraction does not always contribute to model
performance increment. In certain cases, feature
extraction can suppress information significant for
classification. For this reason, raw pixel values have
a similar performance as the CNN extracted features.
It can be concluded that an industrial case study
can have a distinct characteristic which can lead to the
failure of popular performance improvement
methods. In the proposed study, the detected objects
(chips) can be a few millimetres resulting decrease in
accuracy with feature extraction compared to raw
pixel values. Additionally, it can be concluded that
data quality plays the main role in performance
improvement compared to hyperparameter tuning,
model architecture changing, feature extraction
method, size of data, and algorithm selection. The ML
model predictions are not produced by chance
(according to Wilcoxon signed-rank test).
The limitation of the proposed study is the latency
introduced due to image processing leading to limited
application for real-time object detection. The
findings of the proposed study apply to the specific
case study and case studies with similar types of data.
In future, the same analysis can be performed on
benchmark data sets to draw a more generalized
conclusion.
ACKNOWLEDGEMENTS
The study was conducted through the DIGICOGS
project which is financed by Vinnova (Vinnovas
Diarienr: 2019-0532) and the innovation program
Process Industrial IT and Automation (PiiA) at
Mälardalen University. Thanks to Amir Karim,
Vyacheslav Kryzhanivskyy, Abhishek Ranjan, Nick
Grannas, Robin Andersson Dickfors and Go¨zde
Akpak for their initial work in DIGICOGS project.
REFERENCES
Watson D. P., Scheidt D. H., (2005), Autonomous systems,
Johns Hopkins APL technical digest 26 (4) 368–376.
McCarthy J., ? (2007). What is artificial intelligence
Zhang X.-D., (2020), Machine learning, in A Matrix
Algebra Approach to Artificial Intelligence, Springer,
2020, pp. 223–440.
Wang L., Torngren M., Onori M., (2015), Current status
and advancement of cyber-physical systems in
manufacturing, Journal of Manufacturing Systems 37
517–527.
Zhuang L., Goh K. M., Zhang J.-B., (2007), The wireless
sensor networks for factory automation: Issues and
challenges, in 2007 IEEE Conference on Emerging
Technologies and Factory Automation (EFTA 2007),
IEEE, , pp. 141–148.
Wuest T., Weimer D., Irgens C., Thoben K.-D., (2016),
Machine learning in manufacturing: advantages,
challenges, and applications, Production &
Manufacturing Research 4 (1) 23–45.
Kusiak A., (2018), Smart manufacturing, International
Journal of Production Research 56 (1-2) 508–517.
Quantitative Performance Analysis from Discrete Perspective: A Case Study of Chip Detection in Turning Process
377

Monostori L., (2003), AI and machine learning techniques
for managing complexity, changes and uncertainties in
manufacturing, Engineering applications of artificial
intelligence 16 (4) 277–291.
Alfaro-Cortes E., Alfaro-Navarro J.-L., Gamez M., Garcıa
N., (2020), Using random forest to interpret out-of-
control signals, Acta Polytech. Hung. 17 (6) 115–130.
Zhang X., Kano M., Tani M., Mori J., Harada J. Ise, K.,
(2020), Prediction and causal analysis of defects in steel
products: Handling nonnegative and highly
overdispersed count data, Control Engineering Practice
95, 104258.
Cho E., Jun J.-H., Chang T.-W., Choi Y., (2020), Quality
prediction modelling of plastic extrusion process, ICIC
express letters. Part B, Applications: an international
journal of research and surveys 11 (5) ,447–452.
Dogan A., Birant D., (2021) Machine learning and data
mining in manufacturing, Expert Systems with
Applications 166 ,114060.
Tiwari R. Rai, M. K., Ivanov D., Dolgui A., (2021). Machine
learning in manufacturing and industry 4.0 applications
Jian C., Ping J., Zhang M., (2021), A cloud edge-based two-
level hybrid scheduling learning model in cloud
manufacturing, International Journal of Production
Research 59 (16) 4836–4850.
Chen B., Wan J., Celesti A., Abbas D. Li, H., Zhang Q.,
(2018), Edge computing in iot-based manufacturing,
IEEE Communications Magazine 56 (9) ,103–109.
Tao Q. Qi, F., (2019), A smart manufacturing service
system based on edge computing, fog computing, and
cloud computing, IEEE Access 7, 86769–86777.
Liao J. Lu, X., Ouyang S. Li, H., Chen K., Huang B.,
(2019), An effective ABC-SVM approach for surface
roughness prediction in manufacturing processes,
Complexity 2019
Casalino G., Facchini F., Mortello M., Mummolo G.,
(2016), Ann modelling to optimize manufacturing
processes: The case of laser welding, IFAC-
PapersOnLine 49 (12), 378–383.
Ronowicz J., Thommes M., Kleinebudde P., Krysinski J.,
(2015), A data mining approach to optimize pellets
manufacturing process based on a decision tree
algorithm, European Journal of Pharmaceutical
Sciences 73, 44–48.
Kong N. Li, H., Gong Y. Ma, G., Huai W., (2016), Human
performance modelling for manufacturing based on an
improved KNN algorithm, The International Journal of
Advanced Manufacturing Technology 84 (1-4) 473–483.
Doulgkeroglou M.-N., Nubila A. Di, Niessing B., Konig N.,
Schmitt R. H., Damen J., Szilvassy S. J., Chang W.,
Csontos L., Louis S., et al., (2020), Automation,
monitoring, and standardization of cell product
manufacturing, Frontiers in Bioengineering and
Biotechnology 8, 811.
Syafrudin M., Alfian G., Fitriyani N. L., Rhee J., (2018),
Performance analysis of iot-based sensor, big data
processing, and machine learning model for real-time
monitoring system in automotive manufacturing,
Sensors 18 (9), 2946.
Romero D., Gaiardelli P., Powell D., Wuest T., Thurer M.,
(2019), Rethinking jidoka systems under automation &
learning perspectives in the digital lean manufacturing
world, IFAC-PapersOnLine 52 (13) , 899–903
Chui M., George K., Manyika J., Miremadi M., (2017),
Human+ machine: A new era of automation in
manufacturing, McKinsey & Company 13.
Bricher D., Muller A., (2020), A supervised machine
learning approach for in- telligent process automation
in container logistics, Journal of Computing and
Information Science in Engineering 20 (3)
Singh, D. and Venkateswara R. P, (2007), A surface
roughness prediction model for hard turning process,
The International Journal of Advanced Manufacturing
Technology, 1115–1124.
Jurkovic, Z., Cukor G., Brezocnik M., and Brajkovic T,
(2018), A comparison of machine learning methods for
cutting parameters prediction in high speed turning
process, Journal of Intelligent Manufacturing, 1683–
1693.
Laghari, R. A., Li, J., Laghari, A. A., Mia, M., Wang, S. A.,
Wang P. KK, (2019) , Carbide tool life prediction and
modelling in SiCp/Al turning process via artificial
neural network approach, IOP Conference Series:
Materials Science and Engineering 012022.
Zhao X., Lovreglio R. and Nilsson D., (2020) , Modelling
and interpreting pre-evacuation decision-making using
machine learning, Automation in Construction,
103140.
Uzkent B., Sheehan E., Meng C., Tang Z, Burke M, Lobell
D, and Ermon S, (2019), Learning to interpret satellite
images using Wikipedia, Proceedings of the Twenty-
Eighth International Joint Conference on Artificial
Intelligence.
Brisk R, Bond RR, Banks E, Piadlo A, Finlay D,
McLaughlin J, and David M, (2019), Deep learning to
automatically interpret images of the
electrocardiogram: Do we need the raw samples?,
Journal of electrocardiology, S65–S69
Kim D-H, Kim T, Wang X, Kim M, Quan Y, Oh J, Min S-
H, Kim H, Bhandari B, Yang I, and Ahn, S-H, (2018),
Smart Machining Process Using Machine Learning: A
Review and Perspective on Machining Industry,
International Journal of Precision Engineering and
Manufacturing-Green Technology, 555-568.
Rahman H, Ahmed M.U, Barua, S, Funk P, and Begum S,
(2021) Vision-Based Driver’s Cognitive Load
Classification Considering Eye Movement Using
Machine Learning and Deep Learning, Sensors, 1424-
8220.
Qadir H A, Shin Y, Solhusvik, J, Bergsland J, Aabakken L,
Balasingham I, (2019), Polyp detection and
segmentation using mask R-CNN: Does a deeper
feature extractor CNN always perform better?, 2019
13th International Symposium on Medical Information
and Communication Technology (ISMICT) 1–6.
Sheuly, S.S., Ahmed M U, and Begum S, (2021), Machine
Learning Based Digital Twin in Manufacturing: A
Bibliometric Analysis and Evolutionary Overview,
submitted to Journal of applied sciences, 1424-8220.
ICAART 2023 - 15th International Conference on Agents and Artificial Intelligence
378

Hamidur R, Ricky S D C, Ahmed M U, Rickard S,
Tomohiko S, Peter F, (2023), Artificial Intelligence-
based Life Cycle Engineering in Industrial Production:
A Systematic Literature Review (Jan 2023), Journal of
IEEE ACCESS (IEEE ACCESS)
Sharmin S S, Shaibal B, Shahina B, Ahmed M U, Ekrem G,
Michael O, (2021), Data Analytics using Statistical
Methods and Machine Learning: A Case Study of
Power Transfer Units (Mar 2021), International Journal
of Advanced Manufacturing Technology (IJAMT).
Quantitative Performance Analysis from Discrete Perspective: A Case Study of Chip Detection in Turning Process
379
