
Creating a Math Expression Filter to Extract
Concise Math Expression Images
Kuniko Yamada
1
and Harumi Murakami
2
1
Graduate School for Creative Cities, Osaka City University, Osaka, Japan
2
Graduate School of Informatics, Osaka Metropolitan University, Osaka, Japan
Keywords:
Math Expression Image, Concise Math Expression, Math Expression Filter, SVM, CNN.
Abstract:
Even though the web is an effective resource to search for math expressions, finding appropriate ones among
the obtained documents is time-consuming. Therefore, we propose a math expression filter that presents ap-
propriate images for such searches. We call an appropriate math expression a concise math expression, such
as
ˆ
f
h
(x) =
1
Nh
∑
n
i=1
K(
x−x
i
h
), written in a compact form whose content can be interpreted by the math expres-
sion itself. We determined the conditions satisfied by a concise math expression and developed classifiers
that discriminate the images of concise math expressions from web images using supervised machine learn-
ing methods based on these conditions. We performed two experiments: Experiment 1 used methods other
than deep learning, and Experiment 2 used deep learning. A convolutional neural network (CNN) with trans-
fer learning and fine tuning by VGG16 shows high performance with an obtained F-measure of 0.819. We
applied this filter to a task that presents math expression images by entering mathematical terms into a web
search engine as queries. All of the evaluation metrics outperformed the previous study, including F-measure,
MAP, and MRR.
1 INTRODUCTION
In recent years, the importance of mathematical in-
formation retrieval (MIR) has increased (Zanibbi and
Blostein, 2012). Since mathematics is a tool for ex-
pressing various concepts in science fields, under-
standing math expressions is imperative in such fields.
When someone wants to clearly understand an ex-
pression, the web provides a natural searching re-
source. However, web search for math expressions
has its problems. After web documents are obtained
that contain math expressions, finding the appropriate
math expressions in the located documents is time-
consuming. Such documents contain many various
types of math expression images. For example, such
variables as “x” have no intrinsic meaning, and such
fragments as “log” and “≤” are not math expressions,
and some long expressions simply show the process
for deriving a formula. Among expressions and frag-
ments of expressions, we extracted math expressions,
including
ˆ
f
h
(x) =
1
Nh
∑
n
i=1
K(
x−x
i
h
), which are long
enough for human interpretation without supplemen-
tary explanation, although shorter than expressions
from which a formula is derived. We call these con-
cise math expressions. First, we collected candidate
expressions, analyzed their features, and determined
the conditions of a concise math expression. We then
produced a math expression filter by developing clas-
sifiers to perform binary classification and compared
the performance of each classifier with the others. Fi-
nally, we applied our filter to a task that presents math
expression images on web searches and discussed the
results.
2 RELATED WORK
Various types of research have been pursued in MIR.
The first is math formula similarity searches, such as
adopting three different similarity measures (Ohashi
et al., 2016), using two different tree structures
(Davila and Zanibbi, 2017), and focusing on the sim-
ilarity of substructures (Zhong et al., 2020). Other
types of MIR include a math document classification
method based on text combined with the structures of
math expressions (Suzuki and Fujii, 2017), extract-
ing identifier-definiens pairs to improve performance
in MIR tasks (Schubotz et al., 2017), and focusing
on partial equations within equations to analyze the
frequency distributions of math expressions in large
Yamada, K. and Murakami, H.
Creating a Math Expression Filter to Extract Concise Math Expression Images.
DOI: 10.5220/0011799700003393
In Proceedings of the 15th International Conference on Agents and Artificial Intelligence (ICAART 2023) - Volume 3, pages 909-915
ISBN: 978-989-758-623-1; ISSN: 2184-433X
Copyright
c
2023 by SCITEPRESS – Science and Technology Publications, Lda. Under CC license (CC BY-NC-ND 4.0)
909

scientific datasets (Greiner-Petter et al., 2020). For
math image recognition, there are conversions such
as image to LaTeX (Peng et al., 2021; Wang and
Liu, 2016) and image to markup (Deng et al., 2017).
Other work summarizes content by generating head-
lines with math equations (Yuan et al., 2020). How-
ever, none of these are intended for the web, and
the datasets are also specific. For the web, a for-
mula search available from a browser is “Approach
Zero” (Zhong, 2022), which allows users to search
for formulae in specific databases. For PDFs, there
is research on analyzing PDFs using OCR software
and presenting math expression images in response
to a query (Yamada and Murakami, 2020) and re-
search on detecting math formula regions as bounding
boxes around formulae in PDFs using a CNN (Dey
and Zanibbi, 2021). Our research aims to extract con-
cise math expression images from images in HTML
documents on the Web by binary classification with-
out directly analyzing the contents of the images. To
our knowledge, no similar studies were found.
3 EXPERIMENTS
After setting a dataset, we applied preprocessing in-
cluding elimination of duplicate images, and deter-
mined the concise math expression conditions. We
then checked the correct images of the dataset based
on the conditions and conducted two experiments for
evaluating the performance of the created classifiers.
Experiment 1 used machine learning methods other
than deep learning. Experiment 2 used CNNs. Fi-
nally we compared all of the classifiers and selected
the best one.
3.1 Dataset
Table 1: Dataset. These raw data include duplicate images
and errors in preprocessing. “Other than html” includes
PDFs, slides, Google Books and so on.
Dataset Image Acquired webpage breakdown
Total Correct Other than html Error Html
D
0 trn
19,470 442 1,091 80 1,829
D
0 val
15,427 351 1,269 60 1.671
D
0 tst
23,988 929 1,662 72 2,266
Total 58,885 1,722 4,022 212 5,766
We use the same dataset as studied in a prior work
(Yamada et al., 2018). We randomly selected 100 key-
words from the index of Bishop’s “Pattern Recogni-
tion and Machine Learning” (Bishop, 2006) and per-
formed a web search using these keywords as queries
to obtain the top 100 web pages. We created a dataset
by extracting all the images from those pages. In Ta-
ble 1, D
0 trn
is the keywords from 31 to 60 as the train-
ing dataset, D
0 val
is the dataset from keywords 1 to
30 as validation, and D
0 tst
is the keywords from 61 to
100 as the testing dataset. The first author manually
judged images to determine whether they were related
to the keywords. When unclear cases surfaced, judg-
ments were made in consultation with another person
(the same person throughout all judgments). Keyword
examples are softmax function, SVM, kernel density
estimation method, Heaviside step function, Gaus-
sian kernel, convex function, Probit function, Boltz-
mann distribution, functional derivative, and least-
mean-squares algorithm.
3.2 Preprocessing
Because of the method used to create D
0 trn
and D
0 val
,
they included the same image registered with different
IDs. Therefore, we deleted the ones with overlapping
features. In Experiment 1, the basic features (file size,
width, and height) were used, so images with these
values overlapping were deleted. In Experiment 2,
the images were used directly, so the images with the
same features and the same appearance were deleted.
In addition, unnecessary icons such as buttons and lo-
gos were removed from the dataset for Experiment
1. We extracted the common strings from the image
names of the unnecessary icons in D
0 trn
, and images
with these strings in their image names were deleted
in advance.
3.3 Determining Concise Math
Expression Conditions
After preprocessing, we obtained 314 of the origi-
nal 442 keyword-related correct images in D
0 trn
(Ta-
ble 1) and analyzed them to identify the conditions
of a concise math expression. As a result of a web
search using the above keywords, many of the correct
math expressions have proper names such as Gaus-
sian kernel. Therefore, they are written in an orga-
nized form and are interpretable by the expressions
themselves. That means these images are considered
suitable candidates for concise math expression im-
ages. We examined the following by directly view-
ing the images: “Number of horizontal characters (in-
cluding symbols),” “number of vertical characters (in-
cluding symbols),” “number of lines,” “number of ex-
pressions
1
,” and “number of concatenations” (=, <,
and so on). Because the fonts used in web math ex-
1
The number of expressions in () is 1. Nested expres-
sions in an expression are not counted.
ICAART 2023 - 15th International Conference on Agents and Artificial Intelligence
910
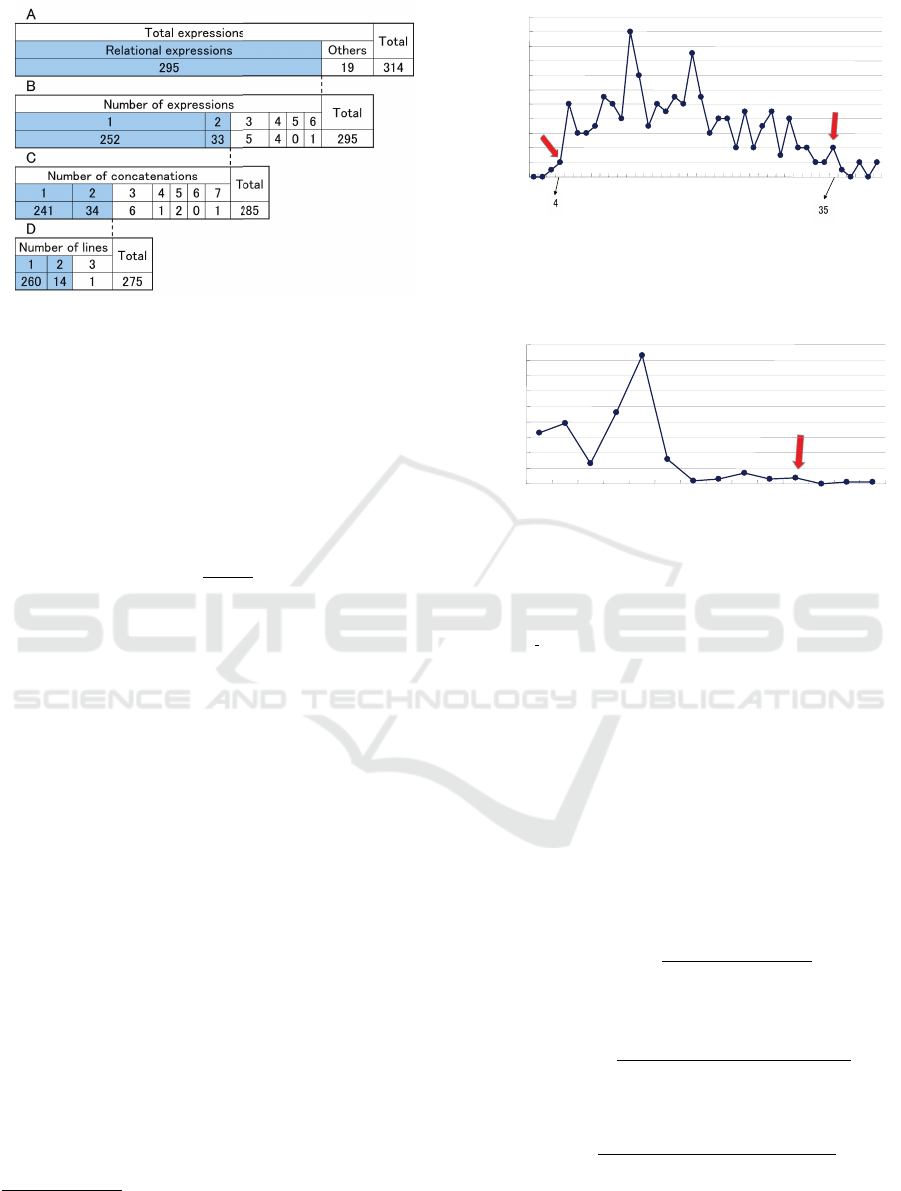
Figure 1: Threshold determination. The third row of each
figure represents the frequency. We determined the thresh-
olds in order from the easiest one (from top to bottom in the
table). After determining a threshold, we searched for the
next one in the images that were already within the thresh-
old.
pression images are quite different and the layouts of
expressions are also different, the number of horizon-
tal characters is counted regardless of the size of the
font. For the number of vertical characters, an expo-
nent, a fractional line, and others are set to 0.5. For
example, if an image is
x−1
x
2
+x−1
, the number of hori-
zontal characters is 6 and the number of vertical char-
acters is 3.
The thresholds were determined in order from the
easiest one in Fig. 1. (1) From A, a relational expres-
sion is first adopted. A relational expression is one in
which the left and right sides are connected by “=,”
“<,” and so on
2
. (2) From B, i = 1 or2, i: number
of expressions. (3) From C, j = 1 or 2, j: number of
concatenations. (4) From D, k = 1 or 2, k: number of
lines. Then (5) from Fig. 2, the frequency between
4 and 35 is 2 or more, so 4 ≤ l ≤ 35, l: number of
horizontal characters. (6) From Fig. 3, the frequency
of 6 or less is 2 or more, so 1 ≤ m ≤ 6, m: number of
vertical characters.
Therefore, a concise expression satisfies (1) a re-
lational expression, (2) i = 1 or2, i: number of expres-
sions, (3) j = 1or 2, j: number of concatenations, (4)
k = 1 or 2, k: number of lines, (5) 4 ≤ l ≤ 35, l: num-
ber of horizontal characters, and (6) 1 ≤ m ≤ 6, m:
number of vertical characters.
We manually checked the correct images of the to-
tal dataset based on the above conditions. Since our
dataset is very imbalanced, we randomly undersam-
pled the data with “*” in Table 2. In Experiment 2,
we adjusted the numbers of datasets (other than test
2
“=” is 299, “inequality sign” is 14, “≈” is 4, “'” is
2, “≡” is 2, “:=” is 2, “∼” is 2, and “” is 1 (including
multiple concatenations in a single image).
㻜
㻞
㻠
㻢
㻤
㻝㻜
㻝㻞
㻝㻠
㻝㻢
㻝㻤
㻞㻜
㻞㻞
㻝 㻢 㻝㻝 㻝㻢 㻞㻝 㻞㻢 㻟㻝 㻟㻢
㻺㼡㼙㼎㼑㼞㻌㼛㼒㻌㼏㼔㼍㼞㼍㼏㼠㼑㼞㼟
㻲㼞㼑㼝㼡㼑㼚㼏㼥
㻜
㻞
㻠
㻢
㻤
㻝㻜
㻝㻞
㻝㻠
㻝㻢
㻝㻤
㻞㻜
㻞㻞
㻝 㻢 㻝㻝 㻝㻢 㻞㻝 㻞㻢 㻟㻝 㻟㻢
㻺㼡㼙㼎㼑㼞㻌㼛㼒㻌㼏㼔㼍㼞㼍㼏㼠㼑㼞㼟
㻲㼞㼑㼝㼡㼑㼚㼏㼥
Figure 2: Number of horizontal characters. This figure
shows the number of characters from 1 to 40 (total fre-
quency 257). The remaining 41 to 91 are omitted because
they are sparsely scattered (total frequency 18).
㻠㻢
㻝
㻝㻜
㻠
㻟
㻣
㻟
㻞
㻟㻥
㻟㻟
㻤㻟
㻝㻟
㻝㻢
㻜
㻝㻜
㻞㻜
㻟㻜
㻠㻜
㻡㻜
㻢㻜
㻣㻜
㻤㻜
㻥㻜
㻝 㻝㻚㻡 㻞 㻞㻚㻡 㻟 㻟㻚㻡 㻠 㻠㻚㻡 㻡 㻡㻚㻡 㻢 㻢㻚㻡 㻣 㻣㻚㻡
㻺㼡㼙㼎㼑㼞㻌㼛㼒㻌㼏㼔㼍㼞㼍㼏㼠㼑㼞㼟
㻲㼞㼑㼝㼡㼑㼚㼏㼥
㻠㻢
㻝
㻝㻜
㻠
㻟
㻣
㻟
㻞
㻟㻥
㻟㻟
㻤㻟
㻝㻟
㻝㻢
㻜
㻝㻜
㻞㻜
㻟㻜
㻠㻜
㻡㻜
㻢㻜
㻣㻜
㻤㻜
㻥㻜
㻝 㻝㻚㻡 㻞 㻞㻚㻡 㻟 㻟㻚㻡 㻠 㻠㻚㻡 㻡 㻡㻚㻡 㻢 㻢㻚㻡 㻣 㻣㻚㻡
㻺㼡㼙㼎㼑㼞㻌㼛㼒㻌㼏㼔㼍㼞㼍㼏㼠㼑㼞㼟
㻲㼞㼑㼝㼡㼑㼚㼏㼥
㻠㻢
㻝
㻝㻜
㻠
㻟
㻣
㻟
㻞
㻟㻥
㻟㻟
㻤㻟
㻝㻟
㻝㻢
㻜
㻝㻜
㻞㻜
㻟㻜
㻠㻜
㻡㻜
㻢㻜
㻣㻜
㻤㻜
㻥㻜
㻝 㻝㻚㻡 㻞 㻞㻚㻡 㻟 㻟㻚㻡 㻠 㻠㻚㻡 㻡 㻡㻚㻡 㻢 㻢㻚㻡 㻣 㻣㻚㻡
㻺㼡㼙㼎㼑㼞㻌㼛㼒㻌㼏㼔㼍㼞㼍㼏㼠㼑㼞㼟
㻲㼞㼑㼝㼡㼑㼚㼏㼥
Figure 3: Number of vertical characters.The frequency of 4
to 35 characters in Fig. 2 is 251, and this figure shows the
results using those images.
data D
2 tst
) for batch processing. Figure 4 shows ex-
amples of correct and incorrect images. Correct im-
age (a) is an expression for the complementary error
function and correct image (b) is an expression for the
t-distribution. Incorrect image (c) is the coordinates
of a point, and (d) is the output of the math software
for a cell decomposition of an annulus.
3.4 Evaluation Metric for Classifiers
In Experiment1 and 2, our dataset is very imbalanced,
so we use the F-measure (Eq. (1)) to compare a large
number of classifiers.
F-measure =
2 · precision · recall
precision + recall
, (1)
where
precision =
truepositives
truepositives + falsepositives
and
recall =
truepositives
truepositives + falsenegatives
.
Creating a Math Expression Filter to Extract Concise Math Expression Images
911
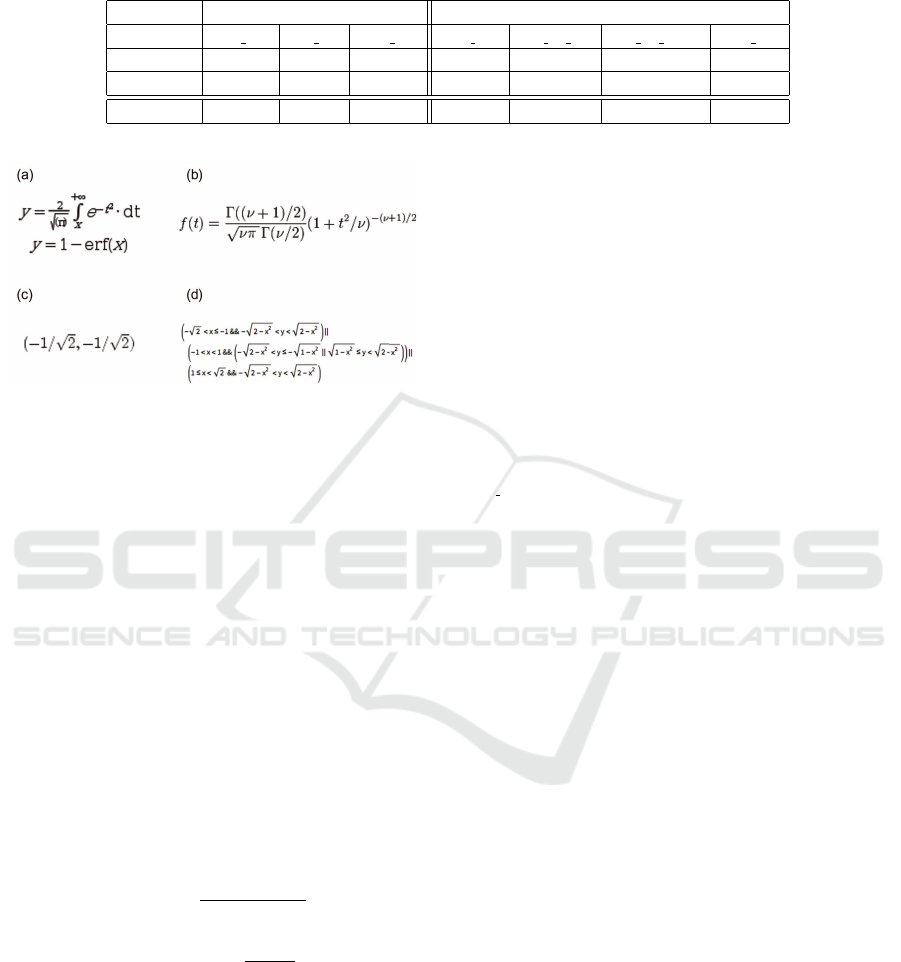
Table 2: Data for experiments. After preprocessing dataset in Table 1, we randomly undersampled the data with “*” in the
table (The criteria for “Correct” in Table 1 and in this Table are different ).
Experiment 1 Experiment 2
Dataset D
1 trn
D
1 val
D
1 tst
D
2 trn
D
2 val bal
D
2 val imbal
D
2 tst
Correct 2,410 1,868 4,336 2,400 1,900 1,900 4,462
Incorrect 2,562
∗
6,076 12,689 2,400
∗
1,900
∗
8,180 18,678
Total 4,972 7,944 17,025 4,800 3,800 10,080 23,140
Figure 4: Examples of correct and incorrect images. Im-
ages labeled (a) and (b) are correct, while (c) and (d) are
incorrect.
3.5 Experiment 1: Machine Learning
Methods Other Than Deep
Learning
In order to create classifiers, we used Weka (Frank
et al., 2022), which has an easy-to-understand inter-
face that allows us to combine many classifiers and
easily change hyperparameters. It also outputs var-
ious evaluation metrics, such as confusion matrices,
making it easy to compare classifiers. We created
classifiers to discriminate concise math expressions
using image features. The basic features were “file
size in bytes,” “number of file width pixels,” and
“number of file height pixels.” Furthermore, “density
(Eq. (2)),” “aspect ratio (Eq. (3)),” and “gray value
(Eq. (4))” were used.
density =
filesize
width · height
, (2)
aspect ratio =
width
height
, (3)
where width is the number of width pixels and height
is the number of height pixels.
gray = |R − G| + |G −B| + |B − R|, (4)
where R is the red component of the image, G is
green, and B is blue. Eq. (4) is used because some
math expression images may appear to be gray but
actually have a color component. If the gray value is
0, then the image is gray. The “+gray value” in Ta-
ble 3 is calculated again as a correct image when the
predicted value of the classifier created with features
other than the gray value is correct and the gray value
is 0. We performed 10-fold cross-validation on ev-
ery classifier and searched for hyperparameters. For
a multilayer perceptron, we considered the number of
hidden layers, and for a random subspace (Ho, 1998),
which is an ensemble learning method, we considered
several classifiers for use. For an SVM (Chang and
Lin, 2011), we used a nonlinear SVM with an RBF
kernel and searched for the values of c and γ.
In Table 3, methods B and J were the best, so we
conducted an evaluation experiment using test data
D
1
tst
in Table 2. As a result, both had an F-measure
of 0.628 using SVM with c = 7000 and γ = 6. Com-
paring both, true positives and true negatives were al-
most the same number, but B had less false positives
and more false negatives, and J had exactly the oppo-
site.
3.6 Experiment 2: CNN Methods
We created CNNs to conduct binary classification that
discriminated between concise math expression im-
ages and other images, using Keras (Chollet et al.,
2022) with a TensorFlow backend. Previously, a large
amount of image data was required for deep learn-
ing, but recently, trained models for transfer learning
have been widely released and are generally available.
We used “data augmentation,” “transfer learning,” and
“fine tuning” methods and examined the models pro-
vided by Keras. Data augmentation is a common
data increasing operation to avoid overfitting caused
by having too few data. Random rotation, transla-
tion, equal volume deformation, zooming, and hori-
zontal inversion of half of the image were performed.
The models of transfer learning were pre-trained by
the ImageNet. The number of epochs for fine tuning
was set at 100, but only NASNetMobile was stopped
early to avoid overfitting. Table 4 shows the results
of the final test data using Table 2’s data. First, as a
baseline, we constructed method A with four Conv2D
layers and four MaxPooling2D layers. The activation
function is the sigmoid function, and the loss function
ICAART 2023 - 15th International Conference on Agents and Artificial Intelligence
912
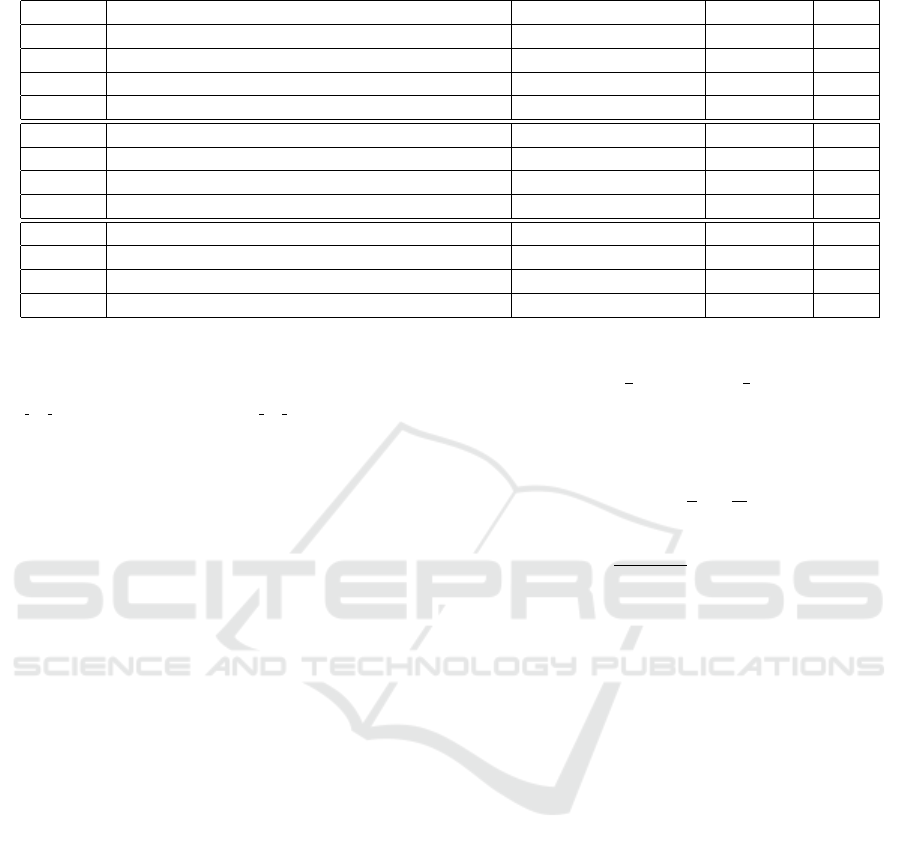
Table 3: Creating classifiers using machine learning method other than deep learning. Top results by each feature.
Method Feature Classifier F-measure Rank
A basic features SVM 0.654 6
B basic features, density SVM 0.677 1
C basic features, aspect ratio SVM 0.661 4
D basic features, density, aspect ratio SVM 0.669 3
E basic features, gray value MultilayerPerceptron 0.638 9
F basic features, density, gray value RandomSubSpace 0.649 8
G basic features, aspect ratio, gray value MultilayerPerceptron 0.635 10
H basic features, density, aspect ratio, gray value RandomSubSpace 0.653 7
I basic features, +gray value SVM 0.658 5
J basic features, density, +gray value SVM 0.677 1
K basic features, aspect ratio, +gray value SVM 0.623 12
L basic features, density, aspect ratio, +gray value SVM 0.626 11
is binary cross entropy. We examined eight different
patterns for each model, which were whether to use
D
2 val bal
(balanced data) or D
2 val imbal
(imbalanced
data) as validation data, whether to use data augmen-
tation or not, and whether to use fine tuning or not.
As a result, method N was found to be the best.
3.7 Experimental Results
Despite various performances in Experiment 1,
method N (Table 4) was the best throughout Exper-
iment 1 and 2. The conditions were (1) use VGG16
(Simonyan and Zisserman, 2014) as transfer learning,
(2) use balanced data as validation data, (3) do not use
data augmentation, and (4) use fine tuning. Thus, the
design of our math expression filter was completed.
4 APPLICATION
We applied the experimental results to the previous
study (Yamada et al., 2018). The task performs web
searches using a math term as a query and presents
the top ten math expressions related to the term with
its surrounding information. Score(i
k
) is given to each
expression i
k
by Eq (5):
score(i
k
) = x
line
+ x
key
+ x
svm
+ x
bonus
, (5)
where x
line
= 1 if i
k
is in a separate line, 0 otherwise;
x
key
= 1 if i
k
has a keyword within a window size set
from -200 to +200 characters, 0 otherwise; x
svm
= 1
if i
k
is discriminated as positive by the SVM, 0 oth-
erwise; and x
bonus
= 1 if i
k
has a perfect score so far
and appears first in the same web document, 0 other-
wise. The classifier is a nonlinear SVM with an RBF
kernel. The correct image is a math expression image
related to the keyword, which is different from this
study. Evaluation metrics are the F-measure (Eq. (1))
where precision =
r
n
and recall =
r
c
, Mean Reciprocal
Rank (MRR) (Eq. (6)), and Mean Average Precision
(MAP). MAP is the macro mean of the Average Pre-
cision(AP) (Eq. (7)):
MRR =
1
n
n
∑
k=1
1
r
0
k
, (6)
AP =
1
min(n, c)
∑
s
I(s)Prec(s), (7)
where r is the number of correct images of top n, c
is the total number of correct images, r
0
k
is the rank
of the correct images at the top of the k-th keyword,
I(s) is a flag indicating whether the image at s-th is
correct, and Prec(s) is the precision at s-th.
We reranked them by replacing the x
svm
values in
Eq. (5) with our filter’s values. Table 5 shows that our
filter worked well.
5 DISCUSSION
Concerning our data, using data augmentation should
be avoided because none of the math web images are
tilted or upside down. However, since the sizes of the
image margins vary, and some of the images are un-
clear after preprocessing (α channel removal and so
on), data augmentation might be considered in these
cases. We plan to study data augmentation in such
cases in our future work. For the validation data when
dealing with imbalanced data, Table 4 does not show
which choice was better, balanced or imbalanced data.
For the application, since the original classifier dis-
criminated whether an image was related to a given
keyword, the same image may be correct or incorrect,
depending on its context. The ability to identify cor-
rect images regardless of context led to improvement.
Creating a Math Expression Filter to Extract Concise Math Expression Images
913
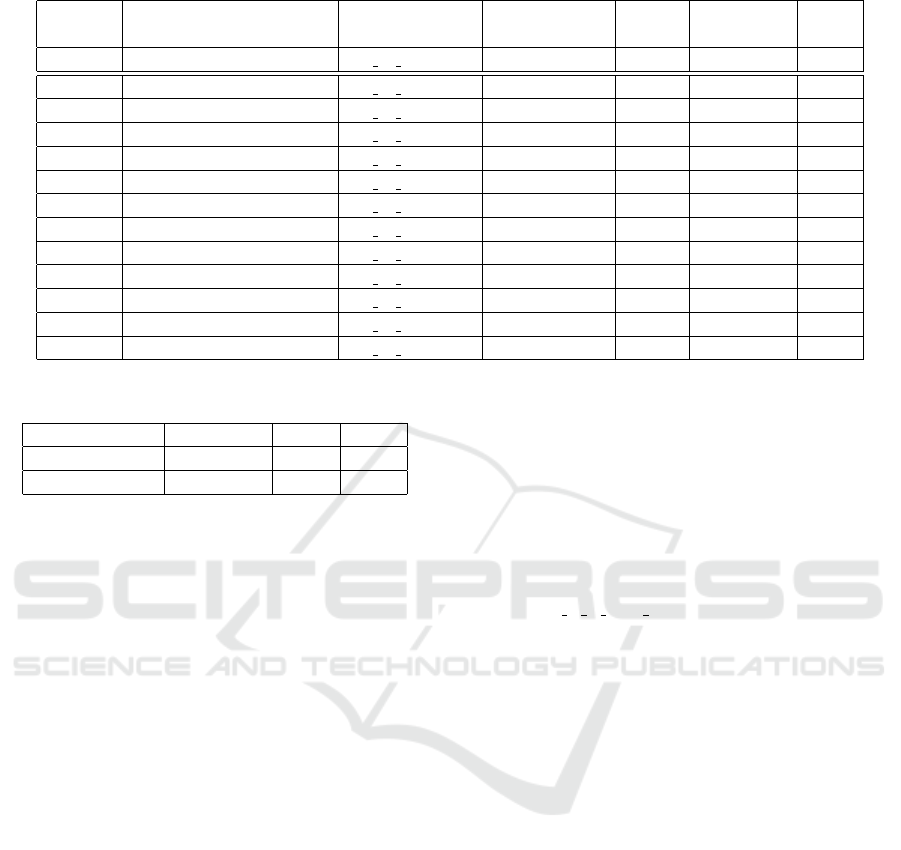
Table 4: Creating classifiers using CNNs. Top results by each model, where “+” is used and “−” is not used.
Method Transfer learning model Validation data Data Fine F-measure Rank
augmentation tuning
M baseline D
2 val imbal
− − 0.758 10
N VGG16 D
2 val bal
− + 0.819 1
O DenseNet169 D
2 val imbal
− + 0.807 2
P VGG19 D
2 val imbal
− + 0.804 3
Q DenseNet201 D
2 val bal
− + 0.803 4
R DenseNet121 D
2 val bal
− + 0.801 5
S ResNet50 D
2 val imbal
+ + 0.801 5
T InceptionResNetV2 D
2 val bal
+ + 0.795 7
U MobileNet D
2 val imbal
+ + 0.794 8
V MobileNetV2 D
2 val bal
+ + 0.782 9
W Xception D
2 val imbal
+ + 0.753 11
X InceptionV3 D
2 val imbal
− + 0.747 12
Y NASNetMobile D
2 val imbal
− + 0.741 13
Table 5: Comparison of evaluation metrics@10.
F-measure MRR MAP
Previous study 0.40 0.84 0.42
Using filter 0.55 0.86 0.45
6 CONCLUSION
We developed a math expression filter to extract con-
cise math expression images. We determined the con-
ditions satisfied by a concise math expression and
developed classifiers that discriminate the images of
concise math expression images from web images us-
ing supervised machine learning methods based on
these conditions. To investigate our filter’s perfor-
mance, we applied it to a task that presents math ex-
pression images and obtained good results.
REFERENCES
Bishop, C. M. (2006). Pattern Recognition and Machine
Learning. Springer, NY, New York.
Chang, C.-C. and Lin, C.-J. (2011). Libsvm: A library for
support vector machines. ACM Transactions on Intel-
ligent Systems and Technology, 2(3):27:1–27:27.
Chollet, F. et al. (2022). Keras. https://github.com/fchollet/
keras.
Davila, K. and Zanibbi, R. (2017). Layout and semantics:
Combining representations for mathematical formula
search. In Proceedings of the 40th International ACM
SIGIR Conference on Research and Development in
Information Retrieval, pages 1165–1168.
Deng, Y., Kanervisto, A., Ling, J., and Rush, A. M. (2017).
Image-to-markup generation with coarse-to-fine at-
tention. In Proceedings of the 34th International Con-
ference on Machine Learning (ICML 2017), pages
980–989.
Dey, A. and Zanibbi, R. (2021). Scanssd-xyc: Faster de-
tection for math formulas. In Document Analysis and
Recognition, (ICDAR 2021), volume 12916 of LNCS,
pages 91–96. Springer.
Frank, E., Hall, M. A., and Witten, I. H. (2022).
The weka workbench. online appendix for ”data
mining: Practical machine learning tools and
techniques”. https://www.cs.waikato.ac.nz/ml/weka/
Witten et al 2016 appendix.pdf.
Greiner-Petter, A., Schubotz, M., M
¨
uller, F., Breitinger, C.,
Cohl, H. S., Aizawa, A., and Gipp, B. (2020). Dis-
covering mathematical objects of interest - a study of
mathematical notations. In Proceedings of the Web
Conference 2020 (WWW ’20), pages 1445–1456.
Ho, T. K. (1998). The random subspace method for con-
structing decision forests. IEEE Transactions on Pat-
tern Analysis and Machine Intelligence, 20(8):832–
844.
Ohashi, S., Kristianto, G. Y., Topi
´
c, G., and Aizawa, A.
(2016). Efficient algorithm for math formula seman-
tic search. IEICE Transactions on Information and
Systems, 99(4):979–988.
Peng, S., Gao, L., Yuan, K., and Tang, Z. (2021). Image
to latex with graph neural network for mathematical
formula recognition. In Proceedings of 16th Interna-
tional Conference on Document Analysis and Recog-
nition (ICDAR 2021), volume 12822 of Lecture Notes
in Computer Science, pages 648–663. Springer.
Schubotz, M., Kr
¨
amer, L., Meuschke, N., Hamborg, F.,
and Gipp, B. (2017). Evaluating and improving the
extraction of mathematical identifier definitions. In
Proceedings of Experimental IR Meets Multilingual-
ity, Multimodality, and Interaction- 8th International
Conference of the CLEF Association (CLEF 2017),
volume 10456 of Lecture Notes in Computer Science,
page 82–94. Springer, Cham.
Simonyan, K. and Zisserman, A. (2014). Very deep con-
volutional networks for large-scale image recognition.
ICAART 2023 - 15th International Conference on Agents and Artificial Intelligence
914

In Proceedings of 3rd International Conference on
Learning Representations, (ICLR 2015). https://arxiv.
org/abs/1409.1556.
Suzuki, T. and Fujii, A. (2017). Mathematical document
categorization with structure of mathematical expres-
sions. In Proceedings of ACM/IEEE Joint Conference
on Digital Libraries (JCDL 2017), pages 119–128.
Wang, Z. and Liu, J.-C. (2016). Translating math formula
images to latex sequences using deep neural networks
with sequence-level training. International Journal on
Document Analysis and Recognition, 24(1):63–75.
Yamada, K. and Murakami, H. (2020). Mathematical ex-
pression retrieval in pdfs from the web using mathe-
matical term queries. In Proceedings of Trends in Ar-
tificial Intelligence Theory and Applications. Artificial
Intelligence Practices - 33rd International Conference
on Industrial, Engineering and Other Applications of
Applied Intelligent Systems (IEA/AIE 2020), volume
12144 of Lecture Notes in Computer Science, pages
155–161. Springer, Cham.
Yamada, K., Ueda, H., Murakami, H., and Oka, I. (2018).
Mathematical expression image retrieval on web using
mathematical terms as queries. Transactions of the
Japanese Society for Artificial Intelligence, 33(4):A–
H91 1–13.
Yuan, K., He, D., Jiang, Z., Gao, L., Tang, Z., and Giles,
C. L. (2020). Automatic generation of headlines
for online math questions. In Proceedings of the
Thirty-Fourth AAAI Conference on Artificial Intelli-
gence (AAAI-20), pages 9490–9497.
Zanibbi, R. and Blostein, D. (2012). Recognition and re-
trieval of mathematical expressions. International
Journal on Document Analysis and Recognition,
45(4):331–357.
Zhong, W. (2022). Approach zero. https://approach0.xyz/
search/.
Zhong, W., Rohatgi, S., Wu, J., Giles, C. L., and Zanibbi,
R. (2020). Accelerating substructure similarity search
for formula retrieval. In Proceedings of Advances in
Information Retrieval - 42nd European Conference on
IR Research (ECIR 2020), volume 12035 of Lecture
Notes in Computer Science, pages 714–727. Springer.
Creating a Math Expression Filter to Extract Concise Math Expression Images
915
