
Integration of Statistical Methods and Artificial Neural Networks for
the Detection of Oil Stains in the Aquatic Environment
Monik Silva Sousa and João Viana da Fonseca Neto
Departamento de Engenharia Elétrica, Universidade Federal do Maranhão, São Luís, Brazil
Keywords: Linear Discriminant Analysis, Machine Learning, Oil Stain Detection, Classification, Predictive Model,
Artificial Neural Networks.
Abstract: The growth in oil exploration and transport increases the risk of accidents in the aquatic environment. Early
detection of oil slicks in the aquatic environment is essential to minimize the risk of accidents, as well as
effective decision-making. Thus, a method for detecting oil stains is needed to reduce the damage caused by
industrial activities to the environment. This article presents statistical methods of classification and machine
learning to detect oil slicks on the ocean surface. For this, images from a Synthetic Aperture Radar (SAR)
were used. The proposed model for detecting oil slicks uses Linear Discriminant Analysis (LDA) to generate
an estimate of the class to which the database images belong (image without oil slick, and image with oil
slick), and the Artificial Neural Network (ANN) to classify the data, in which these data come from the
grouping of the image with the result of the LDA. With the results obtained, it is concluded that the proposed
method of detecting oil slicks on the ocean surface can detect oil slicks with good accuracy.
1 INTRODUCTION
The world production of hydrocarbons, especially oil,
began in the mid-twentieth century and has since
grown exponentially. According to data from the
National Agency of Petroleum, Natural Gas and
Biofuels (ANP), total oil production in Brazil in 2019
was 1.017 billion barrels (ANP, 2020).
The growth in production, consumption, exports
and imports of oil and its derivatives increases the
probability of oil spill accidents. Consequently, it is
important to develop efficient techniques to prevent,
detect and monitor oil slicks.
Several studies are presented in the literature
related to oil spills for the detection of oil stains.
Some studies treat stain detection as a segmentation
problem (Krestenitis, M. O., 2019), in which they use
deep convolutional neural networks (DCNN) to
perform semantic segmentation of the image in
various areas of interest, including oil spill, which
makes it easier to detect the oil stain.
Remote sensing based on Synthetic Aperture
Radar (SAR) has been widely used for monitoring oil
slicks in the ocean, due to its wide area coverage and
its ability to operate in all climates. However, recently
Andreotti and Peixoto (2020) developed an
autonomous system (called ARIEL), combining an
autonomous vessel (unmanned surface vehicle) and a
drone. These two subsystems work together to
monitor a region of interest where oil spills are likely
to occur.
In this context of oil detection, the objective of
this work is the elaboration of an algorithm for the
detection of anomalies (oil stain on the surface of the
ocean), with time and memory restrictions, so that it
can be embedded in mobile sensors. To achieve this
goal, the integration of statistical methods and
artificial neural networks is proposed.
The focus of this work is the integration of
statistical methods (linear discriminant analysis) and
the simplest ANN (perceptron). Well, this detection
is part of a work in progress, which wants to adjust
the positioning of the sensor to monitor (track) the oil
stain, based on the geographic positioning of the
anomaly. Consequently, the effective contribution of
this work lies in the development of an algorithm for
detecting oil slicks on the ocean surface to be
embedded in the sensor, so that the detection of the
slick is done online, alerting if it detects an oil slick,
avoiding greater damage to the aquatic environment
and the coastal population.
Throughout this article, the steps of the proposed
methodology for the detection of oil slicks in the
550
Sousa, M. and Neto, J.
Integration of Statistical Methods and Artificial Neural Networks for the Detection of Oil Stains in the Aquatic Environment.
DOI: 10.5220/0011799300003411
In Proceedings of the 12th International Conference on Pattern Recognition Applications and Methods (ICPRAM 2023), pages 550-557
ISBN: 978-989-758-626-2; ISSN: 2184-4313
Copyright
c
2023 by SCITEPRESS – Science and Technology Publications, Lda. Under CC license (CC BY-NC-ND 4.0)
aquatic environment are presented, based on the
integration of statistical methods and artificial neural
networks (ANNs). In Section 2, the proposed oil stain
detection system is presented, in which the block
diagram of the proposed predictive model is exposed
and from it it is reported on its blocks that are being
explored: SAR measurements and critical modeling.
Section 3 presents the results of computational
experiments resulting from the implementation of the
proposed integration method. In Section 4 the
conclusion is presented.
2 OIL STAIN DETECTION
SYSTEM
In this section, the proposed integration method is
presented, in which its scheme is illustrated by the
block diagram of Figure 1, then each block of the
diagram is reported as: SAR measurement block,
which exposes the base used in this work, block of the
critic, which is where the proposed method is located,
that is, where the Linear Discriminant Analysis
(LDA) and the Artificial Neural Network (ANN) are
located. In addition to also exposing the metrics to
evaluate the performance of this proposed method.
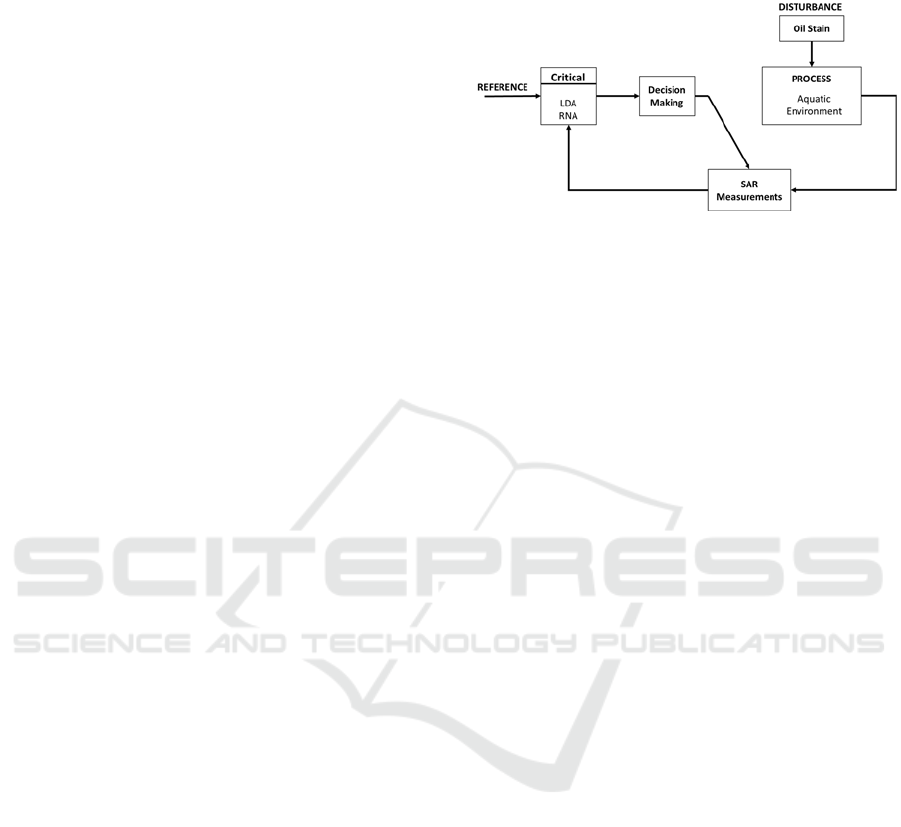
2.1 Proposed Predictive Method
The proposed predictive method for detecting oil
slicks on the oceanic surface is based on the
integration of statistical methods, multivariate data
analysis with the artificial neural network. The
multivariate data analysis technique is used to
estimate the class that the data belongs, that is, if
SAR image has an anomaly or not, then this data is
added to the concatenated vector of the image to add
more information, helping in the classification. This
method is contextualized as the critical module of the
system dedicated to decision making, considering the
process as the aquatic environment and oil slicks as
disturbances, and this process is monitored by
Synthetic Aperture Radar. Figure 1 illustrates this
system in a block diagram.
According to Figure 1, the block diagram of the
proposed predictive method, having as reference
signal the clean aquatic environment (without stains),
the critic is responsible for acquiring the classifier
model from the interaction of the LDA and of ANN,
which has as answer the classification of the image
with oil stain or without oil stain. This answer is used
for decision-making, because if an oil stain is
detected, it is necessary to apply certain measures to
contain the stains in order to minimize the
environmental impacts that they can cause.
Figure 1: Block diagram of the proposed predictive method.
The process that is aquatic that you want to
monitor, which can be close to the oil and gas
exploration and production industries and where there
is a large flow of ships, since most of the oil is
transported by ships. Oil slicks are considered as
process disturbances, and measurements of the
aquatic environment are performed by SAR. These
SAR measurements are inputs to the critic, which is
based on multivariate analysis of data and ANN, and
the key between the decision-making process and the
measures applied by an external individual.
2.2 SAR Measurements
Remote sensing systems have been widely used to
detect stains resulting from oil spills at sea. The radar
is a simple system that basically consists of the
transmission and reception of electromagnetic pulses,
the Synthetic Aperture Radar (SAR) is a form of radar
widely used to capture images, because as long as the
monitored systems are active, that is, they provide
with its own lighting, the SAR is capable of acquiring
images during the day and also at night, as its
radiation belongs to the microwave region.
In this study, the database provided by the Oil
Spill Detection Dataset – MKLab, which contains
1112 images, 1002 for training and 110 for testing,
used. In total there are 880 images with oil slicks on
the ocean surface and 232 clean images without oil
slicks. In Figure 1, this database is illustrated by the
block of images of SAR measurements that describe
instances of oil spills, similar (which look a lot like
an oil slick, but are not), land, sea and sea areas.
For the monitoring of the aquatic environment, the
SAR images contained in that base were used, which
were acquired through the missions of the European
satellite Sentinel-1, during the period from September
28, 2015 to October 31, 2017. Geographic
coordinates, and date and time of the pollution event
were provided by the European Maritime Safety
Integration of Statistical Methods and Artificial Neural Networks for the Detection of Oil Stains in the Aquatic Environment
551
Agency (EMSA) through the CleanSeaNet service
(Krestenitis, M. O., 2019).
The terrestrial range coverage of the SAR sensor
used by the Sentinel-1 mission is approximately 250
km, with pixel spacing equal to 10 × 10 m, therefore,
this radar can cover a large area of interest, in addition
to capturing relatively small-sized instances. This
employed system operates in the c-band, and the
polarization of its radar is double, that is, transmitted
vertical polarization – received vertical polarization
(VV) and transmitted vertical polarization – received
horizontal polarization (VH). To build the dataset,
only the raw data from the VV band was processed,
following a series of pre-processing steps to extract
common views (Krestenitis M. O., 2019). The
captured images have a dimension of 1250 × 650 ×
3 pixels, and in this work these images were resized
to 63 × 33 × 3 pixels.
Figure
2 illustrates an image
captured by this SAR system.
Figure 2: SAR measurements.
Based on Figure 2, an elongated black spot can be
seen, which stands out in the image. This format of
stains are usually oil spills and can be identified in the
database.
2.3 Critic's Modelling
In this section, the modelling of the critical block is
exposed, which is the integration of the linear
discriminant analysis with the artificial neural
network, to then perform the image classification. In
which, the LDA adds more information at the time of
classification.
2.3.1 Statistic Analysis
The statistical modelling proposed for detecting and
classifying oil slicks on the surface determined in
four steps: capture of non-segmented images,
dimensionality reduction, class estimation and finally
image classification.
Considering the oceanic surface, images of the
surface are first acquired, that is, the surface to be
monitored, then the dimensionality is reduced and the
classes are estimated via multivariate analysis
techniques. Finally, artificial neural networks are
used to classify the images, with the images being
classified into two groups: surface with oil stains and
clean surface (without oil stain).
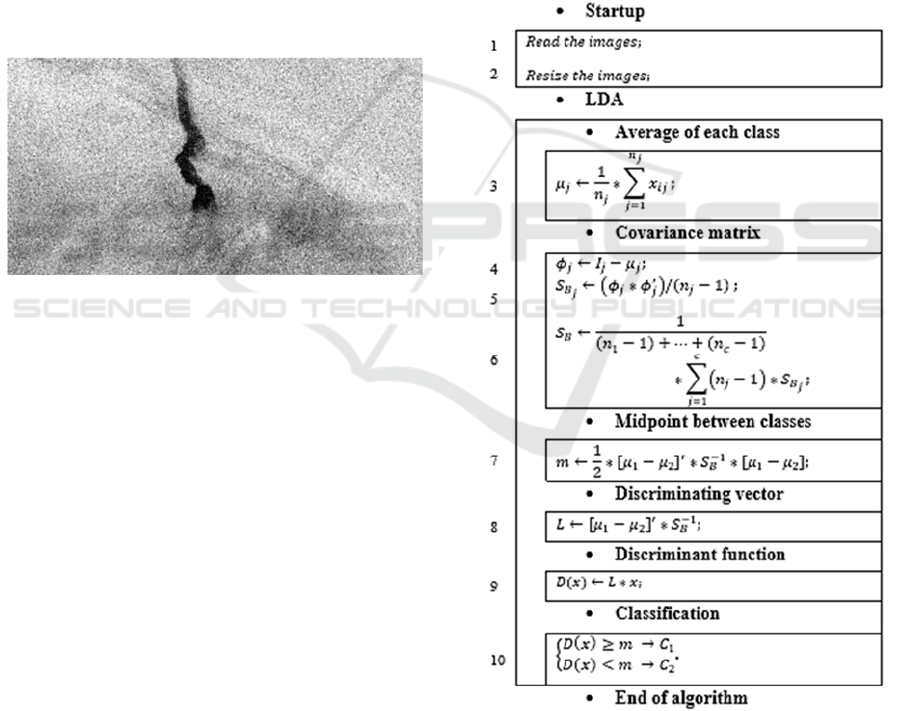
Linear Discriminant Analysis
The linear discriminant analysis (LDA) technique
was used to obtain class estimates from the 1.112
images (clean ocean surface or oil slick). The LDA is
used to analyse the relationship between a non-metric
dependent variable and a metric independent variable
(explanatory variables or also called predictors)
(Hair, J. F et al, 2019).
Algorithm 1: LDA.
The development of the LDA is carried out from
the following steps: the first step is to calculate the
mean of the classes, to then calculate the covariance
of the classes and then the common covariance matrix
of the classes. The second step is to calculate the
discriminant vector, which is used to construct the
ICPRAM 2023 - 12th International Conference on Pattern Recognition Applications and Methods
552
differential equation that satisfactorily classifies the
classes, increasing the variance between classes and
minimizing the variance within classes (Duda, R. O.,
Hart, P. E., Stork, D. G., 2001). The last step is the
classification rule based on Fisher's discriminant
function, but for that it is also necessary to calculate
the midpoint between the classes. These steps of the
LDA algorithm are presented below, in Algorithm 1.
According to the LDA algorithm, we have 𝜇
the
average of class 𝑗, 𝑥
the samples of class 𝑗, 𝑛
the
number of images acquired from class j, c the number
of classes, 𝜙
the subtraction of data from class 𝑗 by
the average of class 𝜇
, 𝑆
the covariance matrix of
class 𝑗 , 𝑆
the common covariance matrix of the
classes, 𝑥 the input data for the LDA classifier, 𝑚 the
threshold, the midpoint between the classes, and
𝐷(𝑥) the output of the classifier.
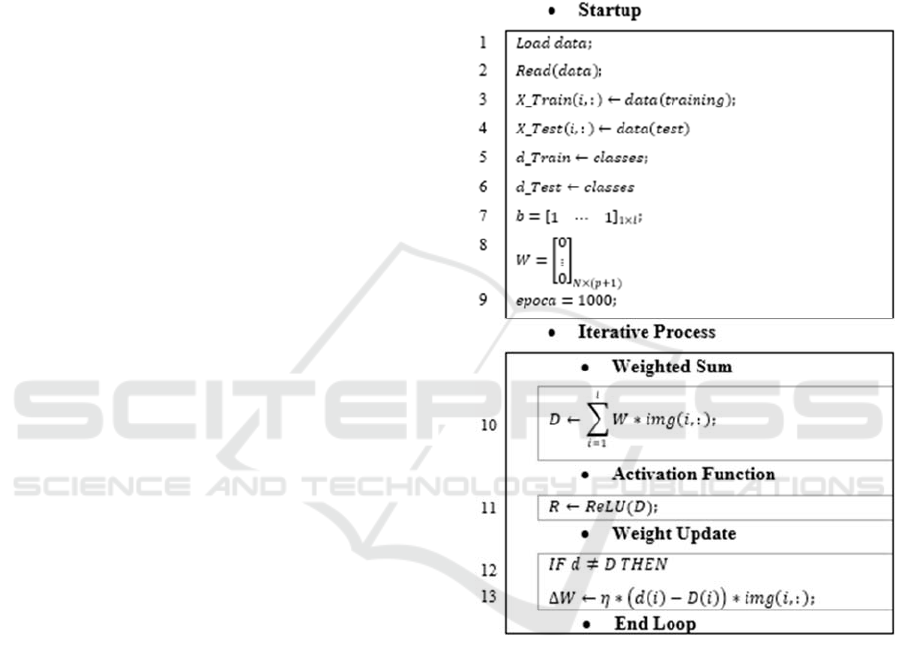
2.3.2 Artificial Neural Networks
For classification purposes, a feedforward artificial
neural network (ANN) was also implemented, which
is widely used for the classification of separable
patterns. The ANN consists of several neurons with
their synaptic weights and bias, which are processed
by the linear combiner, given by
𝑢
=
∑
𝑤
∗𝑥
,
(1)
and
𝑦
=𝜑
(
𝑢
+𝑏
)
,
(2)
where 𝑥
,𝑥
,…,𝑥
are input signals, 𝑤
,𝑤
,…,𝑤
the synaptic weights of the neuron, 𝑢
the output of
the linear combiner due to the input signals,𝑏
or low,
𝜑(. ) the activation function, and 𝑦
the output signal
of the neuron. The adjustment of synaptic weights can
be done according to the error correction learning rule
(Haykin, 2009), which is given by
𝑤
(
𝑛+1
)
=𝑤
(
𝑛
)
+𝜂
𝑑
(
𝑛
)
𝑦
(
𝑛
)
𝑥
(
𝑛
)
(3)
where 𝑤(𝑛) is the current weight and 𝑤(𝑛 + 1) the
next iteration, 𝜂 the learning rate,𝑑(𝑛)𝑦(𝑛) the
error signal, which is the difference between the
desired signal and the output of the perceptron.
The learning algorithm adopted for training the
MLP network was error backpropagation, or also
called backpropagation, which is widely used for
supervised training. The algorithm adjusts the
network weights by calculating the difference
between the value estimated by the ANN and the
observed value (HAYKIN, 2011). Algorithm 2 shows
the steps to achieve the goal, which is to classify the
images via ANN.
In the present study, the variable of interest,
denoted by D, is the presence of an oil slick on the
ocean surface. Therefore, the training targets in the
ANN output layer were defined as follows: 1 –
presence of stain and 0 – otherwise.
Algorithm 2: MLP.
Different ANN architectures are considered in this
study. The choice of the number of neurons in the
hidden layer of the network, as well as the number of
hidden layers were done through experiments, always
looking for networks with a smaller number of hidden
neurons and with a good generalization power,
reducing the problem of overfitting (overfitting).
The formation of the training and test sets for the
implementation of the ANN used the division that
already came in the database.
2.3.3 Metrics for Performance Evaluation
The classifier may present an error in its
classification, consequently, it is necessary to use the
evaluation metrics to evaluate the performance of the
obtained predicted model. Consequently, the main
Integration of Statistical Methods and Artificial Neural Networks for the Detection of Oil Stains in the Aquatic Environment
553

objective of these metrics is to measure how far the
model is from the ideal classifier (classifier that does
not present errors). The following metrics used:
accuracy, precision, recall, F1 measure, and ROC
curve.
Accuracy (𝐴𝐶) measures how many images were
correctly classified, regardless of class, so the greater
the AC, the more the predicted model approaches an
ideal classifier, and is given by the ratio between the
number of correctly classified samples and the total
number of samples, given by
𝐴
𝐶=
𝑇𝑃 + 𝑇𝑁
𝑇𝑃
+
𝐹𝑁
+
𝑇𝑁
+
𝐹𝑃
,
(4)
where 𝑇𝑃 is the true positive are images showing oil
slicks on the ocean surface (positive) that are
classified correctly, 𝑇𝑁 being true negative are
images without oil slicks (negatives) that are
classified correctly, 𝐹𝑃 the false positive which are
the images without stains that are classified as
positive and 𝐹𝑁 the false negative which are the
positive images that are classified as negative.
Precision (𝑃) is defined by the ratio between the
number of images with oil stains classified correctly
and the total number of images classified as positive,
given by
𝑃=
𝑇𝑃
𝑇𝑃
+
𝐹𝑃
.
(5)
Therefore, Equation (5) can be understood as the
number of images with oil stains that were classified
correctly.
Recall, also known as sensitivity, is defined by the
ratio between the number of images with oil stains
classified correctly and the number of images with oil
stains in the sample under study, given by
𝑟𝑒𝑐𝑎𝑙𝑙 =
𝑇𝑃
𝑇𝑃
+
𝑇𝑁
.
(6)
The F1 metric takes into account both precision
and recall, it is defined as the harmonic mean between
precision and recall, given by
𝐹1 = 2 × (𝑃 × 𝑟𝑒𝑐𝑎𝑙𝑙)/(𝑃 + 𝑟𝑒𝑐𝑎𝑙𝑙).
(7)
According to Equation (7), it is noticed that if the
precision or the recall is equal to zero or very close to
it, the F1 will be low, so the classifier model is not a
model capable of getting its predictions right.
The ROC curve (Receiver Operating
Characteristic) and the Area Under the Curve (AUC)
also built to evaluate the performance of the ANN, as
they are important tools to compare the performance
of binary classification models. The ROC curve is a
graphical representation of the performance of a
quantitative data model according to its sensitivity
rate (fraction of true positives) and the fraction of
false positives.
It is used to evaluate the ability of a classifier to
distinguish between existing classes, in addition to
allowing visual analyses between precision and recall
relative to different cut-off points, where the false
positive rate is represented on the abscissa axis and
the true positive rate is plotted on the ordinate axis.
The AUC contributes to the interpretation of the ROC
curve, because, as its name implies, it is the value of
the area under the curve, and this value varies from 0
to 1 (or from 0% to 100%), in which the value of AUC
for 1 indicates that the classifier model is great and
that it did not make a prediction error, whereas if
AUC is 0 it indicates that the model is bad and that it
misclassified all inputs.
3 RESULTS
Considering that the objective of this work is to
develop an algorithm for detection of oil slicks on the
surface of the ocean. The proposed algorithm is based
on the integration of a statistical method and an
artificial neural network, as presented in the previous
sections.
To obtain the results, the following steps are
performed. First, the acquisition of the SAR
measurements is performed. Next, the discriminant
function is computed from the training data. Finally,
the tests are carried out and the results of these two
analyses (training and test) are stored, as they will be
used as additional information in the ANN, along
with the SAR image. These results of this procedure
are presented in the rest of the section.
First, an analysis of the distribution of images was
carried out, seeking to identify similarity between the
distribution of images without oil stain and images
with oil stain. This distribution analysis contributes to
the choice of the predictive model. For this, four
images from each group were randomly selected and
the histograms of the pixels of the images were
plotted, as shown in Figures 3 and 4.
ICPRAM 2023 - 12th International Conference on Pattern Recognition Applications and Methods
554
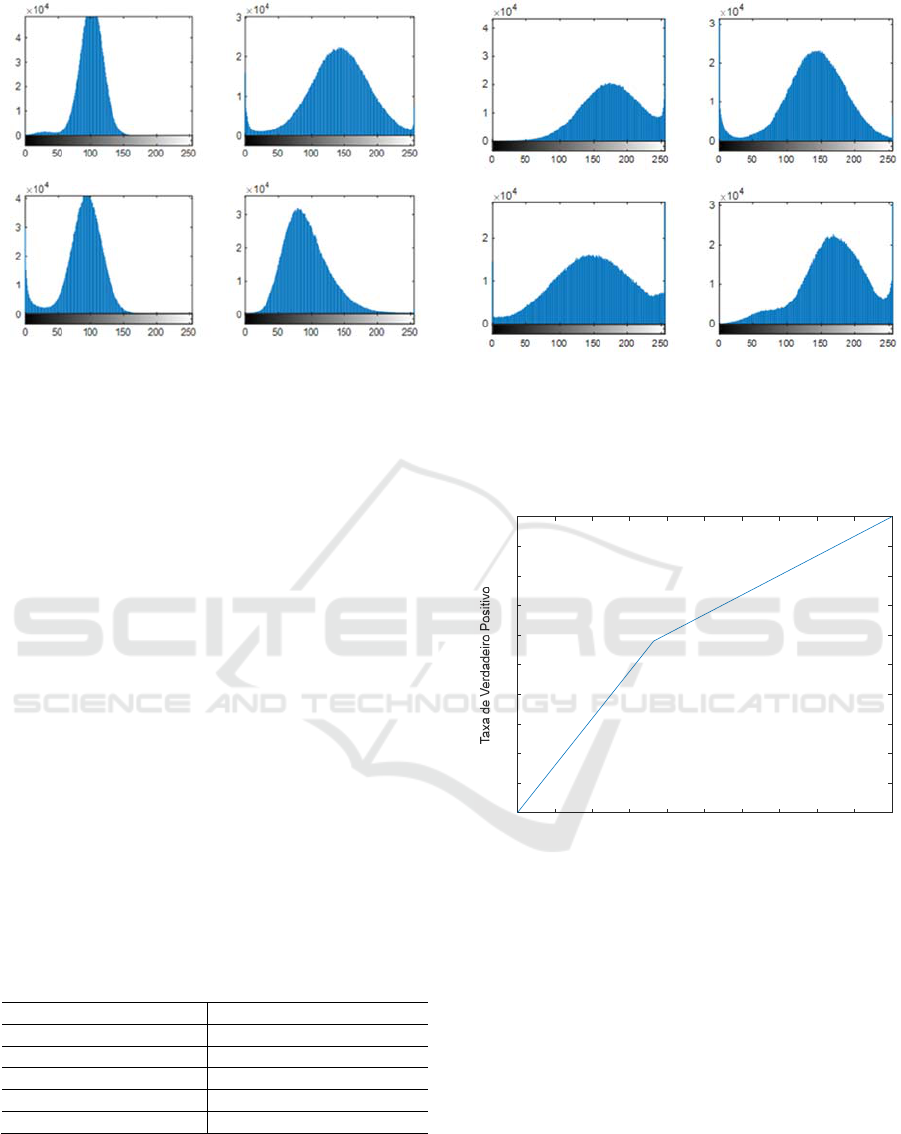
Figure 3: Pixel histogram of 4 images WITH oil stain.
According to Figure 3, the histograms of the oil
stain images also show similarity to each other, where
their peaks are close to 100, which shows that it has
more pixels in the darkest colour, close to the black
colour, and a normal distribution. When comparing
the histograms of each group, it is observed that there
is a difference between the distributions.
According to Figure 4, the histograms of the four
images without oil slicks on the ocean surface show a
similarity, where the peaks are closer to 150, that is,
there is a greater number of pixels that approach the
white colour. Another fact to be observed is that the
histograms present characteristics of a normal
distribution, which is the reference distribution for the
statistical methods used in this study.
Then, the linear discriminant function was
calculated using this training database, and the
discriminant function obtained from this database
was 100% correct, that is, it presented a true positive
rate of 100% and a false positive rate also 100%.
To verify the effectiveness of the discriminant
model, a test was performed with the test database,
which contains 110 images. The values of the
evaluation metrics are presented in Table 1.
Table 1: Test metrics with the LDA.
METRICS PERCENTAGE
Accurac
y
59.09
AUC 60.80
F1 69.39
Precision 86.44
Recall 57.95
According to Table 1, it is observed that the
discriminant function calculated from the LDA
presents a good classification, in which an accuracy
of 59.09% and a precision of 86.44%. Looking at the
Figure 4: Pixel histogram of 4 images WITHOUT oil stain.
ROC curve, and knowing that it is a graphical
technique used to assess the ability of the predictive
model to perform proper classification, Figure 5
illustrates the ROC curve for the predictive model.
Figure 5: ROC curve for the LDA.
In order to improve the classification, the
multilayer perceptron network was used to classify
the database, plus the LDA estimate added to the SAR
image database, adding more information and the
results are presented below.
The first test carried out using a multilayer
perceptron (MLP), consisting of an intermediate layer
with 6237 neurons, which are the number of
parameters of the input data, having as input only the
images, in which the training bank consists of 1002
images and the test bank consists of 110. The results
obtained for this test are shown in Table 2.
0 0.1 0.2 0.3 0.4 0.5 0.6 0.7 0.8 0.9 1
Taxa de Falso Positiv
o
0
0.1
0.2
0.3
0.4
0.5
0.6
0.7
0.8
0.9
1
pç
Integration of Statistical Methods and Artificial Neural Networks for the Detection of Oil Stains in the Aquatic Environment
555
Table 2: Training and testing metrics, input - images.
METRICS TRAINING TEST
Accurac
y
74.35 69.09
F1 62.00 70.00
Precision 75.00 71.00
Recall 74.00 69.00
According to Table 2, it is observed that the MLP
network for images as input presented better metric
values for training than for testing. In addition to
being more efficient in classifying images that report
oil spills on the ocean surface.
The second analysis performed on the MLP
network, with an intermediate layer and 6238
neurons, which is the number of parameters of the
input data with the classification obtained by the
LDA. The results obtained for this test are shown in
Table 3.
Table 3: Training and testing metrics, input - images plus
LDA rating.
METRICS TRAINING TEST
Accurac
y
99.90 65.45
F1 100.00 68.00
Precision 100.00 72.00
Recall 100.00 65.00
According to Table 3, the MLP was ideal in
training, as metrics equal to 100% were obtained, but
in the test, it presented values close to the test using
only the images as input. However, it increased
precision, and like the previous one, it was more
effective in classifying images with oil stain.
The third analysis performed on the MLP
network, with an intermediate layer and 6238
neurons, which is the number of parameters of the
input data with the value obtained by the linear
discriminant function. The results obtained for this
test are shown in Table 4.
Table 4: Training and testing metrics, input - images plus
response from the discriminant function.
METRICS TRAINING TEST
Accurac
y
78.94 63.63
F1 71.00 67.00
Precision 82.00 73.00
Recall 79.00 64.00
According to Table 4, the MLP was good in
classifying the images with oil stains, and observing
the three tests, it was concluded that the added LDA
information helped in the training and testing of the
network, presenting better values for the metrics of
evaluation.
The proposed method integrates approaches from
the multivariate analysis technique, Linear
Discriminant Analysis (LDA) and Artificial Neural
Network (ANN) to allow the detection of oil slicks on
the ocean surface, alerting if an oil spill is detected.
According to the results presented, the developed
algorithm presented a good average for the evaluation
metrics and proved to be more efficient than the
classification performed by the methods of the two
separate approaches.
4 CONCLUSIONS
In view of the growth in oil production and
transportation, techniques are needed to monitor the
aquatic environment, and to detect oil spills or leaks.
Consequently, the proposed method of integrating
statistical techniques and artificial neural networks
presents a means for detecting oil slicks on the water
surface.
This study shown the possibility of detecting oil
slicks on the surface of the aquatic environment
without the need for image segmentation, being able
to automate the detection of oil slicks on the surface
of the ocean, alerting if an oil spill is detected.
In possession of the results, the statistical
technique and artificial neural network integration
method showed greater accuracy than the separate
techniques, showing that the proposed method is
more efficient for oil stain detection than the linear
discriminant analysis methods. and multilayer
perceptron network, isolated. This algorithm,
therefore, proved to be able to be embedded in a
sensor.
Due to the integration of multivariate analysis
methods and artificial neural networks, the results
showed that the proposed method is more efficient for
oil stain detection than linear discriminant analysis
methods and multilayer perceptron network without
integration. It was observed that the integration of the
two approaches presented greater precision than the
same ones applied separately. Therefore, the
proposed methodology is satisfactory to be embedded
in a sensor node to perform local classification based
on oil spills or other types of intrusions in coastal
areas.
To continue the work and compare the proposed
method with a network that uses deep learning, a Unet
algorithm is being developed to detect the oil stain,
and the next step is the algorithm to adjust the
positioning of the sensor so that it can monitor the oil
slick.
ICPRAM 2023 - 12th International Conference on Pattern Recognition Applications and Methods
556

ACKNOWLEDGEMENTS
We thank the ANP Human Resources Program,
which financed the research, the Federal University
of Maranhão (UFMA) and its Graduate Program in
Electrical Engineering (PPGEE), CNPQ, and Higher
Education Personnel Improvement Coordination
which encouraged the study in this area of great
interest and importance technological.
REFERENCES
ANP. (2020). Agência Nacional do Petróleo, Gás Natural e
Biocombustíveis. Acesso em 25 de março de 2020,
disponível em ANP: http://www.anp.gov.br/
Brekke, C.; Solberg, A.H. Oil spill detection by satellite
remote sensing. Remote Sens. Environ. 2005, 95, 1–13.
Carlos Alberto Alves Varella. Análise Multivariada
Aplicada as Ciências Agrárias. Rio de Janeiro.
Carvalho, G. d. (2015). Multivariate Data Analysis of
Satellite-Derived Measurements to Distinguish Natural
From Man-Made Oil Slicks On The Sea Surface of
Campeche Bay (Gulf of Mexico). Rio de Janeiro,
Brasil.
CETESB. (2020). Planos de Contingência para Vazamento
de Óleo no Mar. Acesso em 09 de Abril de 2020,
disponível em CETESB: https://cetesb.sp.gov.br/
emergencias-quimicas/tipos-de-acidentes/vazamentos-
de-oleo/preparacao-para-resposta/planos-de-contingen
cia-para-vazamento-de-oleo-no-mar/.
DONGMEI SONG, Z. Z. (2020). A Novel Marine Oil
Spillage Identification Scheme Based on Convolution
Neural Network Feature Extraction From Fully
Polarimetric SAR Imagery. IEEE Access, 08, 59801 a
59820.
Hair, J. F., Black, B., Babin, B., Anderson, R. E., & Tatham,
R. L. (2009). Análise Multivariada de Dados (6 ed.).
Porto Alegre, Brasil: Bookman.
Haykin, S. (2009). Neural networks and learning machines.
Pearson.
HOTELLING, H. “Multivariate Quality Control” in
Techniques of Statistical Analysis. McGraw Hill, New
York, 1947.
Ivan Nunes da Silva; Danilo Hernane Spatti; Rogério
Andrade Flauzino (2010). Redes neurais artificiais:
para engenharia e ciências aplicadas. São Paulo:
Artliber.
Joseph F. Hair, J., Black, W. C., Babin, B. J., Anderson, R.
E., & Tatham, R. L. (2009). Análise Multivariada de
Dados (6 ed.). Porto Alegre, Brasil: Bookman.
Krestenitis, M. O. (Janeiro de 2019). Early Identification of
Oil Spills in Satellite Images Using Deep CNNs. (C.
Springer, Ed.) In International Conference on
Multimedia Modeling, 424 - 435.
Krestenitis, M. O. (2019). Oil Spill Identification from
Satellite Images Using Deep Neural Networks. Remote
Sensing, 11, 1762.
Marcelo Andreotti, R. S., Alessandro Jacoud Peixoto, J. C.
(2020). ARIEL: An Autonomous Robotic System for
Oil Spill Detection. Offshore Technology Conference.
Pereira, S. B. (2001). Investimentos em automação no
Projeto PEGASO da PETROBRAS chegam a US$ 225
milhões. Revista InTech nº 32.
Petrobras. (2020). Exploração e Produção de Petróleo e Gás.
Acesso em 08 de julho de 2020, disponível em Petrobras:
https://petrobras.com.br/pt/nossas-atividades/areas-de-
atuacao/exploracao-e-producao-de-petroleo-e-gas/.
Richard O. Duda, P. E. (2001). Pattern Classification
(Second ed.). Canada: Wiley Interscience Publication.
Selmic, R. R., Phoha, V. V., & Serwadda, A. (2016).
Wireless Sensor Networks Security, Coverage, and
Localization. USA: Springer International Publishing.
Woods, R. C. (2010). Processamento digital de imagens (3
ed.). São Paulo, Brasil: Pearson Prentice Hall.
Integration of Statistical Methods and Artificial Neural Networks for the Detection of Oil Stains in the Aquatic Environment
557
