
Heterogeneous Inertial Measurement Units in Motion Analysis
Filip Malawski
a
and Natalia Paruzel-Satława
Institute of Computer Science, AGH University of Science and Technology, Krakow, Poland
Keywords:
IMU, Motion Analysis, Accelerometer, Sensor Fusion, Heterogeneous Devices, Signal Processing.
Abstract:
Inertial measurement units are commonly used in motion analysis applications, such as sports training aid, gait
analysis, medical diagnosis, or rehabilitation assistance. Linear acceleration and orientation obtained from
sensor fusion are employed for the detection and classification of actions, as well as for measuring relevant
parameters of the motion. Typically, in multi-sensor setups, a single model of the device is used. However,
considering potential end-users, it could be beneficial to allow heterogeneous setups, particularly by including
everyday-use devices with built-in inertial sensors, such as smartwatches. In this work, we perform experi-
ments with several different sensors in order to analyze agreement in their measurements. Results indicate that
devices of different models are not directly interchangeable, however, in some applications, heterogeneous se-
tups may be viable.
1 INTRODUCTION
Inertial measurement units (IMU) measure accelera-
tion and angular velocity, as well as, in the case of
most such devices, magnetic field. Moreover, a fu-
sion of those data modalities provides an estimation
of 3D orientation, relevant for many motion analysis
applications. A number of methods for motion analy-
sis have been proposed in the literature (Lopez-Nava
and Munoz-Melendez, 2016), however it is a com-
mon practice, that the data for the experiments are
collected with homogeneous devices. From a prac-
tical point of view, a question arises - once we sub-
stitute an IMU with a different model will the pro-
posed methods work the same? Moreover, what if
we were to use a heterogeneous setup, with multi-
ple IMU models working in parallel? Recently, more
and more everyday-use devices have built-in IMUs
(e.g. smartphones, smartwatches, fitness bands). Em-
ploying those as part of a multi-sensor motion anal-
ysis system would be beneficial for the end user, as
it would reduce the number and therefore the cost of
additional devices needed to purchase in order to use
such a system. In this work, we perform a series of
experiments to verify the potential interchangeability
of different IMU sensors in motion analysis applica-
tions, including two dedicated IMU models and one
smartwatch.
a
https://orcid.org/0000-0003-0796-1253
2 RELATED WORKS
IMUs are commonly used for motion analysis in ap-
plications such as sports action recognition and eval-
uation, gait analysis, as well as rehabilitation exercise
assistance. In sports, IMUs are used in a wide range
of disciplines, both practiced indoors, such as com-
bat sports (Worsey et al., 2019a), volleyball (Wang
et al., 2018) or basketball (Ren and Wang, 2021),
and outdoors, such as rowing (Worsey et al., 2019b)
or football (Wilmes et al., 2020). Aside from event
detection and classification, depending on the disci-
pline, a number of useful motion parameters are ex-
tracted, including velocity, acceleration, cycle length,
amplitude, angular displacement, force, and others
(Camomilla et al., 2018).
Gait analysis is often a useful tool in medical di-
agnosis, including degenerative joint diseases such as
osteoarthritis (Kobsar et al., 2020), as well as neu-
rological impairments, such as Parkinson’s disease
(Tunca et al., 2017; Petraglia et al., 2019). Mea-
sured parameters include, among others, stride and
step length, cadence, speed, as well as cycle, stance,
and swing times (Teufl et al., 2018).
In rehabilitation, motion analysis with IMUs is
employed, among others, for the classification of
shoulder activities in guided treatment (Bavan et al.,
2019), detection of correct and incorrect performance
of lower limb exercises (Giggins et al., 2014), as
well as tracking specific exercises to aid stroke pa-
Malawski, F. and Paruzel-Satława, N.
Heterogeneous Inertial Measurement Units in Motion Analysis.
DOI: 10.5220/0011799100003414
In Proceedings of the 16th International Joint Conference on Biomedical Engineering Systems and Technologies (BIOSTEC 2023) - Volume 4: BIOSIGNALS, pages 351-358
ISBN: 978-989-758-631-6; ISSN: 2184-4305
Copyright
c
2023 by SCITEPRESS – Science and Technology Publications, Lda. Under CC license (CC BY-NC-ND 4.0)
351
tients (Zhou et al., 2006). Angles of joint movement
are most often of interest in rehabilitation scenarios
(Milosevic et al., 2020).
While some works show successful applications
of a single IMU sensor, e.g. for knee rehabilitation
monitoring (Bevilacqua et al., 2018) or swimming
motion analysis (Wang et al., 2019), most solutions
require a multi-sensor setup. Review papers indicate,
that there are at least several popular IMU devices,
dedicated to motion analysis, available on the market
(Petraglia et al., 2019; Milosevic et al., 2020). How-
ever, closer inspection reveals, that most of them are
high-cost, advanced devices targeted for research or
professional medical and sports applications. In this
work, we focus on relatively low-cost devices, that
are affordable for a home-use scenario. It is worth
noting, that in the referenced works, all multi-sensor
solutions employ homogeneous setups, with a single
model of IMU. While there are studies focused on
the validation of IMUs against optical systems (Roell
et al., 2019; Malawski, 2020; Clemente et al., 2022),
there’s a lack of works employing multiple different
IMUs together. In this study, we consider a heteroge-
neous setup, in which multiple different devices could
cooperate, including everyday-use equipment such as
smartwatches. To the best of our knowledge, there are
no previous works performing similar analyses.
3 METHODS
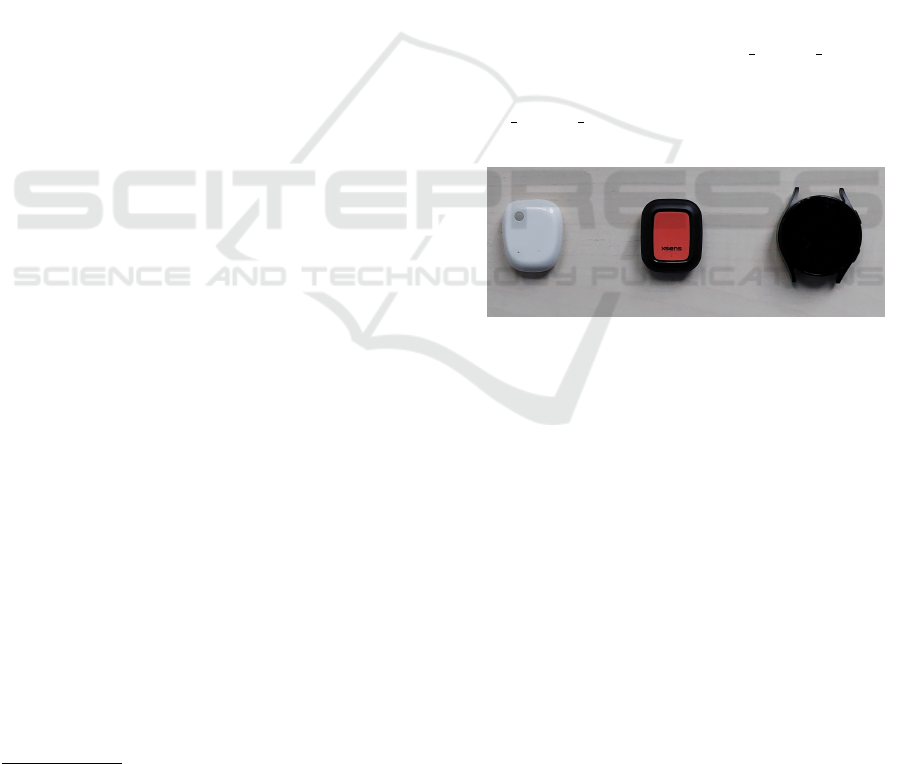
3.1 Sensors
Our goal is to compare low-cost devices, that could
be used in consumer-level applications. We employ
Xsens DOT
1
and MBientLab MeatMotionRL
2
sen-
sors, both priced approx. 100 USD per device. More-
over, we also include in our experiments Samsung
Galaxy Watch 4 smartwatch
3
, in order to verify if
everyday-use devices equipped with IMUs could be
employed in motion analysis setups as well. Em-
ployed sensors are depicted in Fig. 1.
Xsens DOT is a small (36x30x11mm) and light
(11g) device, providing measurements of orientation,
acceleration (±16g), angular velocity (±2000°/s),
and magnetic field (± 8 Gauss), either in real-time
streaming (up to 60Hz) or by recording to internal
memory (up to 120Hz). It is equipped with a BLE 5.0
communications module. MetaMotionRL sensor is a
similar device, with comparable size (36x27x10mm)
1
https://www.xsens.com/xsens-dot
2
https://mbientlab.com/store/metamotionrl-p/
3
https://www.samsung.com/us/watches/galaxy-watch4/
and weight (8.5g), providing the same set of informa-
tion, however in a more configurable manner. Avail-
able accelerometer ranges span from ±2g to ±16g,
gyroscope ranges span from ±125°/s to ±2000°/s and
magnetometer is fixed at ±13 Gauss for x and y axes
and ±25 Gauss for z axis. Acceleration, angular ve-
locity, and orientation can be streamed in real-time
at 100Hz, or logged with 800Hz. MetaMotionRL
is equipped with older BLE 4.0. Both sensors have
APIs available for multiple programming languages,
supporting both desktop and mobile development of
applications. As for the Samsung Galaxy Watch 4
(40x40x10mm, 26g), very little information is pro-
vided regarding the built-in IMU. Acceleration, an-
gular velocity, magnetic field, and orientation are all
available through Android API, as the smartwatch
runs on Wear OS - a version of Android dedicated
to wearable devices. The sampling frequency is not
given explicitly, although experiments indicate that it
is possible to obtain data with as much as 100Hz fre-
quency using Android’s SENSOR DELAY FASTEST
setting. However, due to large fluctuations of sam-
pling times, it seems more reasonable to use SEN-
SOR DELAY GAME setting, which effectively results
in a 50Hz sampling rate.
Figure 1: Sensors used in the experiments, left to right:
MBientLab MetaMotionRL, Xsens DOT, Samsung Galaxy
Watch 4.
3.2 Acquisition
In our experiments, we employ a total of four sen-
sors: two Xsens DOT devices, one MetaMotionRL,
and one Galaxy Watch 4. This allows us to measure
and compare the similarity of signals acquired with
sensors of the same model, and of different models.
In order to obtain comparable measurements of the
same motion, the sensors are mounted on top of each
other, along the shorter z-axis, with separation layers
made of technical foam, and strong non-elastic tape
used to hold them together. Therefore, all sensors
are moved as a single bundle. All devices are cali-
brated as indicated by their producers. For the Xsens
DOT, we use acquisition software provided with the
sensors, for the MetaMotionRL we use custom soft-
ware employing programming libraries provided with
the sensor, and for the Galaxy Watch 4 we use custom
BIOSIGNALS 2023 - 16th International Conference on Bio-inspired Systems and Signal Processing
352
Android-based software.
We consider two experimental scenarios. In the
first one, we focus on acceleration in linear motion.
The sensor bundle is moved, separately, in three direc-
tions (left-right, up-down, forward-backward), with-
out rotations. The sequence is repeated three times
with different speeds, to collect data points in vari-
ous parts of the available measurement range. We
record so-called linear acceleration, which is accel-
eration with removed gravity - all employed devices
have a built-in capability of such filtering.
The second scenario is focused on orientation.
The sensor bundle is rotated, in two directions, in
half-circle arcs with a radius of approx. 50cm. The
motion is repeated at 3 different speeds. We record
Euler angles, provided by each sensor’s built-in fu-
sion algorithm, as those are easier to interpret than
quaternions. Fusion makes use of all raw signals -
acceleration, angular velocity, and magnetic field.
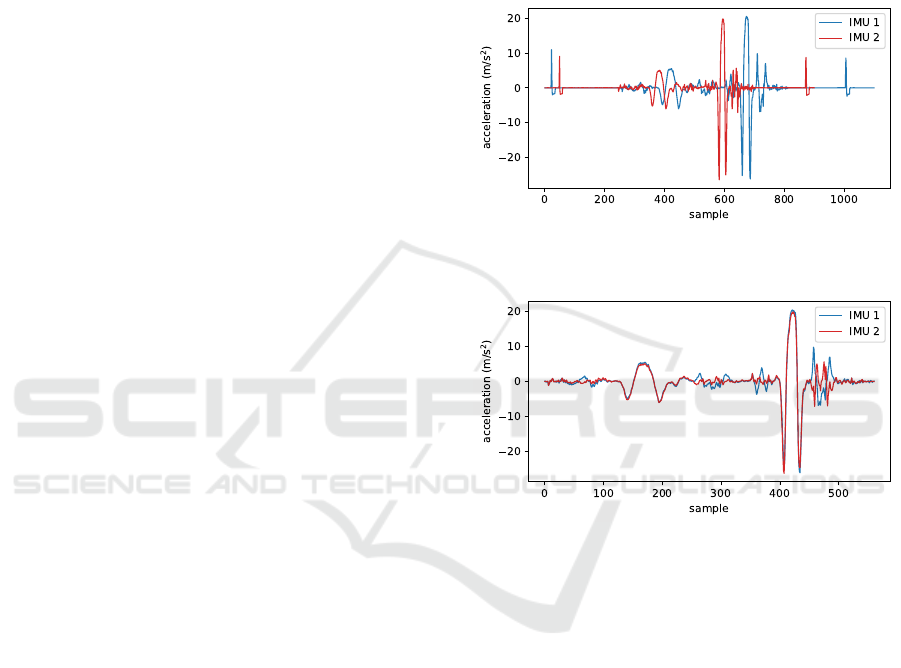
3.3 Synchronization
Synchronization of data is one of the key require-
ments in a multi-sensor setup. This is typically
done by synchronizing internal clocks and then pro-
viding a timestamp for each measured data point
(Khediri et al., 2012). Both Xsens DOT and Meta-
MotionRL sensors have built-in synchronization pro-
tocols, which could be employed in a homogeneous
setup. For heterogeneous setup, implementing clock
synchronization on multi-vendor devices would re-
quire low-level programming of acquisition software
for each device. Instead, for our experiments, we
employ signal-based synchronization, which handles
clock drift between sensors using the acquired data,
rather than communication between devices. Each
recording is started with the sensor bundle in a sta-
tionary position, then a short-term force is applied (a
single push), then for a few seconds the sensors are
left stationary again, then the actual movement for the
experiments starts. At the end of each recording sim-
ilar protocol is followed (a single push with no move-
ment before and after). A single push is easily iden-
tified as a single peak in the acceleration signal (see
Fig. 2 - first and last peak of each signal). Therefore,
we can synchronize the data from all sensors, by se-
lecting only fragments between the first and the last
peak, with a given threshold for the peak height.
This procedure ensures, that in the trimmed data,
the start and end time points are the same for each sen-
sor. However, we still need to address different sam-
pling rates and spacing of the timestamps. DOT and
MetaMotionRL provide data points evenly distributed
in time, however, Android API does not. Therefore,
data points for Galaxy Watch 4 were determined in
evenly distributed time points by taking the weighted
average of the nearest measured data points. In order
to obtain a common sampling rate, we resample the
MetaMotionRL and Galaxy Watch 4 data to 60Hz,
which is native to the DOT sensors. Finally, we re-
move leading and trailing close-to-zero signal frag-
ments, which result from maintaining a stationary po-
sition near the synchronization peaks (see Fig. 3).
Figure 2: Acceleration (single axis) acquired at the same
time with two different IMUs - before synchronization.
Figure 3: Acceleration (single axis) acquired at the same
time with two different IMUs - after synchronization.
3.4 Processing
For better comparison of the sensors, we apply pro-
cessing to the raw acquired data. The acceleration sig-
nal is very noisy, therefore it is a common approach to
apply filtering methods to the raw data. We decided to
use basic running average filtering with window size
7, in order to make the signals easier to compare on
the plots representing values in time. Running aver-
age results in low-pass filtering, which in this case is
desirable, as high frequencies correspond mostly to
noise, and lower frequencies correspond to actual ac-
tions performed in the experiments.
In the case of orientation, Euler angles are pro-
vided in the range (-180°, 180°). Once the device is
rotated outside of this range (less than -180° or more
than 180°) the fusion algorithm returns an equivalent
value inside the range, e.g. -175° instead of 185° (see
the raw signal in Fig. 4). This makes it difficult to
Heterogeneous Inertial Measurement Units in Motion Analysis
353
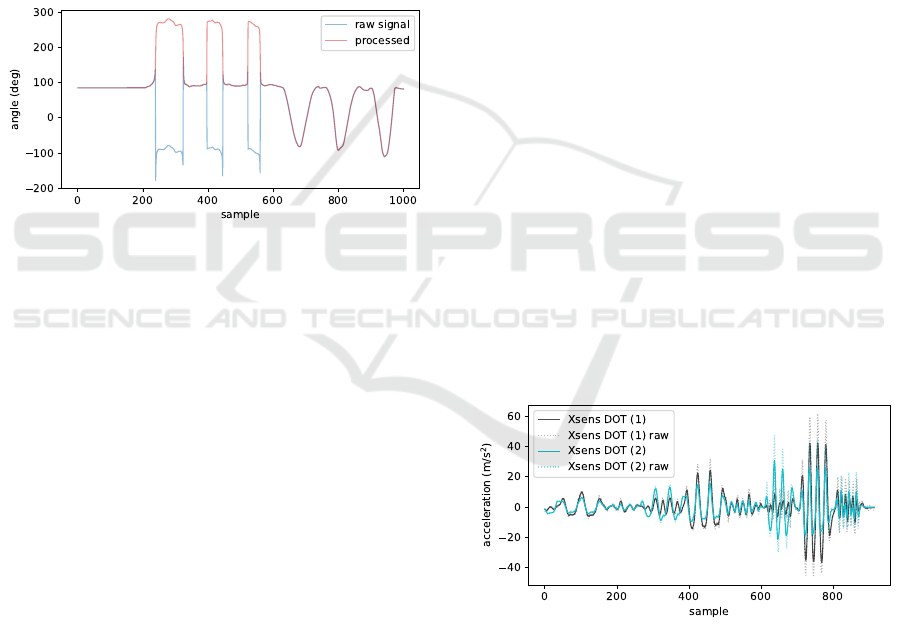
analyze such data, as large numeric differences be-
tween values in two signals may actually represent a
very small difference in measurement, e.g. 179° vs.
-179° is in fact just 2° of difference, not 358°. For
this reason, we apply dedicated processing in the ori-
entation experiments. In each signal, we search for
data points in which the transition between the end of
the positive and the start of the negative range occurs.
These are easy to find as high peaks in the difference
of consecutive values. In segments located between
such data points, we add the full range (360°) to the
recorded values. Therefore, we obtain continuous sig-
nals (see. processed data in Fig. 4). We additionally
apply running average filtering, with windows size 7,
to remove unwanted peaks that may still occur near
the transition points.
Figure 4: Raw and processed orientation data (single axis).
3.5 Metrics
As the first indication of similarity between signals
from different devices, we analyze plots represent-
ing measured values in time. We compare against
the first Xsens sensor, denoted as DOT (1), all other
sensors: the second Xsens device, denoted as DOT
(2), the MetaMotionRL sensor, and the Galaxy Watch
4. Then, we measure the numeric difference of mea-
surements in corresponding time points. For the ori-
entation data, we consider point-by-point differences
(60Hz sampling). Acceleration data, however, even
after employing running average filtering, remains too
noisy to be directly compared. Instead, for numerical
analysis, we compute the mean value of the raw signal
in time windows of size 16, and overlap of half win-
dow length. This corresponds to the common tech-
nique of extracting time-domain features from the ac-
celeration data (O’Reilly et al., 2018). We then mea-
sure the difference between values computed in the
corresponding windows.
The mean and the standard deviation of difference
are computed and presented as numerical results. We
also include Bland-Altman plots, in which the dif-
ference between two paired measurements is plotted
against their mean. Bland-Altman plots are com-
monly used to depict agreement between different
measurement methods. For normally distributed data
agreement limits (dashed horizontal lines) are typi-
cally set to 1.96 of standard deviation, to include 95%
of data points. In our experiments, the differences are
not normally distributed (based on the Shapiro-Wilk
test), therefore we compute agreement limits specifi-
cally to contain 95% of data points (per each signal-
to-signal comparison).
4 EXPERIMENTS
Performed experiments included the two scenarios
described in Section 3.2, focusing on measurements
of 1) acceleration in linear motion and 2) orientation.
Agreement between multiple repetitions of motion in
the same scenario was not considered in this work.
The duration of acquired signals was approx. 15 sec-
onds.
4.1 Linear Acceleration
For brevity, we present filtered signal comparison in
the x-axis only, including DOT (1) vs. DOT (2) (Fig.
5), DOT (1) vs. MetaMotionRL (Fig. 6) and DOT (1)
vs. Galaxy Watch 4 (Fig. 7). Raw signals are addi-
tionally depicted with half-opacity dotted lines to in-
dicate the impact of the running average filtering. The
Bland-Altman plot (Fig. 8) includes data points from
all axes. Each comparison (sensor pair) is indicated
with a different color.
Figure 5: Linear acceleration, x-axis, Xsens DOT (1) vs.
Xsens DOT (2).
Visual inspection of linear acceleration values in
time indicates that signals are generally well-aligned
in terms of peaks occurring at the same time points.
However, the magnitude of peaks varies, particularly
in data fragments with fast motion. This can be ob-
served in all comparisons - between the same device
model (Fig. 5), as well as with different models (Fig.
6 and 7). Numerical results (Tab. 1), as well as
BIOSIGNALS 2023 - 16th International Conference on Bio-inspired Systems and Signal Processing
354
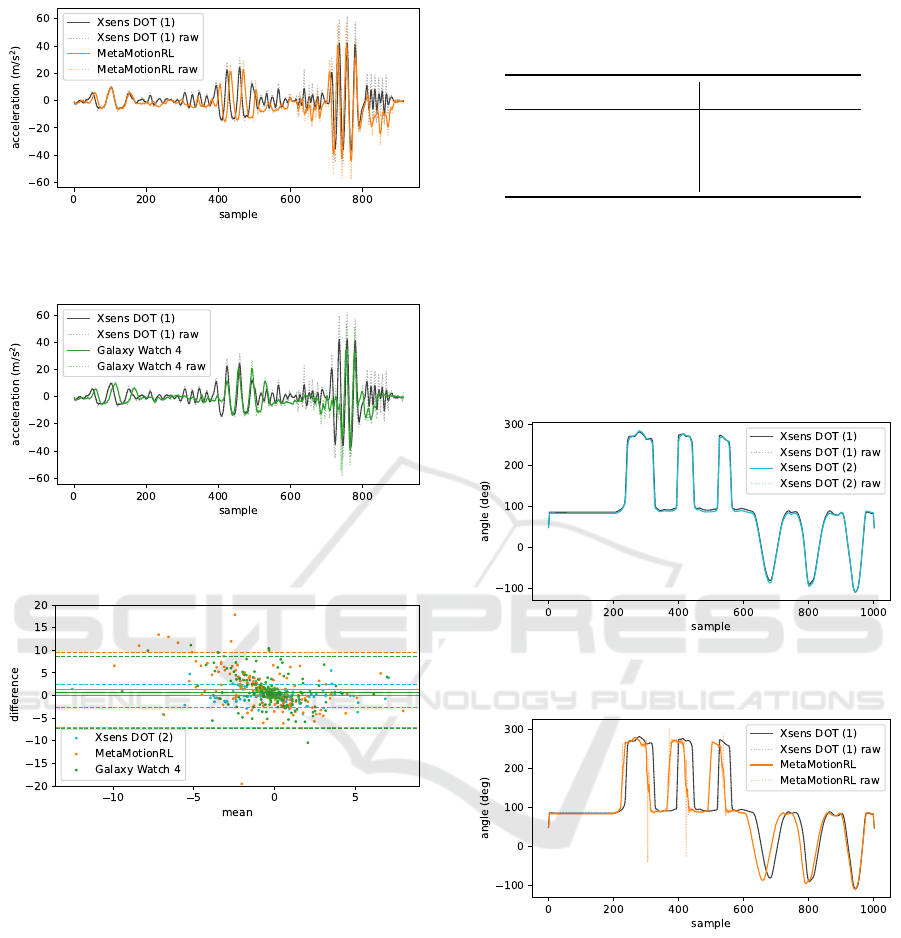
Figure 6: Linear acceleration, x-axis, Xsens DOT (1) vs.
MetaMotionRL.
Figure 7: Linear acceleration, x-axis, Xsens DOT (1) vs.
Galaxy Watch 4.
Figure 8: Bland-Altman plot representing agreement in
measurements of linear acceleration (in time windows), all
axes, Xsens DOT (1) vs. all other sensors.
the Bland-Altman plot (Fig. 8), indicate that there
is much better agreement between measurements per-
formed with devices of the same model. Considering
the two other devices, the mean difference from val-
ues measured with the baseline sensor is better in the
case of Galaxy Watch 4 (0.65m/s
2
) than in the case
of MetaMotionRL (1.27m/s
2
). On the other hand,
the standard deviation is very similar (4.21m/s
2
and
4.09m/s
2
respectively) and so are the agreement lim-
its including 95% of data points (see Fig.8).
4.2 Orientation
Similarly, as in the case of linear acceleration, we
present signal comparison only in the x-axis to keep
Table 1: Mean and standard deviation values of differ-
ence in measuring linear acceleration (m/s
2
) between Xsens
DOT (1) and all other sensors, computed in time windows.
Sensor Mean Std
Xsens DOT (2) -0.05 1.28
MetaMotionRL 1.27 4.21
Galaxy Watch 4 0.65 4.09
this section concise. We include orientation data for
DOT (1) vs. DOT (2) (Fig. 9), DOT (1) vs. MetaMo-
tionRL (Fig. 10), and DOT (1) vs. Galaxy Watch
4 (Fig. 11). Raw signals are depicted with half-
opacity dotted lines. Numerical results (Tab. 2) and
the Bland-Altman plot (Fig. 12) include data from the
x-axis only. An additional close-up view of a smaller
range is depicted in Fig. 13.
Figure 9: Orientation, x-axis, Xsens DOT (1) vs. Xsens
DOT (2).
Figure 10: Orientation, x-axis, Xsens DOT (1) vs. Meta-
MotionRL.
In the plots depicting orientation value in time we
can observe, that alignment with the baseline DOT
(1) sensor data is near perfect for both DOT (2) and
Galaxy Watch 4 devices (Fig. 9 and 11). However,
it is worth noting, that the Galaxy Watch 4 requires
running average filtering, as the raw data have some
undesirable peaks, while DOT (2) provides a smooth
signal by itself. MetaMotionRL sensor produces sim-
ilar peaks as the other devices, although some of them
are shifted in time (Fig. 10). This is most likely due
to different sensor fusion algorithms - there is always
Heterogeneous Inertial Measurement Units in Motion Analysis
355
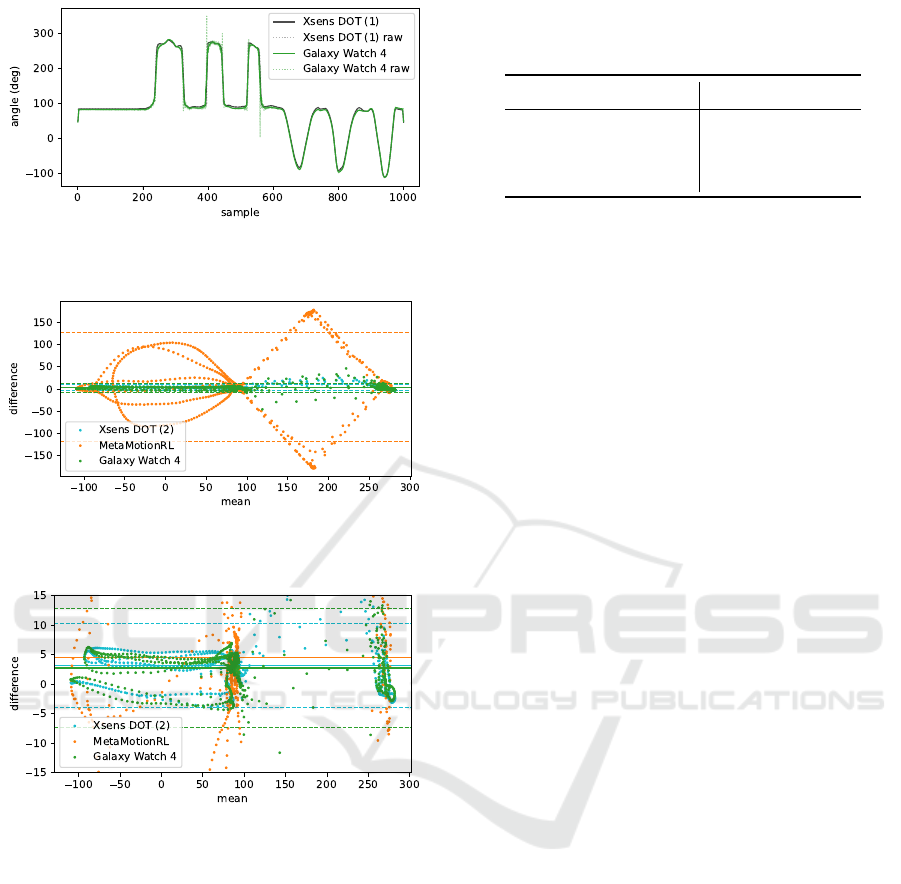
Figure 11: Orientation, x-axis, Xsens DOT (1) vs. Galaxy
Watch 4.
Figure 12: Bland-Altman plot of orientation, x-axis, Xsens
DOT (1) vs. other sensors, full range.
Figure 13: Bland-Altman plot of orientation, x-axis, Xsens
DOT (1) vs. other sensors, selected range.
a trade-off between accuracy and delay in comput-
ing orientation from the noisy, raw, multi-modal sig-
nals. Please note, that in this work we do not eval-
uate which device has better consistency with a gold
standard measurement, but rather measure agreement
between the sensors, therefore we do not conclude
which data is more correct.
Results in Tab. 2, as well as the close-up of the
Bland-Altman plot (Fig. 13) also indicate very good
agreement between DOT (1) and both DOT (2) and
Galaxy Watch 4 sensors. The latter has a lower mean
difference (2.75° vs. 3.18°), but a higher standard de-
viation (5.11° vs. 3.64°). MetaMotionRL has a very
high standard deviation of difference (62.10°), as a
result of the observed time shift. However, the mean
difference (4.52°) is comparable with the other sen-
Table 2: Mean and standard deviation values of difference
in measuring orientation (degrees) between Xsens DOT (1)
and all other sensors.
Sensor Mean Std
Xsens DOT (2) 3.18 3.64
MetaMotionRL 4.52 62.10
Galaxy Watch 4 2.75 5.11
sors, due to the circular nature of the motion. The
time shift is also well visible on the full-range Bland-
Altman plot (Fig. 12).
4.3 Discussion
Based on the obtained results, we can conclude that in
the case of linear acceleration, we cannot easily sub-
stitute one model of IMU with another, as measure-
ments will differ. Depending on the application, these
differences may be less or more significant. In partic-
ular, when relatively slow motion is considered, mea-
surements seem to be more consistent. In applications
including very dynamic motion, such as some sports
disciplines, a per-sensor adaptation of data process-
ing methods may be required, to compensate for the
difference in measurements. On the other hand, for
scenarios with less dynamic motion, such as daily ac-
tivity recognition, those differences may be insignif-
icant. While recording actual actions was out of the
scope of this work, it would be interesting to compare
differences between sensors to differences between
subjects in the context of the type of performed mo-
tion. It is also worth noting that both a dedicated IMU
(MetaMotionRL) and a smartwatch (Galaxy Watch 4)
have a very similar agreement with the baseline DOT
sensor.
Interestingly, considering orientation, measure-
ments from the smartwatch are much more consis-
tent with the baseline, than the MetaMotionRL IMU.
We expect that, in terms of orientation, Galaxy Watch
4 could be directly used with motion analysis algo-
rithms developed using the DOT sensors. On the
other hand, the time shift occurring between the DOT
and MetaMotionRL data may be difficult to compen-
sate for. Using a custom fusion algorithm instead
of the provided one could be considered. Some ap-
plications may not require very dynamic measure-
ments of orientation, e.g. rehabilitation exercises are
usually performed relatively slowly, therefore precise
synchronization in time may be less relevant than the
range of motion.
BIOSIGNALS 2023 - 16th International Conference on Bio-inspired Systems and Signal Processing
356

5 CONCLUSIONS
In this work, we performed experiments to analyze
the agreement between measurements obtained with
the same and different models of IMUs. We in-
cluded dedicated inertial sensors as well as a common
model of a smartwatch. Results indicate, that while
the agreement is relatively good, it is not sufficient
to simply substitute a device with another model or
use a heterogeneous setup without additional consid-
eration. However, in some applications, with proper
adaptation, using multiple different sensors could be
a viable solution. More importantly, from a practi-
cal point of view, employing an everyday-use device
such as a smartwatch is just as good (or even better)
as using another model of IMU. Discrepancies be-
tween measurements obtained with different devices
are more significant in dynamic motion. Therefore, in
scenarios such as analyzing fast, sports actions it may
be necessary to calibrate motion analysis methods per
device.
In terms of future work, it would be beneficial to
verify the repeatability of measurements per device,
as well as perform experiments with additional de-
vices. We also consider comparing signals from dif-
ferent sensors as inputs to machine learning meth-
ods for action detection or classification. Such ex-
periments would include multiple subjects. Training
machine learning models on one set of sensors and
testing on another would be a good indication of the
viability of heterogeneous setups in practical scenar-
ios.
ACKNOWLEDGEMENTS
The research presented in this paper was supported
by the National Centre for Research and Develop-
ment (NCBiR) under Grant No. LIDER/37/0198/L-
12/20/NCBR/2021.
REFERENCES
Bavan, L., Surmacz, K., Beard, D., Mellon, S., and Rees, J.
(2019). Adherence monitoring of rehabilitation exer-
cise with inertial sensors: A clinical validation study.
Gait & posture, 70:211–217.
Bevilacqua, A., Huang, B., Argent, R., Caulfield, B., and
Kechadi, T. (2018). Automatic classification of knee
rehabilitation exercises using a single inertial sensor:
A case study. In 2018 IEEE 15th International Con-
ference on Wearable and Implantable Body Sensor
Networks (BSN), pages 21–24. IEEE.
Camomilla, V., Bergamini, E., Fantozzi, S., and Vannozzi,
G. (2018). Trends supporting the in-field use of wear-
able inertial sensors for sport performance evaluation:
A systematic review. Sensors, 18(3):873.
Clemente, F., Badicu, G., Hassan, U., Akyildiz, Z., Pino-
Ortega, J., Silva, R., and Rico-Gonz
´
alez, M. (2022).
Validity and reliability of inertial measurement units
for jump height estimations: a systematic review. Hu-
man Movement, 23(4):1–20.
Giggins, O. M., Sweeney, K. T., and Caulfield, B. (2014).
Rehabilitation exercise assessment using inertial sen-
sors: a cross-sectional analytical study. Journal of
neuroengineering and rehabilitation, 11(1):1–10.
Khediri, S. e., Nasri, N., Samet, M., Wei, A., and Kachouri,
A. (2012). Analysis study of time synchronization
protocols in wireless sensor networks. arXiv preprint
arXiv:1206.1419.
Kobsar, D., Masood, Z., Khan, H., Khalil, N., Kiwan, M. Y.,
Ridd, S., and Tobis, M. (2020). Wearable inertial sen-
sors for gait analysis in adults with osteoarthritis—a
scoping review. Sensors, 20(24):7143.
Lopez-Nava, I. H. and Munoz-Melendez, A. (2016). Wear-
able inertial sensors for human motion analysis: A re-
view. IEEE Sensors Journal, 16(22):7821–7834.
Malawski, F. (2020). Depth versus inertial sensors in real-
time sports analysis: a case study on fencing. IEEE
Sensors Journal, 21(4):5133–5142.
Milosevic, B., Leardini, A., and Farella, E. (2020). Kinect
and wearable inertial sensors for motor rehabilitation
programs at home: state of the art and an experimental
comparison. Biomedical engineering online, 19(1):1–
26.
O’Reilly, M., Caulfield, B., Ward, T., Johnston, W., and Do-
herty, C. (2018). Wearable inertial sensor systems for
lower limb exercise detection and evaluation: a sys-
tematic review. Sports Medicine, 48(5):1221–1246.
Petraglia, F., Scarcella, L., Pedrazzi, G., Brancato, L.,
Puers, R., and Costantino, C. (2019). Inertial sensors
versus standard systems in gait analysis: a systematic
review and meta-analysis. European journal of physi-
cal and rehabilitation medicine, 55(2):265–280.
Ren, H. and Wang, X. (2021). Application of wearable
inertial sensor in optimization of basketball player’s
human motion tracking method. Journal of Ambient
Intelligence and Humanized Computing, pages 1–15.
Roell, M., Mahler, H., Lienhard, J., Gehring, D., Gollhofer,
A., and Roecker, K. (2019). Validation of wearable
sensors during team sport-specific movements in in-
door environments. Sensors, 19(16):3458.
Teufl, W., Lorenz, M., Miezal, M., Taetz, B., Fr
¨
ohlich,
M., and Bleser, G. (2018). Towards inertial sen-
sor based mobile gait analysis: Event-detection and
spatio-temporal parameters. Sensors, 19(1):38.
Tunca, C., Pehlivan, N., Ak, N., Arnrich, B., Salur, G.,
and Ersoy, C. (2017). Inertial sensor-based robust gait
analysis in non-hospital settings for neurological dis-
orders. Sensors, 17(4):825.
Wang, Y., Zhao, Y., Chan, R. H., and Li, W. J. (2018). Vol-
leyball skill assessment using a single wearable mi-
Heterogeneous Inertial Measurement Units in Motion Analysis
357

cro inertial measurement unit at wrist. IEEE Access,
6:13758–13765.
Wang, Z., Shi, X., Wang, J., Gao, F., Li, J., Guo, M., Zhao,
H., and Qiu, S. (2019). Swimming motion analy-
sis and posture recognition based on wearable inertial
sensors. In 2019 IEEE International Conference on
Systems, Man and Cybernetics (SMC), pages 3371–
3376. IEEE.
Wilmes, E., de Ruiter, C. J., Bastiaansen, B. J., Zon, J. F. v.,
Vegter, R. J., Brink, M. S., Goedhart, E. A., Lemmink,
K. A., and Savelsbergh, G. J. (2020). Inertial sensor-
based motion tracking in football with movement in-
tensity quantification. Sensors, 20(9):2527.
Worsey, M. T., Espinosa, H. G., Shepherd, J. B., and Thiel,
D. V. (2019a). Inertial sensors for performance anal-
ysis in combat sports: A systematic review. Sports,
7(1):28.
Worsey, M. T., Espinosa, H. G., Shepherd, J. B., and Thiel,
D. V. (2019b). A systematic review of performance
analysis in rowing using inertial sensors. Electronics,
8(11):1304.
Zhou, H., Hu, H., and Harris, N. (2006). Application of
wearable inertial sensors in stroke rehabilitation. In
2005 IEEE Engineering in Medicine and Biology 27th
Annual Conference, pages 6825–6828. IEEE.
BIOSIGNALS 2023 - 16th International Conference on Bio-inspired Systems and Signal Processing
358
