
Optimising Evolution of SA-UNet for Iris Segmentation
Mahsa Mahdinejad
1 a
, Aidan Murphy
2 b
, Patrick Healy
1 c
and Conor Ryan
1 d
1
University of Limerick, Limerick, Ireland
2
University College Dublin, Dublin, Ireland
Keywords:
Deep Learning, Evolutionary Algorithms, Genetic Algorithm, Image Segmentation.
Abstract:
Neuroevolution is the process of building or enhancing neural networks through the use of an evolutionary al-
gorithm. An improved model can be defined as improving a model’s accuracy or finding a smaller model with
faster training time with acceptable performance. Neural network hyper-parameter tuning is costly and time-
consuming and often expert knowledge is required. In this study we investigate various methods to increase
the performance of evolution, namely, epoch early stopping, using both improvement and threshold valida-
tion accuracy to stop training bad models, and removing duplicate models during the evolutionary process.
Our results demonstrated the creation of a smaller model, 7.3M, with higher accuracy, 0.969, in comparison
to previously published methods. We also benefit from an average time saving of 59% because of epoch
optimisation and 51% from the removal of duplicated individuals, compared to our prior work.
1 INTRODUCTION
In an artificial neural network (ANN), hyper-
parameters are parameters whose values control the
learning process and need to be tuned manually.
Some hyper-parameters are used to construct the
building blocks of NN, while others, such as epoch
and batch-size, must be set for the training process.
Choosing the number of epochs is just as impor-
tant as the other hyper-parameters. Training a model
with many epochs can result in over-fitting and wasted
computational time, whilst insufficient epochs might
result in an underfit model. Therefore, different tech-
niques have been suggested, which can automatically
detect when a model has begun to overfit, increasing
error (Lodwich et al., 2009; Lodwich et al., 2009;
Prechelt, 1998a). Early stopping is a technique that
allows one to train the model with so many epochs un-
til stopping requirements are seen (Prechelt, 1998b).
In this paper, we segment images using convolu-
tional neural network (CNN) models (LeCun et al.,
1995) to identify abnormalities in diabetics’ iris blood
vessels. Damage and swelling of blood vessels in
the eye are the primary culprits of diabetic retinopa-
thy (DR), a form of blindness brought on by dia-
a
https://orcid.org/0000-0003-4288-3991
b
https://orcid.org/0000-0002-6209-4642
c
https://orcid.org/0000-0002-3824-7442
d
https://orcid.org/0000-0002-7002-5815
betes (Ciulla et al., 2003). To explore retinal issues
and diagnose DR, specialists are increasingly adopt-
ing image processing and machine learning technolo-
gies (Winder et al., 2009). The availability of pow-
erful supercomputers for training larger and more
complicated CNNs has resulted in their success in a
broader range of image-processing tasks. However,
this progress has come with the increasing complexity
of CNN models. Many common CNN designs require
hundreds of GPU hours to train correctly. As a result,
creating and experimenting with CNN architectures,
as well as selecting the optimal hyper-parameters for
a specific job, is becoming increasingly complicated.
To tackle this issue, we apply an evolutionary tech-
nique to find acceptable CNN architectures and pa-
rameters automatically. Specifically, we use a genetic
algorithm (GA) (Holland, 1975) to train a CNN to
handle a retinal blood vessel segmentation task accu-
rately. Using evolutionary algorithms to create effi-
cient and high-performance CNN offers numerous ad-
vantages since it is expensive and time-consuming to
manually tune a CNN to get acceptable performance.
Therefore a new approach is required to detect and
implement early stopping. We investigate techniques
such as epoch threshold and epoch early stopping to
reduce training time.
Duplicate individuals waste training time by train-
ing the same individual many times, a commonly-
occurring problem in evolutionary algorithms. We
Mahdinejad, M., Murphy, A., Healy, P. and Ryan, C.
Optimising Evolution of SA-UNet for Iris Segmentation.
DOI: 10.5220/0011798600003393
In Proceedings of the 15th International Conference on Agents and Artificial Intelligence (ICAART 2023) - Volume 3, pages 901-908
ISBN: 978-989-758-623-1; ISSN: 2184-433X
Copyright
c
2023 by SCITEPRESS – Science and Technology Publications, Lda. Under CC license (CC BY-NC-ND 4.0)
901
have also encountered this problem throughout the
evolutionary process in prior work (Popat et al., 2020;
Houreh et al., 2021; Mahdinejad. et al., 2022). In con-
trast to previous work we are now able to run more
models which lead us to achieve a smaller size and
better accuracy when compared to our earlier works
and a base model.
In Section 2, we outline the history of our method-
ologies. The experimental setup is detailed in Sec-
tion 3, and results are reported in Section 4. Finally,
in Section 5, we give our findings and future work.
2 BACKGROUND
2.1 Convolutional Neural Networks
CNNs have made achievements in a variety of pattern
recognition areas, ranging from image processing to
voice recognition, throughout the past decade. CNNs
have the greatest advantage of reducing the num-
ber of parameters compared to traditional ANNs (Al-
bawi et al., 2017). This achievement has encouraged
both academics and developers to examine larger
and larger models in order to address difficult prob-
lems that were previously impossible to solve with
regular ANNs. Convolutional layers, pooling lay-
ers, and fully connected layers are the three main
layers which are common in almost all CNN mod-
els. Batch-Normalization (BN) and DropOut are two
other techniques which help the performance of a
model. BN enables the network’s layers to learn more
independently and, consequently, learning becomes
more effective when it is applied; it may also be
used as regularization to prevent model over-fitting.
DropOut (Baldi and Sadowski, 2013) is a regulariza-
tion method used to prevent model over-fitting, too.
DropOut is used temporarily to randomly turn off the
network’s neurons. Neurons can be turned off so that
they don’t learn anything new or contribute any in-
formation, leaving the remaining active neurons to
work harder to learn and decrease errors. A neu-
ron’s shutting down probability is called the dropout
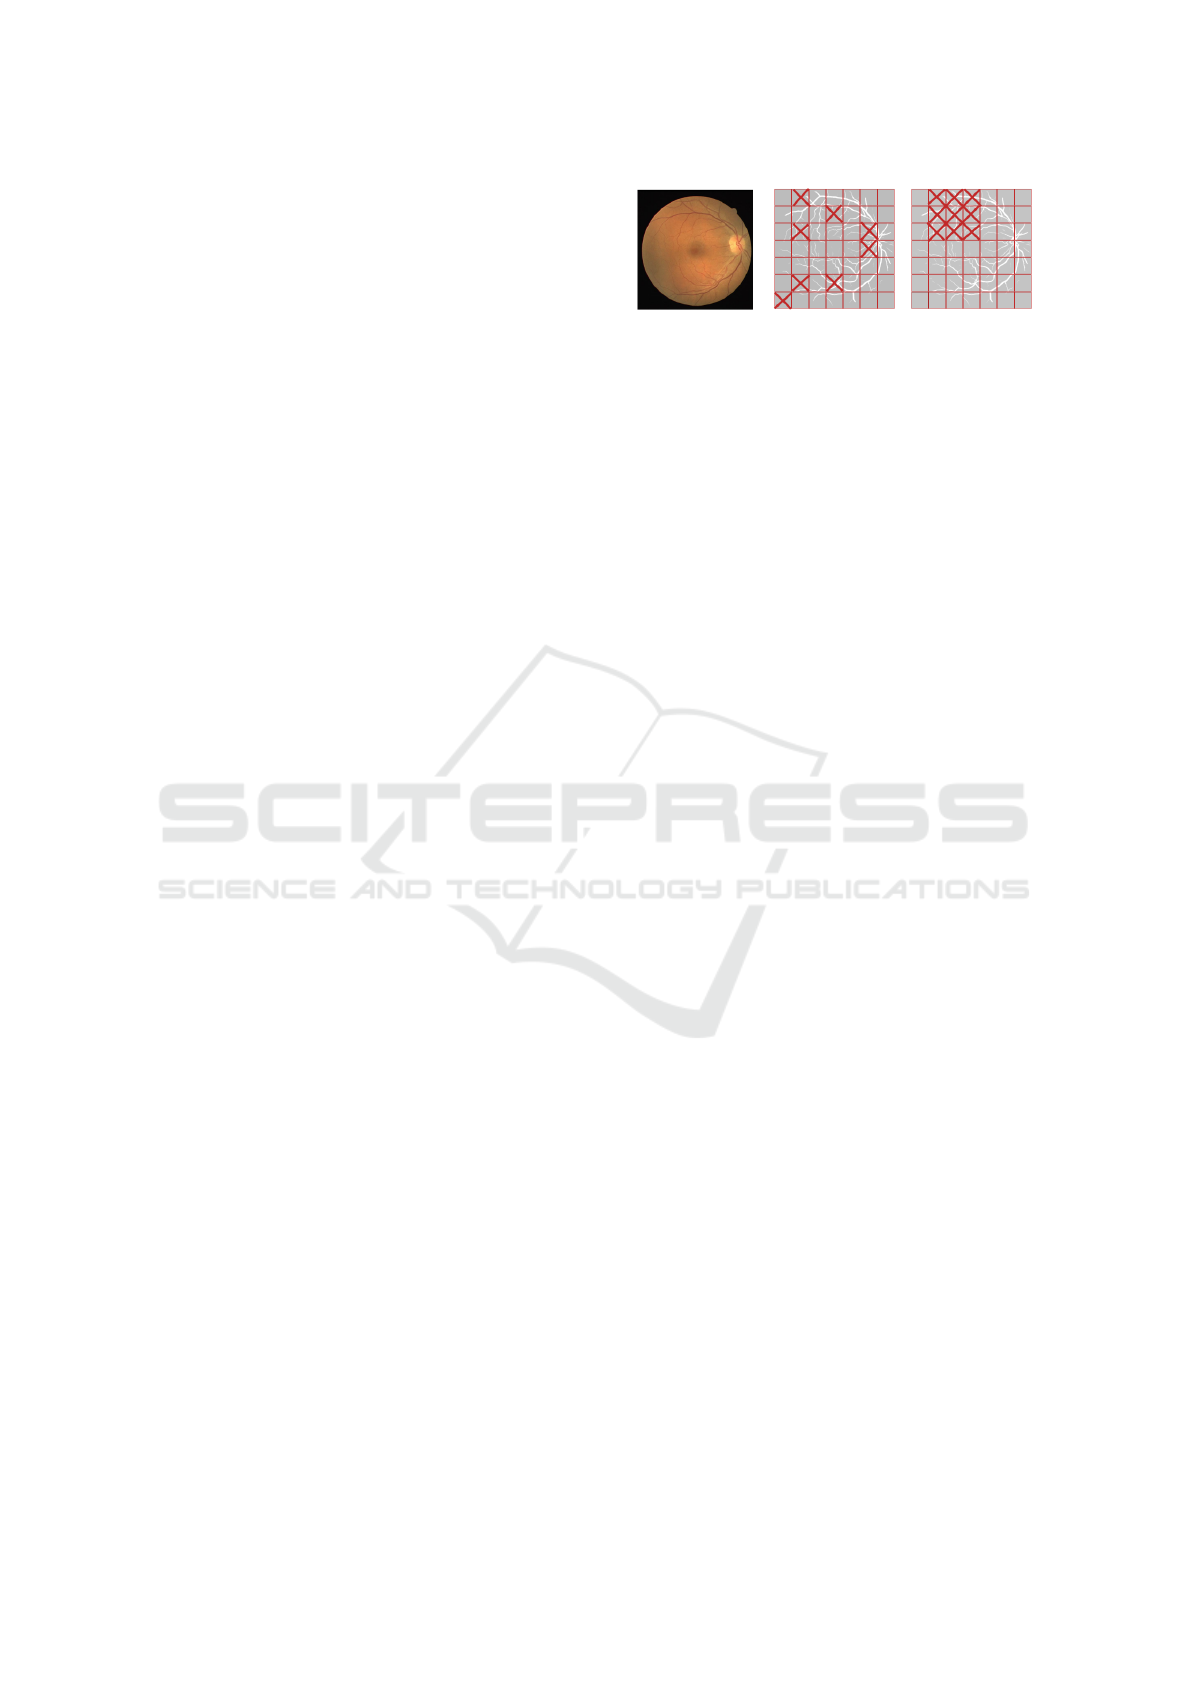
rate. DropBlock (Ghiasi et al., 2018) is a struc-
tured DropOut that is also used to regularize a CNN.
Units in a contiguous section of a feature map are
dropped together in DropBlock. Because DropBlock
discards features in correlated areas, networks must
look for evidence elsewhere to suit the data. Drop-
Block requires the setting of two parameters: block-
size, which defines the amount of neurons in each
block, and keep-prob, which determines the probabil-
ity of the block being shut down. DropOut and Drop-
Block are contrasted in Fig. 1
Figure 1: An example contrasting DropOut and Drop-
Block’s methods for skipping units in an input image.
CNN models can comprise from just a few to
hundreds of hyper-parameters. The values supplied
for these hyper-parameters can have an effect on the
model learning rate and other regulations during train-
ing, as well as final model performance. In addi-
tion to those described above Depth as a number
of layers, Kernel-size, Pooling-type, Activation, and
Optimization are common CNN hyper-parameters.
Our investigations will also consider Epoch, another
hyper-parameter which determines how many times
the learning algorithm will run over the whole train-
ing dataset.
CNNs may have different architectures with dif-
ferent shapes. U-Net (Ronneberger et al., 2015) is
a well-known CNN for image segmentation. A U-
shaped encoder-decoder with skip connections be-
tween them makes up the U-Net architecture. The
encoder takes the input features and minimizes their
dimension, while the decoder uses properties of the
encoder to produce the best match to the actual in-
put or expected output. The key benefit of this design
is its ability to predict from the real image pixel by
pixel, which is notably helpful for segmenting retinal
blood vessels. The effectiveness of a U-Net in image
segmentation has led other researchers to develop fur-
ther iterations of it, such as the Dual Encoding U-Net
(DEU-Net) (Wang et al., 2019), the U-Net++ (Zhou
et al., 2018), Attention U-Net (Oktay et al., 2018), and
the Spatial Attention U-Net (SA-UNet) (Guo et al.,
2021). The latter, which is the base model in our
work below, incorporates two main changes to the U-
Net. In order to reduce over-fitting, it uses DropBlock
rather than DropOut and, secondly, it uses spatial at-
tention at the bottom of the U-Net, as shown in Fig. 2.
The absence of contrast between the blood vessel
region and background in the retinal fundus images is
a significant challenge of retinal segmentation. Many
efforts have been made to address this lack of differ-
entiation, with attention block (Vaswani et al., 2017)
becoming one of the effective strategies. The SA-
UNet transforms a set of important values into a de-
coder in order to assist the network in learning more
effectively. In order to provide competitive results,
the model has to learn structural information, which
is possible with spatial attention. This information is
learned by emphasizing important units and minimiz-
ICAART 2023 - 15th International Conference on Agents and Artificial Intelligence
902

ing background noise and its influence.
2.2 Genetic Algorithms
Genetic Algorithms (GA) (Holland, 1975), a sub-field
of Evolutionary Algorithms, draws influence from bi-
ology by representing solutions as “genes” and using
biologically-inspired operators to mutate individuals
to promote evolution. GAs are widely utilized and can
generate superior results for optimization and search
problems. The GA process begins with random in-
dividuals, which in this case are groups of models
with different hyper-parameters. Each individual re-
ceives a score based on its fitness. The best individ-
uals are selected and modified through mutation and
crossover, and they will pass on to the next generation.
This procedure continues until the last generation.
3 EXPERIMENTAL SETUP
3.1 Dataset
In our experiments, we use the Digital Retinal Im-
ages for Vessel Extraction (DRIVE) database (Staal,
2018). DRIVE contains 40 images divided into two
groups. There is a training set of 20 (see Fig. 3) im-
ages and a test set of 20 images (see Fig. 4). We
obtained 260 total images after using an augmenta-
tion technique on the training set, and we chose 26 at
random to create the validation set. For the training
images, a single manual segmentation of the vascu-
lature, and for the test images, two manual segmen-
tations are provided. One serves as a gold standard,
while the other may be used to compare computer-
generated segmentation to human observer segmenta-
tion. A mask image indicating the region of interest
is also provided for each retinal image. All human
observers who manually segmented the vasculature
were directed and taught by a professional ophthal-
mologist.
3.2 Epoch Optimisation
Over-fitting is a crucial problem when training a neu-
ral network. When a neural network model is trained
using more epochs than necessary, the training model
largely learns patterns that are specific to the sample
data. This prevents the model from functioning suc-
cessfully on a new dataset. An over-fitted model per-
forms well on the training set, however, it performs
poorly on the test set. In other words, by over-fitting
to the training data, the model loses its ability to gen-
eralize. The model should be trained for an optimum
number of epochs to reduce over-fitting and enhance
the neural network’s generalization ability. A portion
of the training data is set aside for model validation,
which involves evaluating the model’s performance
after each epoch of training. Loss and accuracy on
both the training and validation sets are tracked to de-
termine the epoch number at which the model begins
performing poorly or stops improving. In our earlier
research, we discovered that GA may produce a CNN
that performs poorly and, so, wastes computational
time. To counter this we use epoch optimization to de-
fine a threshold validation accuracy that allows us to
stop the training process on poorly-performing mod-
els. In Listing 1 we show how to write our custom
early stopping which is a modification of EarlyStop-
ping in Keras (Chollet et al., 2015).
1 c us to m_e ar ly _st op pi n g = E arl yS t op pin g (
2 mon itor = ’ v a li da ti o n_ ac c ur ac y ’ ,
3 pa t ien ce = 7 ,
4 mi n_d e lta = 0.01 ,
5 mo de = ’ max ’,
6 th res h old = 0 .8 5)
Listing 1: Custom early epoch stopping.
In this code we monitor Validation-Accuracy in
each epoch and if it doesn’t improve 1 percent after 7
epochs the training process will stop. Another novel
stopping criterion which we added to our custom-
early-stopping function for bad models, is Validation-
Accuracy’s threshold, which means the training of
a model will stop if the training process starts with
Validation-Accuracy less than 0.85. These methods
help us to save time and computation costs by remov-
ing poorly-performing models from the training pro-
cess.
3.3 GA Parameters
We used the DEAP (Fortin et al., 2012) framework, in
Python, for the GA process. A population of individ-
uals is first created before beginning the GA process,
as explained in Algorithm 1. A set of genes known as
a genotype, or individual, represents a collection of
SA-UNet hyper-parameters. We choose the follow-
ing hyper-parameters for optimization: Depth, Filter
Size, Kernel Size, Pooling Type, Activation, and Opti-
mizer. Every genotype is the result of a particular set
of genes, and every genotype is a particular model.
Each experiment had 20 generations and had a
population of 20 individual, and was repeated 15
times. To generate the initial population, each run
used random initialisation, one-point crossover, and
bit-flip mutation. During the evolutionary run, each
individual was trained for 15 epochs with a batch-size
Optimising Evolution of SA-UNet for Iris Segmentation
903
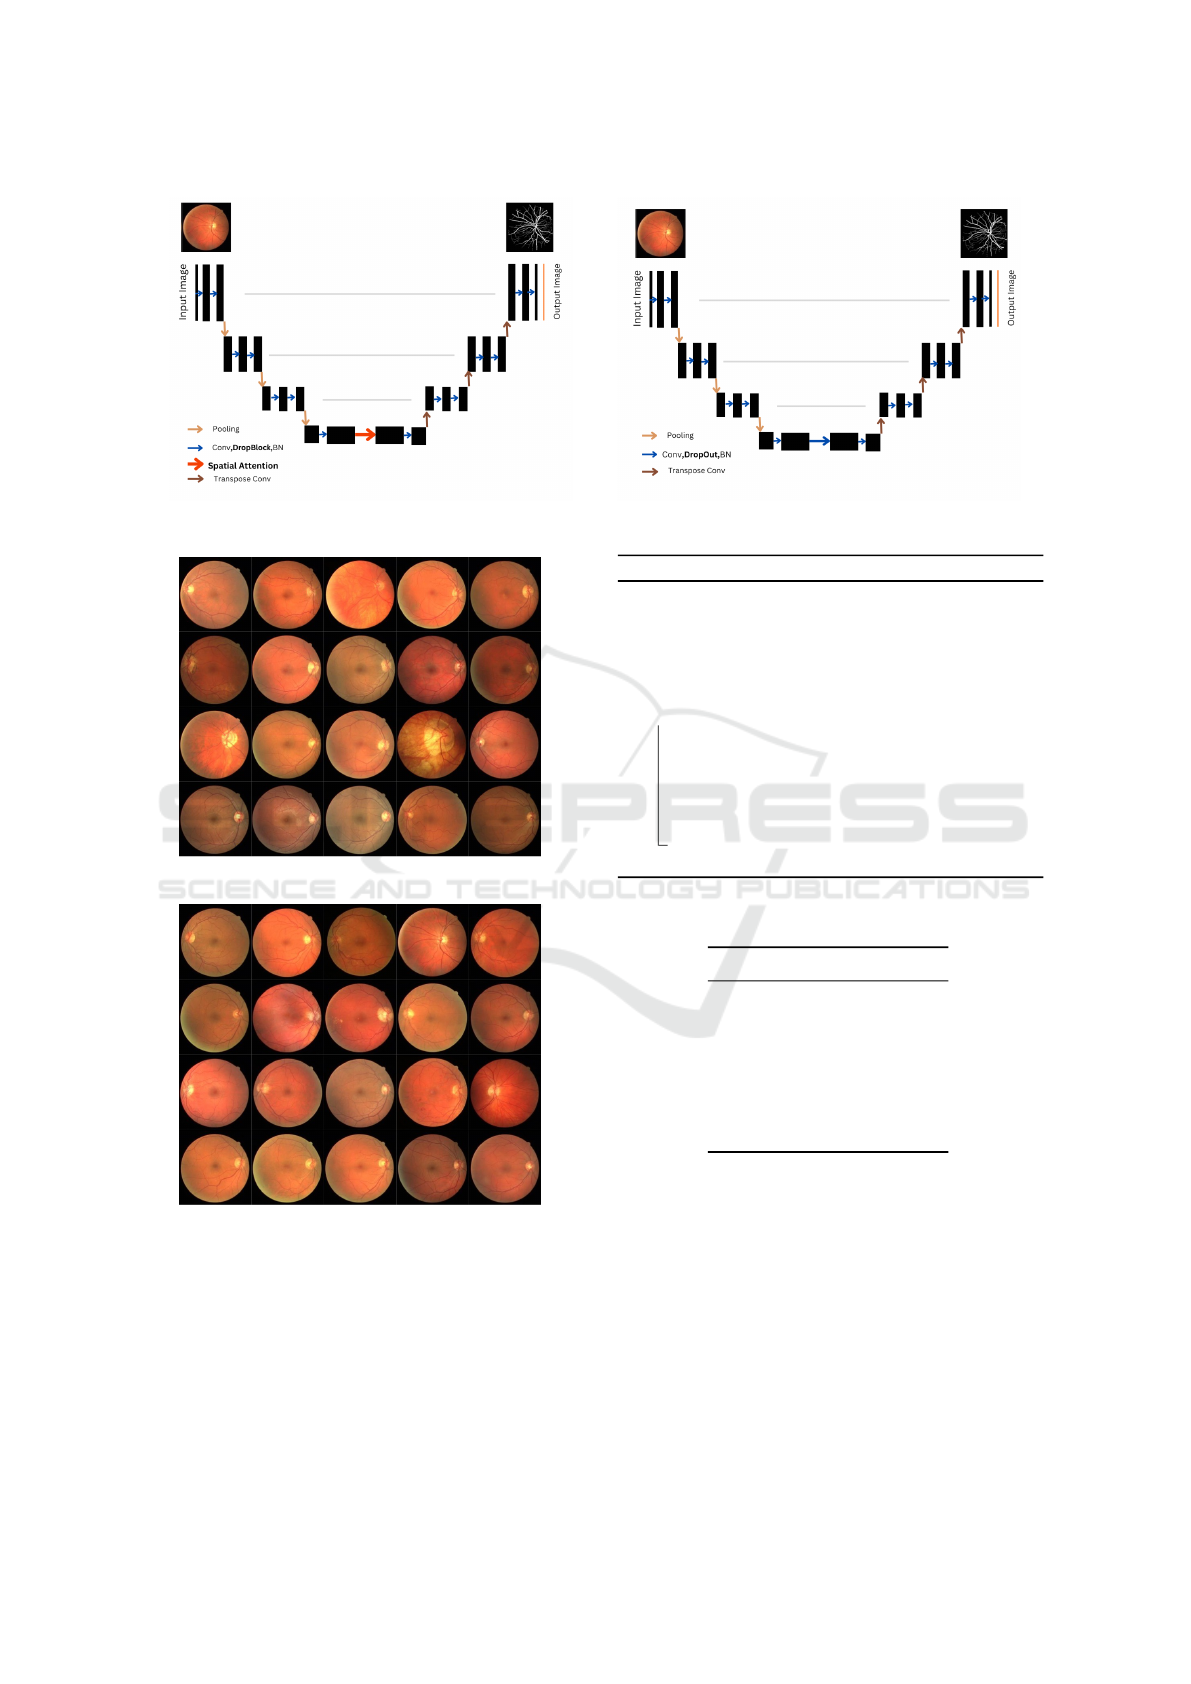
Figure 2: Differences of a SA-UNet (on the left) and a U-Net (on the right) architecture.
Figure 3: DRIVE training images.
Figure 4: DRIVE test images.
of 2. The top-performing model was trained for an-
other 500 epochs at the conclusion of each run.
Validation-Accuracy was used as the fitness func-
tion. Validation-Accuracy helps to prevent over-
fitting, which is important for our small training
dataset. Table 1 summarizes the evolutionary param-
eters.
Algorithm 1: Genetic Algorithm.
Input: G = [g
1
,g
2
,...,g
n
] // Representation
Output: best I
i
// Best SA-UNet
1 I
i
← (G,β,S) // S=score
2 β = [D, F, T,K, O, A, P, B] S = ∅
3 Q
t=0
← I
i
// Initial population
4 while t < m // m = max generations
5 do
6 Evaluate each phenotype β ∈ Q
t−1
7 S(I
i
) ← eval(β
i
) assign fitness score
8 Select parents from Q
t−1
using S
9 Genetic operations on G
i
of selected parents
10 Q
t
← (G,β) offspring (new pop)
11 t ← t +1
12 Return I
i
from Q
t
with the best S.
Table 1: List of parameters used to run GA.
Parameter Value
Runs 15
Total Generations 20
Population Size 20
Crossover Rate 0.9
Mutation Rate 0.5
Epochs (Training) 15
Epochs (Best) 500
3.4 Removing Duplicated Individuals
Many strategies for maintaining population vari-
ety have been researched in evolutionary computa-
tion (Squillero and Tonda, 2016). Some research (Ki-
tamura and Fukunaga, 2022; McPhee et al., 1999;
Mayr, 1992) showed that encouraging variety can im-
prove evolutionary optimization processes and avoid
early convergence on sub-optimal solutions.
Another difficulty we faced in previous works
was the large number of repeated individuals after
ICAART 2023 - 15th International Conference on Agents and Artificial Intelligence
904

crossover and mutation, which resulted in training the
same individuals again and again. To tackle this issue,
we propose Removing Duplicated Individuals (RDIs),
which updates the DEAP algorithm to allow crossover
to continue until a new individual is created. This al-
lowed us to save even more time and cost in the com-
puting process. Thus, removing duplicate solutions
provides us with two benefits: first, we avoid training
the same models several times, and second, we obtain
diverse models.
3.5 Genome
The genomes that reflect our solutions are then con-
verted into a CNN architecture. The construction of
each genome is described in Table 2, which shows
each hyper-parameter’s options and bits. In this
study, we used fixed-length binary string represen-
tation. This means that each bit or group of bits
represents different hyper-parameters. Finally, each
binary string represents a different SA-UNet archi-
tecture. Bit sizes were defined based on how many
options each hyper-parameter has. Each string has
15 bits. For example, the first two bits identify the
model’s Depth, while the next two bits specify which
Filter size the model starts with, and so on.
3.6 Evaluation Metrics
The following metrics were used to evaluate our
models: Recall, Specificity, AUC, positive predictive
value Precision), negative predictive value (NPV),
F2-Score, and MCC (Chicco and Jurman, 2020)
which is a statistical rate that has a high score only
if all four confusion matrix rates (TP, FN, TN, and
FP) performed well in the prediction.
The relevant formulae are:
Recall =
T P
T P + FN
Specificity =
T N
T N + FP
Precision =
T P
T P + FP
NPV =
T N
T N + FN
F1-Score =
T P
T P + 1/2(FP + FN)
MCC =
T P × T N − FP × FN
p
(T P + FP)(T P + FN)(T N + FN)(T N + FN)
4 RESULTS
We show the impact of the epoch optimisation and
RDI methods in Table3. First, we compare RDI meth-
ods with our previous work (Mahdinejad. et al.,
2022). Whereas we found in our previous work
that we had 51 percent duplicated individuals, when
adopting RDI it resulted in having 0 duplicated indi-
viduals. In our last work (Mahdinejad. et al., 2022),
we had as parameters population of 15, 20 genera-
tions, 10 runs, plus 150 initial population from which
we expected to have 3150 total individuals. However,
on examination we had just 1580 unique models, sug-
gesting that around half of the individuals were dupli-
cated. However, in this work with 20 generations and
population of 20, we had 400 + 20 (initial population)
= 420 total individuals in each run, and 6300 in 15
runs.
We investigated how much epoch optimization
helped us in deleting or stopping poor performance
models. We saw that on average in 15 runs, 59%
of models were removed. So using these two meth-
ods gave us 75% benefits from our previous works.
With 20 generations of 20 individuals with 15 epochs
for each models, we are supposed to have 3600 total
epochs in each run. We had the maximum number of
epochs in Run7 with 3064 epochs, and the minimum
number of 2136 epochs in Run1.
In Table 4 we show the hyper-parameters of our 5
best models.
There are some similarities in the models. As can
be seen, GA picked Activation = sigmoid for all of
the models. Optimiser = Nadam and Filter Size = 16,
are the most popular ones among the remainder. Ker-
nel Size bigger than (3,3) are not in the best models,
and likewise for Depth bigger than 3. Pooling Type,
Keep Probability and Block Size are varied in different
models.
Table 5 shows the full results of our 5 best mod-
els, compared with the standard SA-UNet
1
, as found
online and in our previous approach.
Best-Model1 and Best-Model2 obtained the high-
est AUC, (0.986), of all of the models, and signifi-
cantly improved compared to SA-UNet, 0.977. Best-
Model1 achieved the best Accuracy = 0.969. Our
previous model and Best-Model1 have similar perfor-
mance in F1-Score and MCC but Best-Model1 could
beat our previous model in AUC (0.985 compared to
0.986), Accuracy (0.968 compared to 0.969), and Size
(8.3M compared to 7.8M).
GA evolved more accurate and much smaller
models compare to the standard SA-UNet with Size =
1
https://github.com/clguo/SA-UNet
Optimising Evolution of SA-UNet for Iris Segmentation
905
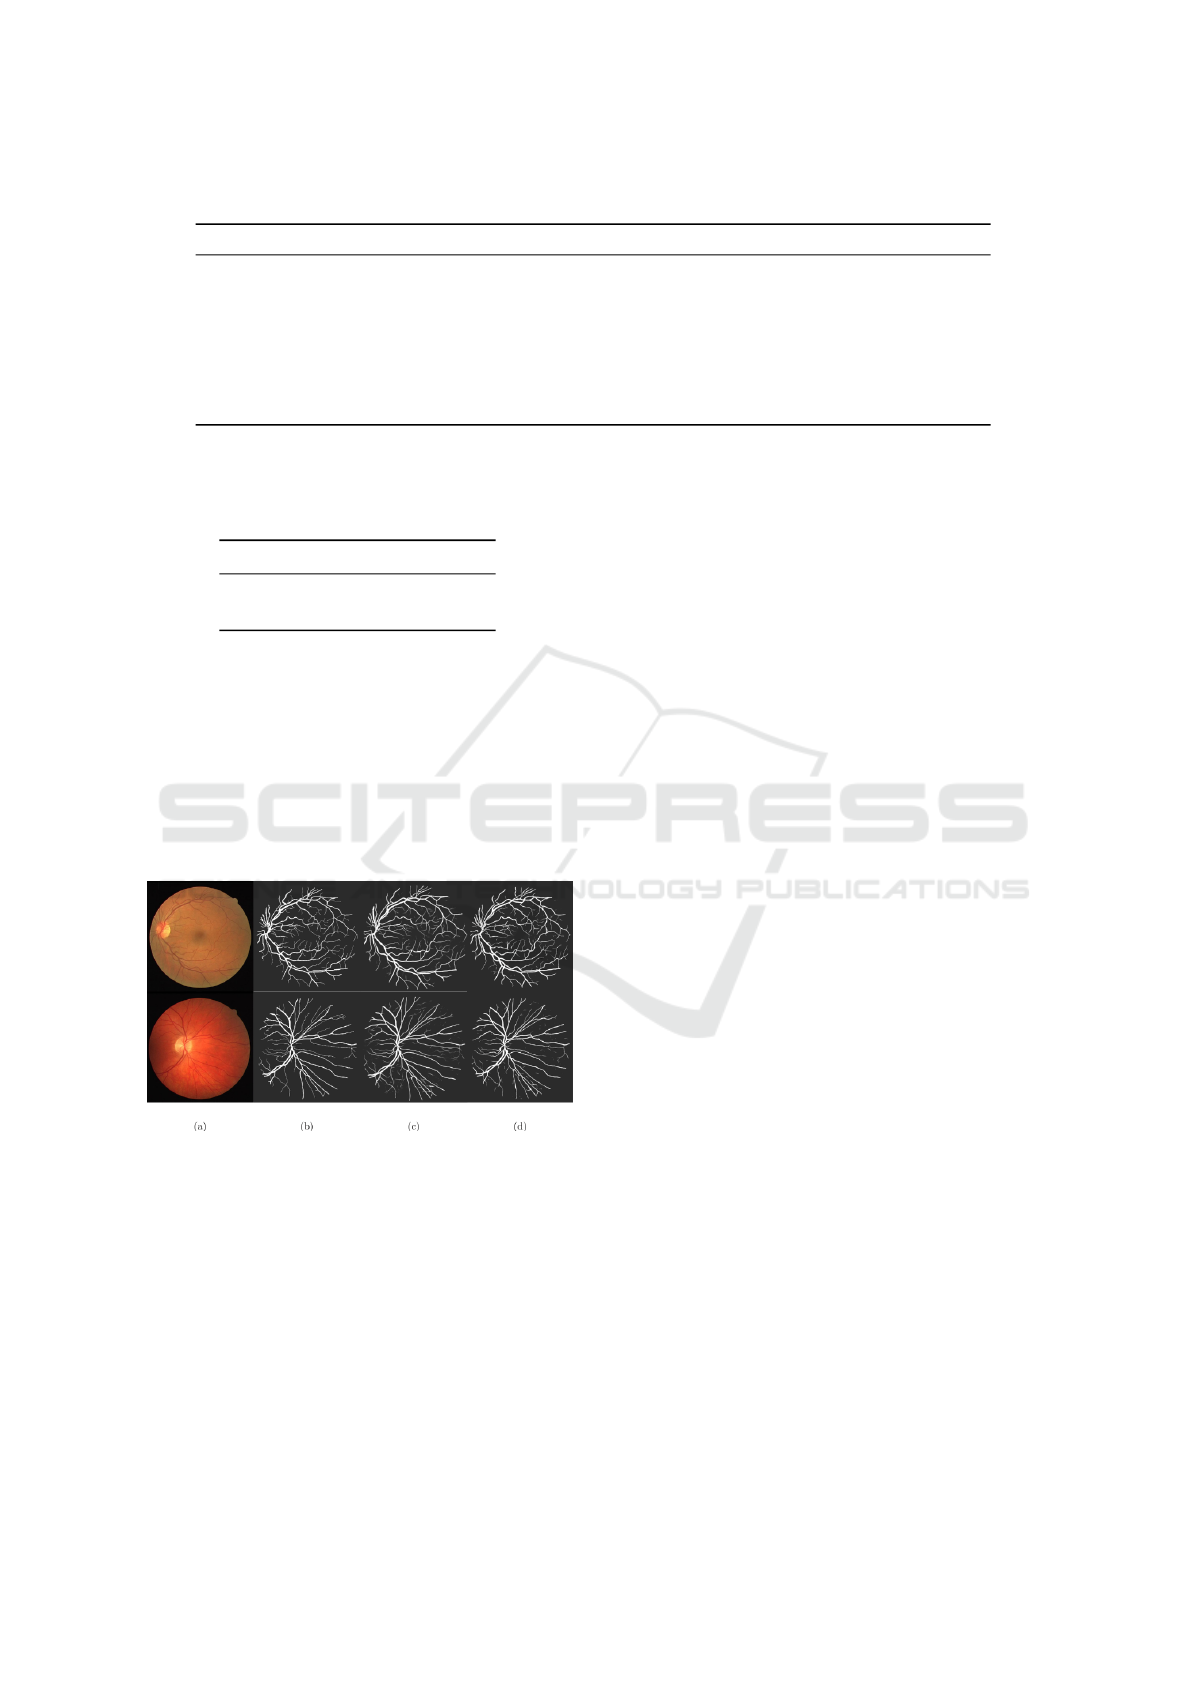
Table 2: Genotype representation of the hyper-parameters.
Parameter Gens Choices Bit-Size
Depth D { 1, 2, 3, 4 } 2
Filter Size F { 8, 16, 32, 64 } 2
Pooling Type T { MaxPooling, AveragePooling } 1
Kernel Type K {(2, 2), (3, 3), (5, 5), (7, 7)} 2
Optimizer O { sgd, adam, adamax, adagrad, Nadam, Ftrl, Adadelta, RMSprop } 3
Activation A { relu, sigmoid, softmax, softplus, softsign, tanh, selu, elu } 3
Keep Probability P { 0.8, 0.9 } 1
Block Size B { 7, 9 } 1
Table 3: Results of epoch optimisation and removing dupli-
cated individuals methods.
Method Average
RDIs 51%
Epoch Optimisation 59%
17.1M. Best-Model3 is the smallest model with Size
= 7.8M.
We also compared AUC of our model with other
state-of-the-art models in Table 6. Our best model
got the third position in this table with a slight differ-
ence compared to the top two models. We got bet-
ter AUC compared to our previous approaches (Popat
et al., 2020; Houreh et al., 2021; Mahdinejad. et al.,
2022).
Figure 5: Comparing the outcomes of two images. Ground-
truth is (b), Best-Model1 is (c), and SA-UNet is (d).
The results of our best model compared to
Ground-truth and SA-UNet for two images are shown
in Fig. 5. As one can see, our model shows more de-
tails in both images.
In Fig. 6, we demonstrate how our model mini-
mized over-fitting when compared to an SA-UNet and
a U-Net.
5 CONCLUSIONS
The design and hyper-parameters of a convolution
neural network used for image segmentation were op-
timized by a GA. The U-Net was previously used as
a basis model. U-Net, however, could show a sig-
nificant over-fitting rate because of the limited train-
ing dataset. Since the SA-UNet has demonstrated en-
hanced performance over the original U-Net, it was
chosen as the base model in our most recent ex-
periment. A spatial attention block is included in
the middle of the SA-UNet model. DropBlock was
used instead of DropOut from earlier experiments as
well. The results demonstrate that including Drop-
Block and spatial attention into the U-Net design
enhances model prediction and that the evolution-
ary algorithm can be used to successfully determine
the optimal combination of hyper-parameters for the
model. With an increase in the model’s best AUC
from 0.975 to 0.986, our results outperformed earlier
GA-based methods. Additionally, we outperformed
the standard U-Net and SA-UNet in terms of perfor-
mance. The next step was to conduct additional runs
in the evolutionary process to see if GA could de-
velop a better model. We proposed the idea of delet-
ing poor performance and duplicated models due to
the time-consuming evolutionary process. We first
used custom early epoch stopping to exclude mod-
els that had not improved after 7 epochs. Next, we
removed the models which started with poor perfor-
mance, Validation-Accuracy less than 0.85. Finally,
we instruct the GA algorithm to generate new indi-
viduals rather than similar ones. All of the above
strategies assisted us in having more efficient runs in
comparison to past projects; we had 10 runs in pre-
vious works, but 15 runs in this study, which led to
the discovery of better models. All of the 5 mod-
els have better performance compared to the standard
SA-UNet, which shows the robustness of our results
in different runs. Training time can be reduced by
75% by removing useless models from our previous
ICAART 2023 - 15th International Conference on Agents and Artificial Intelligence
906
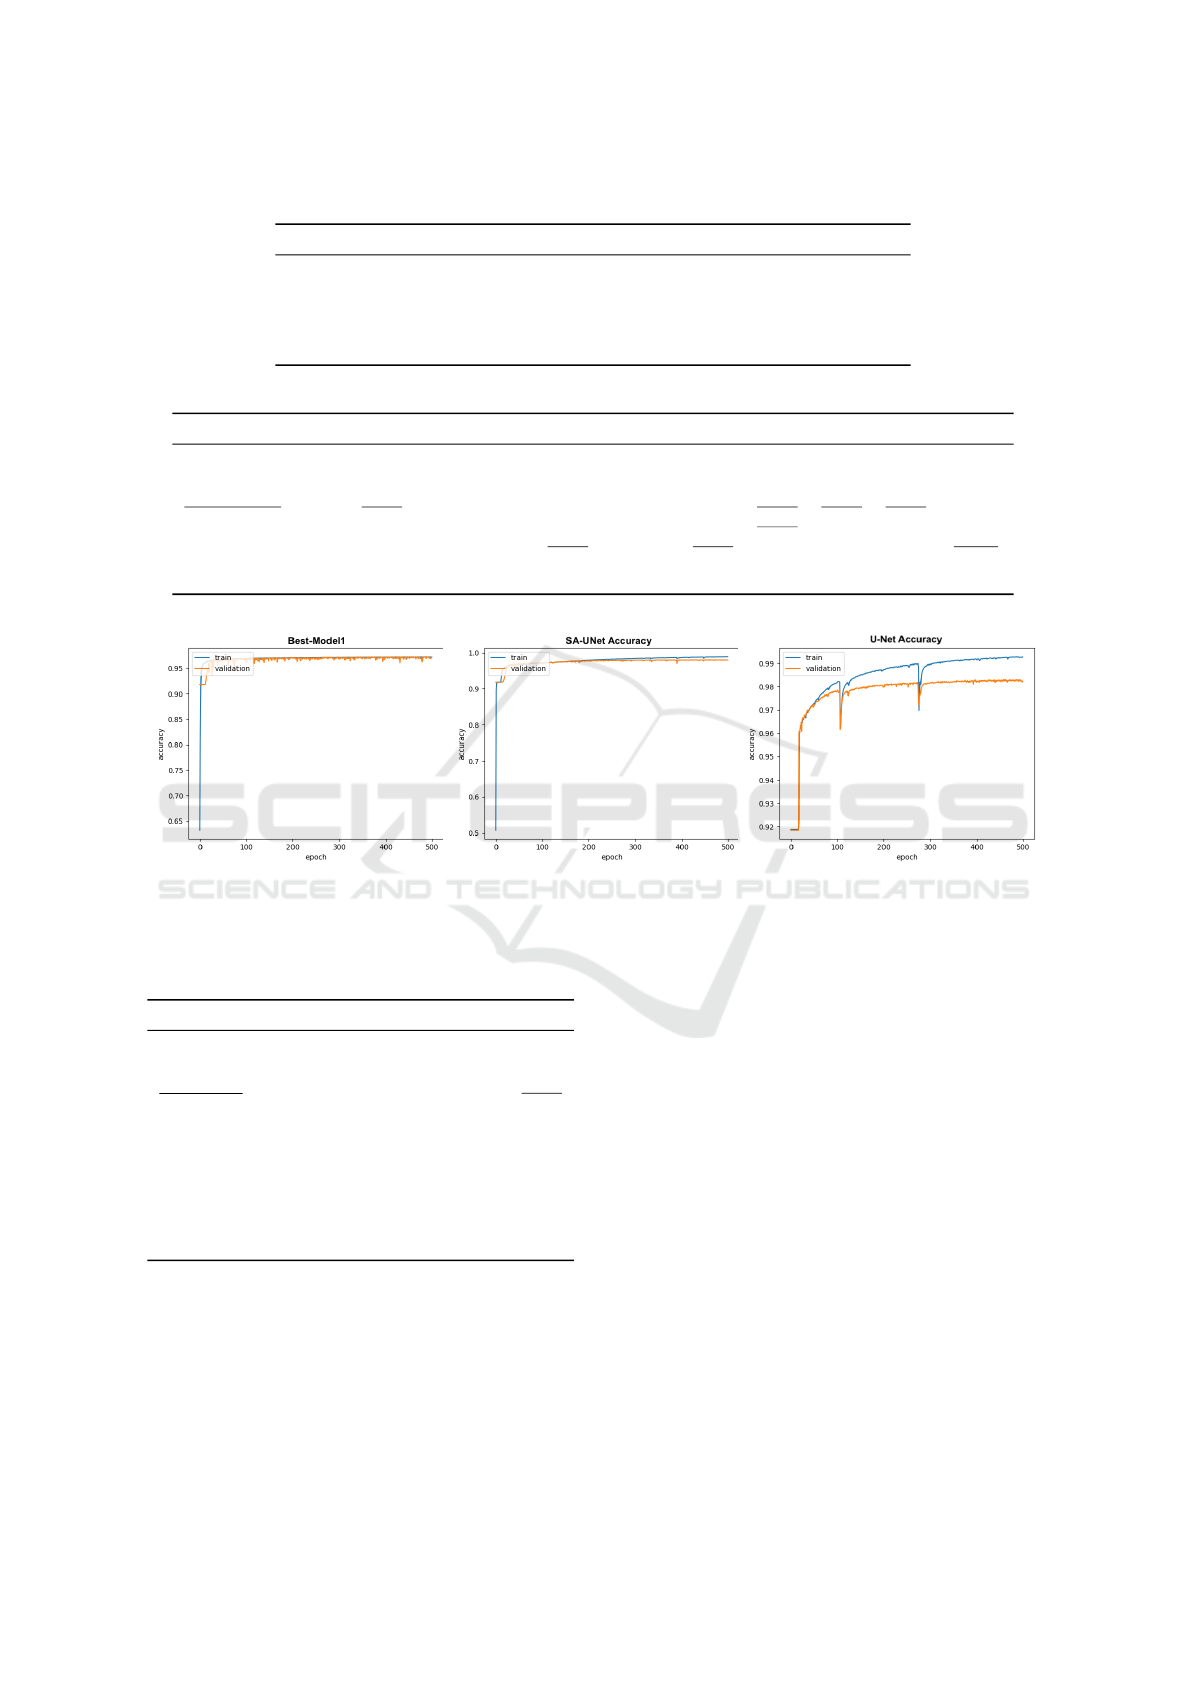
Table 4: Hyper-parameters of the 5 Best models.
Model D F T K O A P B
Best-Model1 1 32 Avg-Pooling (3, 3) RMSprop sigmoid 0.9 7
Best-Model2 2 64 Max-Pooling (3, 3) Nadam sigmoid 0.8 9
Best-Model3 1 16 Max-Pooling (3, 3) Nadam sigmoid 0.9 7
Best-Model4 3 16 Avg-Pooling (2, 2) adam sigmoid 0.8 9
Best-Model5 2 16 Max-Pooling (2 ,2) Nadam sigmoid 0.8 9
Table 5: Results of the Best models in each run.
Models TestAcc Sensitivity Specificity NPV PPV AUC F1 MCC Size
SA-UNet 0.963 0.760 0.977 0.983 0.812 0.977 0.786 0.766 17.1 M
Our Previous Model 0.968 0.822 0.983 0.983 0.822 0.985 0.822 0.805 8.3 M
Best-Model1 0.969 0.812 0.984 0.982 0.833 0.986 0.822 0.805 7.8 M
Best-Model2 0.969 0.807 0.984 0.982 0.830 0.986 0.819 0.801 10.6 M
Best-Model3 0.966 0.729 0.990 0.973 0.880 0.983 0.798 0.784 7.3 M
Best-Model4 0.965 0.732 0.988 0.974 0.861 0.978 0.791 0.776 10.2 M
Best-Model5 0.966 0.826 0.980 0.983 0.804 0.983 0.815 0.797 8.1 M
Figure 6: Different model’s training and validation plots for 500 epochs.
Table 6: Comparison of the AUC of the best model with
other state-of-the-art models.
Method AUC
RV-GAN (Kamran et al., 2021) 0.989
Study Group Learning (Zhou et al., 2021) 0.989
Our model 0.986
Our Previous Model (Mahdinejad. et al., 2022) 0.985
U-Net (Uysal et al., 2021) 0.985
IterNet (Li et al., 2020) 0.981
VGN (Shin et al., 2019) 0.980
SA-UNet 0.977
U-Net (Ronneberger et al., 2015) 0.975
GA-based U-Net (Popat et al., 2020) 0.975
HNAS-based (Houreh et al., 2021) 0.975
work. Another direction is to use several data aug-
mentation techniques and let the evolutionary algo-
rithm choose the best one. Other benchmark datasets
or real-world applications can also be used.
ACKNOWLEDGEMENTS
This study was funded by the Science Foundation
Ireland (SFI) Centre for Research Training in Arti-
ficial Intelligence (CRT-AI) Grant No. 18/CRT/6223
and the Irish Software Engineering Research Centre
(Lero) Grant No. 16/IA/4605.
REFERENCES
Albawi, S., Mohammed, T. A., and Al-Zawi, S. (2017).
Understanding of a convolutional neural network. In
2017 international conference on engineering and
technology (ICET), pages 1–6. Ieee.
Baldi, P. and Sadowski, P. J. (2013). Understanding
dropout. Advances in neural information processing
systems, 26.
Chicco, D. and Jurman, G. (2020). The advantages of the
matthews correlation coefficient (mcc) over f1 score
and accuracy in binary classification evaluation. BMC
genomics, 21(1):1–13.
Optimising Evolution of SA-UNet for Iris Segmentation
907

Chollet, F. et al. (2015). Keras. https://keras.io.
Ciulla, T. A., Amador, A. G., and Zinman, B. (2003). Dia-
betic retinopathy and diabetic macular edema: patho-
physiology, screening, and novel therapies. Diabetes
care, 26(9):2653–2664.
Fortin, F.-A., De Rainville, F.-M., Gardner, M.-A. G.,
Parizeau, M., and Gagn
´
e, C. (2012). Deap: Evolu-
tionary algorithms made easy. The Journal of Machine
Learning Research, 13(1):2171–2175.
Ghiasi, G., Lin, T.-Y., and Le, Q. V. (2018). Dropblock: A
regularization method for convolutional networks.
Guo, C., Szemenyei, M., Yi, Y., Wang, W., Chen, B.,
and Fan, C. (2021). Sa-unet: Spatial attention u-net
for retinal vessel segmentation. In 2020 25th Inter-
national Conference on Pattern Recognition (ICPR),
pages 1236–1242. IEEE.
Holland, J. H. (1975). Adaptation in Natural and Artificial
Systems. University of Michigan Press, Ann Arbor,
MI. second edition, 1992.
Houreh, Y., Mahdinejad, M., Naredo, E., Dias, D. M., and
Ryan, C. (2021). Hnas: Hyper neural architecture
search for image segmentation. In ICAART (2), pages
246–256.
Kamran, S. A., Hossain, K. F., Tavakkoli, A., Zuckerbrod,
S. L., Sanders, K. M., and Baker, S. A. (2021). Rv-
gan: segmenting retinal vascular structure in fundus
photographs using a novel multi-scale generative ad-
versarial network. In International Conference on
Medical Image Computing and Computer-Assisted In-
tervention, pages 34–44. Springer.
Kitamura, T. and Fukunaga, A. (2022). Duplicate in-
dividuals in differential evolution. In 2022 IEEE
Congress on Evolutionary Computation (CEC), pages
1–8. IEEE.
LeCun, Y., Bengio, Y., et al. (1995). Convolutional net-
works for images, speech, and time series. The
handbook of brain theory and neural networks,
3361(10):1995.
Li, L., Verma, M., Nakashima, Y., Nagahara, H., and
Kawasaki, R. (2020). Iternet: Retinal image segmen-
tation utilizing structural redundancy in vessel net-
works. In Proceedings of the IEEE/CVF Winter Con-
ference on Applications of Computer Vision, pages
3656–3665.
Lodwich, A., Rangoni, Y., and Breuel, T. (2009). Eval-
uation of robustness and performance of early stop-
ping rules with multi layer perceptrons. In 2009 inter-
national joint conference on Neural Networks, pages
1877–1884. IEEE.
Mahdinejad., M., Murphy., A., Healy., P., and Ryan.,
C. (2022). Parameterising the sa-unet using a ge-
netic algorithm. In Proceedings of the 14th Inter-
national Joint Conference on Computational Intelli-
gence - ECTA,, pages 97–104. INSTICC, SciTePress.
Mayr, E. (1992). Darwin’s principle of divergence. Journal
of the History of Biology, pages 343–359.
McPhee, N. F., Hopper, N. J., et al. (1999). Analysis of
genetic diversity through population history. In Pro-
ceedings of the genetic and evolutionary computation
conference, volume 2, pages 1112–1120. Citeseer.
Oktay, O., Schlemper, J., Folgoc, L. L., Lee, M., Heinrich,
M., Misawa, K., Mori, K., McDonagh, S., Hammerla,
N. Y., Kainz, B., et al. (2018). Attention u-net: Learn-
ing where to look for the pancreas. arXiv preprint
arXiv:1804.03999.
Popat, V., Mahdinejad, M., Cede
˜
no, O. D., Naredo, E., and
Ryan, C. (2020). Ga-based u-net architecture opti-
mization applied to retina blood vessel segmentation.
In IJCCI, pages 192–199.
Prechelt, L. (1998a). Automatic early stopping using cross
validation: quantifying the criteria. Neural networks,
11(4):761–767.
Prechelt, L. (1998b). Early stopping-but when? In Neural
Networks: Tricks of the trade, pages 55–69. Springer.
Ronneberger, O., Fischer, P., and Brox, T. (2015). U-net:
Convolutional networks for biomedical image seg-
mentation. CoRR, abs/1505.04597.
Shin, S. Y., Lee, S., Yun, I. D., and Lee, K. M. (2019). Deep
vessel segmentation by learning graphical connectiv-
ity. Medical image analysis, 58:101556.
Squillero, G. and Tonda, A. (2016). Divergence of character
and premature convergence: A survey of methodolo-
gies for promoting diversity in evolutionary optimiza-
tion. Information Sciences, 329:782–799.
Staal, J. (2018). DRIVE: Digital retinal images for vessel
extraction.
Uysal, E. S., Bilici, M. S¸., Zaza, B. S.,
¨
Ozgenc¸, M. Y.,
and Boyar, O. (2021). Exploring the limits of data
augmentation for retinal vessel segmentation. arXiv
preprint arXiv:2105.09365.
Vaswani, A., Shazeer, N., Parmar, N., Uszkoreit, J., Jones,
L., Gomez, A. N., Kaiser, Ł., and Polosukhin, I.
(2017). Attention is all you need. Advances in neural
information processing systems, 30.
Wang, B., Qiu, S., and He, H. (2019). Dual encoding u-net
for retinal vessel segmentation. In International con-
ference on medical image computing and computer-
assisted intervention, pages 84–92. Springer.
Winder, R. J., Morrow, P. J., McRitchie, I. N., Bailie, J., and
Hart, P. M. (2009). Algorithms for digital image pro-
cessing in diabetic retinopathy. Computerized medical
imaging and graphics, 33(8):608–622.
Zhou, Y., Yu, H., and Shi, H. (2021). Study group learning:
Improving retinal vessel segmentation trained with
noisy labels. In International Conference on Medi-
cal Image Computing and Computer-Assisted Inter-
vention, pages 57–67. Springer.
Zhou, Z., Rahman Siddiquee, M. M., Tajbakhsh, N., and
Liang, J. (2018). Unet++: A nested u-net architecture
for medical image segmentation. In Deep learning in
medical image analysis and multimodal learning for
clinical decision support, pages 3–11. Springer.
ICAART 2023 - 15th International Conference on Agents and Artificial Intelligence
908
