
Classification of HCI Datasets Using Information Fusion and Weighted
Frechet Distance
Aleksandar Jeremic and Huaying Li
Department of Electrical and Computer Engineering McMaster University, Hamilton, ON, Canada
Keywords:
Classification, Information Fusion, Bioinformatics, Biomedical Signal Processing.
Abstract:
The identification and classification of human breast cancer cells (MCF7) undergoing various treatments are
widely used for studies of tumour biology and drug mechanism action. The development of adequate de-
tection/classification strategies that would meet clinical needs is currently a subject of significant research
interest as the optimal techniques are application/cell/treatment dependent. In addition to commonly used
machine learning techniques for classification/clustering there has been an effort to utilize deep learning tech-
niques as well. However, due to the fact that different cancer cells and different treatments require different
data sets these techniques had rather limited success. In this paper we propose an information fusion tech-
nique that utilizes Frechet distance measures by combining their decisions in an optimal way by minimizing
the overall classification error. The applicability of our results is demonstrated using real data sets with ten
different treatments.
1 INTRODUCTION
Information fusion techniques have been widely ap-
plied in many applications including clustering, clas-
sification, detection and etc. One of the major ob-
jectives is to improve the classification performance
(i.e. minimize overall probability of error) by incor-
porating decisions from various sources individually
and combining them into a global decision that is po-
tentially more accurate. Classification techniques are
commonly used tools in analytical chemistry due to
high complexity and dimensionality of the chemical
measurements and in recent years a large number of
deep learning (DL) techniques have been successfully
utilized in this field. (Debus et al., 2021). However in
certain application the amount of data available may
not be sufficient for DL techniques and hence certain
feature reduction techniques may be required in order
to achieve desirable performance.
In particular in bio-image analysis the increase
in imaging throughput, new analytical frameworks
and large computational resources created new re-
search opportunities in drug discovery by enabling
effect analysis of various treatments on similar cell
types. Most of the current solutions still utilize
machine learning techniques requiring feature ex-
traction/reduction preprocessing due to the fact that
the number of images generated for particular treat-
ments/starvations may not be sufficient for deep learn-
ing (DL) methods. In our previous work we devel-
oped mathematical methods for calculating Frechet
mean with respect to Riemannian distances and
demonstrated their applicability to estimating sample
mean of matrix ensemble (Jahromi et al., 2015). Fur-
thermore, we demonstrated that Frechet mean can be
used to classify HCI using covariance structure of ran-
dom variations between various classes by focusing
not only on the center of the cluster distance but by
accounting for covariance structure of these classes
as well.
In this paper, we extend our previous work by
proposing weighted distance measures and informa-
tion fusion algorithms to combine classification de-
cisions of different classifiers. In Section 2 we in-
troduce the Fr
´
echet mean based on several Rieman-
nian distances and present information fusion algo-
rithm for making global classification decision. In
Section 3 we illustrate the applicability of our tech-
niques using a real data set. In Section 4 we discuss
conclusions and directions for future research.
2 FRECHET MEAN
We use the notion of Fr
´
echet mean to unify the
method of finding the mean of positive definite ma-
340
Jeremic, A. and Li, H.
Classification of HCI Datasets Using Information Fusion and Weighted Frechet Distance.
DOI: 10.5220/0011798100003414
In Proceedings of the 16th International Joint Conference on Biomedical Engineering Systems and Technologies (BIOSTEC 2023) - Volume 4: BIOSIGNALS, pages 340-343
ISBN: 978-989-758-631-6; ISSN: 2184-4305
Copyright
c
2023 by SCITEPRESS – Science and Technology Publications, Lda. Under CC license (CC BY-NC-ND 4.0)
trices. The Fr
´
echet mean is given as the point which
minimizes the sum of the squared distances (Bar-
baresco, 2008):
ˆ
S = argmin
S ∈M
n
∑
i=1
d
2
(S
i
, S) (1)
where
{
S
i
}
n
i=1
represents the symmetric positive defi-
nite matrices and d(., .) denotes the metric being used
respectively.
To measure the distance between two M ×M co-
variance matrices A and B on manifold of positive
definite matrices M , we consider the metrics which
have been developed to measure distance between
two points on the manifold itself. The following
metrics will be considered throughout the remaining
chapters.
The first metric is obtained when we lift the points
A, B to the horizontal subspace U ⊂H using the fibre
and measure the distance between them(Li and Wong,
2013):
d
R
1
(A, B) = argmin
˜
U
1
,
˜
U
2
∈U (M)
A
1
2
˜
U
1
−B
1
2
˜
U
2
2
(2)
where U(M) denotes the space of unitary matrices of
size M ×M. Alternatively Eq.(2) can be rewritten as:
q
Tr(A) + Tr(B) −2Tr(A
1
2
BA
1
2
)
1
2
(3)
In general for any positive definite matrix A its square
root is defined as A
1
2
= S
√
LD
H
; where A = SLD
H
is
the eigenvalue value decomposition of matrix A with
diagonal matrix L consisting of eigenvalues of A.
The second distance measure we will use is given
by
d
R
2
(A, B) = kA
1
2
−B
1
2
k
2
=
q
Tr(A) + Tr(B) −2Tr(A
1
2
B
1
2
)(4)
To define the last distance we will use, let the
points A, B ∈ M and let X be a the point on the man-
ifold at which we construct a tangent plane ( it is usu-
ally denoted as T
M
X). According to the inner-product
h
A, B
i
X
= Tr(X
−1
AX
−1
B) the log- Riemannian met-
ric is given as (Moakher, 2005):
d
R
3
(A, B) =
log(A
−
1
2
BA
−
1
2
)
2
=
s
M
∑
i=1
log
2
(L
i
)
(5)
where the L
i
’s are the eigenvalues of the matrix A
−1
B
(Absil et al., 2009). (Metric d
R3
has been developed
in various ways and has, for a long time, been used in
theoretical physics).
In detection and classification process we can im-
prove the performance of a classifier in discriminat-
ing between the features with similar properties re-
sulting from same class by keeping them as close as
Figure 1: Single Distance Local Classifier.
possible and similarly keep different features as far
as possible by utilizing images previously labelled by
experts. This process can be performed using the
concept of weighted distances presented in (Li et al.,
2009) where the weighting matrix is calculated using
argmax
w
d
2
w
(S
ik
, S
jk
)
d
2
w
(S
ik
, S
jk
0
)
(6)
where W is positive definite Hermitian matrix. The
summation in nominator of is performed over all co-
variance matrices in similar classes. On the other
hand, the denominator in same equation is summa-
tion over the all possibilities of covariance matrices
in the dissimilar classes.
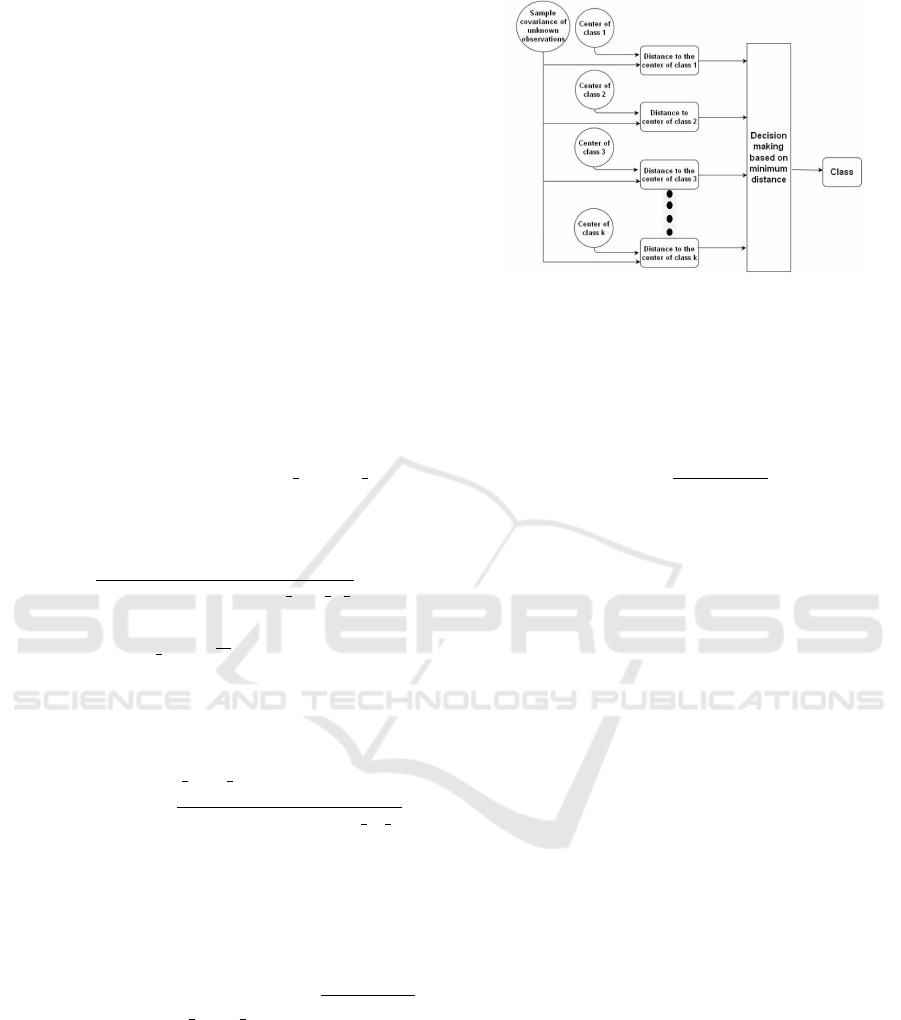
2.1 Distributed Classification System
Consider a scenario in which each of k classes has
a corresponding covariance matrix describing its ran-
domness. Due to the fact that number of images is
rather large, only small fraction of these cell images
can be labelled by experts. These images are then
used to create the corresponding covariance matrices
that define particular clusters. The new, unlabelled
data, i.e. cell images undergoing particular treatment
can then be classified automatically without expert in-
volvement. The graphic illustration of the system is
presented in Figure 1. In Figure 2 we illustrate the
overall schematic. Data set consisting of sample co-
variance matrices is classified using 3 local classifiers
(based on three distances) and the results of these
classifications are then transmitted to fusion center.
(Liu et al., 2007).
The role of the local classifiers LC
n
is to make lo-
cal decision u
n
based on their own distance measure.
All the local decisions are then sent to the fusion cen-
ter, where the global decision u
0
is made based on a
fusion rule in order to minimize the overall probabil-
ity of error. In this work, we only focus on the case
of three local classifiers using three aforementioned
Classification of HCI Datasets Using Information Fusion and Weighted Frechet Distance
341

LOC A L
CLA SS. L D
LOC A L
CLA SS. L D
LOC A L
CLA SS. L D
Fusion
Center
u
u
u
1
2
n
y
1
y
2
y
n
u
0
1
2
n
D A T A
Figure 2: Fusion Classification.
distances.
Following the approach of (Liu et al., 2014) we
formulate the above problem as M-ary classification
problem with corresponding unknown anomalies ε
i j
.
Since the overall performance of each classifier is data
dependent all of the anomalies (probabilities of incor-
rect classification i.e. picking class Ci when class Cj
is a correct choice) are unknown. In (Liu et al., 2014)
we derived maximum likelihood estimator of the un-
known anomalies using multiple decision vectors and
demonstrated that the algorithm converges to true val-
ues after certain number of global decisions assuming
that the statistical model governing the phenomenon
of interest is not changing.
In this application we assume that the statistical
distribution modelling the covariance matrices result-
ing from cell images undergoing particular treatment
is not changing. Once the anomalies are estimated the
global decision can be made following the approach
of (Varshney, 1986) by minimizing the overall proba-
bility of error. The global decision is given by
u
0
= arg max
i
P(C
i
|u
0
)
= arg max
i
P(C
i
)
∏
j∈S
0
ε
j
i0
·
∏
jinS
M−1
ε
j
iM−1
(7)
where
S
0
= {j|C
j
= 0, ∀j = 1, 2, 3}
.
.
.
S
M−1
= {j|C
j
= M −1, ∀j = 1, 2, 3}
correspond to partitions of local classifiers indices
(class decisions).
3 EXPERIMENTAL RESULTS
The data set that we have for classification consists
of 11 labels corresponding to 11 types of treatment as
illustrated in Table 1 and was provided by Dr. David
Andrews lab at Sunnybrook Hospital, Toronto, On-
tario, Canada. The input data set consists of mul-
tiple images of breast cancer cells (MCF7) obtained
Table 1: Medications and doses.
Treatment Dose
DMSO 2.5%
Ethanol 6
BFA 10 g/ml
Rapamycin 25 M
Tamoxifen 30 m
Thapsigargin 40 nM
Tunicamycin 25M
TNFalpha 10 ng/m
Starvation24 24hours
Starvation72 72 hours
using Opera High Content Screening System produc-
ing multichannel images. These images are then au-
tomatically segmented in order to obtain segments
corresponding to a single cell. Then, feature extrac-
tion is then performed extracting 705 predefined fea-
tures commonly used in analytical chemistry. Due to
the nature of the data certain features can be corre-
lated. In that case these could be removed follow-
ing the approach of (Shawe-Taylor and Cristianini,
2004). In this paper we remove the correlated fea-
tures using mutual correlation approach presented in
(Shawe-Taylor and Cristianini, 2004). Then we con-
struct sample covariances by calculating sample co-
variance of feature vectors corresponding to cells un-
dergoing the same treatment. In order to generate
multiple covariance matrices we divide the labelled
images (training set) into smaller groups of vectors
resulting in multiple covariance matrices per class.
The most important effect of weighting algorithm
is to keep the covariance matrices within the same
classes sufficiently close to each other while sepa-
rating covariance matrices belonging to the different
classes as far as possible. In Figure 2 we illustrate
the results of the weighted distance classification and
for comparison purposed in Figure 3 we illustrate the
same results without distance weights. These results
indicate that for different cell treatments different dis-
tances have superior performance. To this purpose
we examine applicability of the fusion techniques as
mentioned before. In Table 3 we illustrate the classifi-
cation performance. We can see that the performance
improvement for all the treatment types increases be-
tween 1-5%.
4 CONCLUSIONS
In this paper we demonstrated ability to classify high
content cell images that are commonly used in drug
development using classifier based on the Frechet dis-
BIOSIGNALS 2023 - 16th International Conference on Bio-inspired Systems and Signal Processing
342
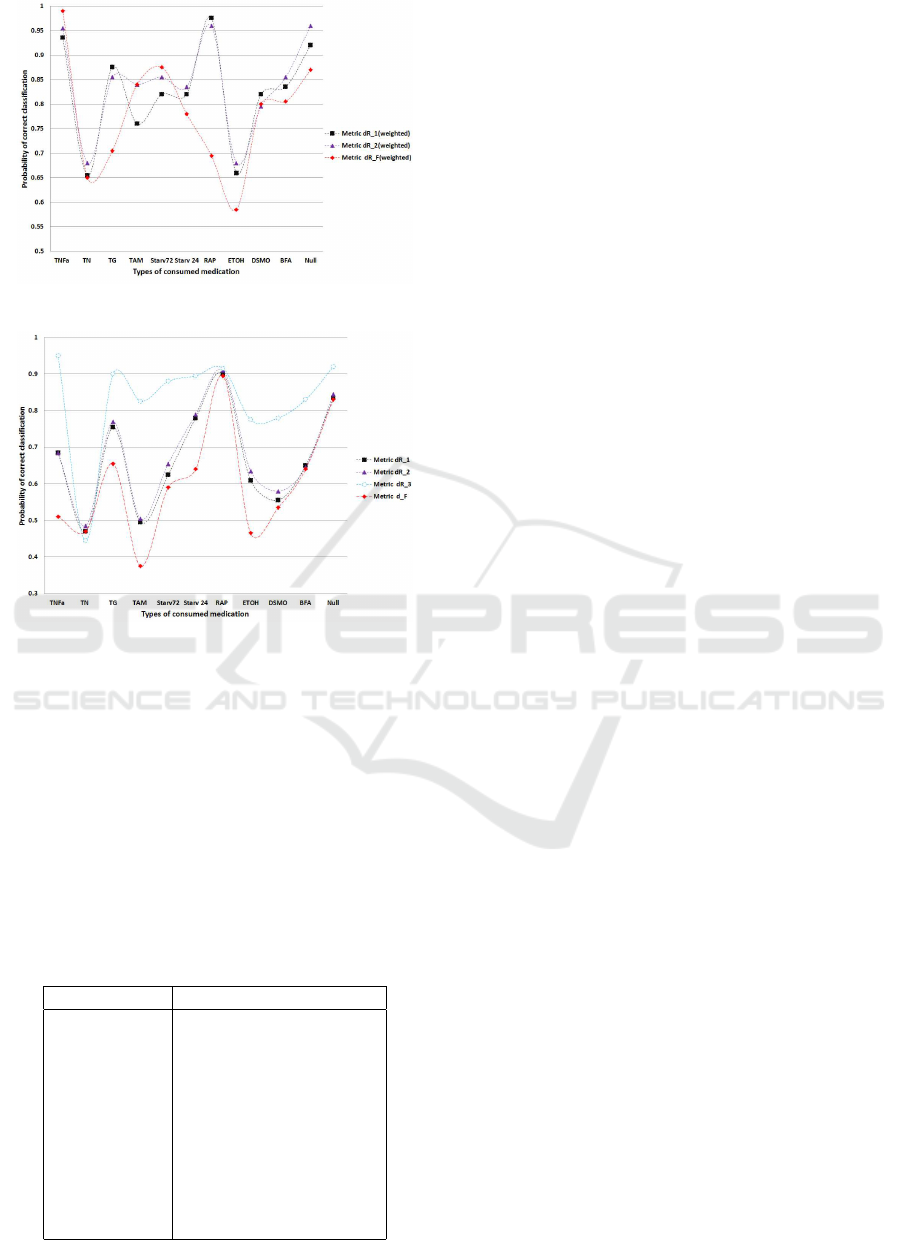
Figure 3: Probability of correct classification - weighted.
Figure 4: Probability of correct classification - non-
weighted.
tance measure between sample covariance matrices
calculated from the HCI real data set. In order to
improve the performance of previously used distance
measures in this paper we use weighted distance mea-
sure as it allows to reduce the probability of clas-
sification errors by increasing the cluster center dis-
tances. We evaluate the performance using dataset
consisting of 11 different classes corresponding to
different treatments. To further improve the classifi-
cation results we perform maximum likelihood based
classification fusion. Our results indicate that the re-
Table 2: Medications and doses.
Treatment ML-fused improvement
DMSO 1%
Ethanol 3%
BFA 1%
Rapamycin 2%
Tamoxifen 2%
Thapsigargin 1%
Tunicamycin 2%
TNFalpha 2%
Starvation24 3%
Starvation72 5%
sults obtained perform similarly to classically used al-
gorithms based on average based classification algo-
rithms. In future work we plan to develop more ef-
ficient computational algorithms and evaluate perfor-
mance as a function of training set size. In addition,
the performance of the proposed algorithm may de-
pend significantly on the algorithm used to construct
a sample covariance set and therefore an effort should
be made to investigate robustness/dependency of the
proposed algorithm on the sampling process.
REFERENCES
Absil, P.-A., Mahony, R., and Sepulchre, R. (2009). Opti-
mization algorithms on matrix manifolds. Princeton
University Press.
Barbaresco, F. (2008). Innovative tools for radar signal pro-
cessing based on Cartans geometry of SPD matrices
& information geometry. Radar Conference, 2008.
RADAR’08. IEEE, pages 1–6.
Debus, B., Parastar, H., Harrington, A., and Kirsanov, D.
(2021). Deep learning in analytical chemistry. Trends
in Analytical Chemistry, 145:116459.
Jahromi, M., Wong, K., and Jeremic, A. (2015). Estimat-
ing Positive Definite Matrices using Frechet Mean. In
Biosignal 2015, pages 2021–2026. INSTIC.
Li, Y., Wong, K., and deBruin, H. (2009). Eeg signal
classification based on a riemannian distance measure.
IEEE TIC-STH, pages 225–230.
Li, Y. and Wong, K. M. (2013). Riemannian distances for
EEG signal classification by power spectral density.
IEEE journal of selected selected topics in signal pro-
cessing.
Liu, B., Jeremic, A., and Wong, K. (2007). Blind adaptive
algorithm for M-ary distributed detection. In IEEE In-
ternational Conference on Acoustics, Speech and Sig-
nal Processing, 2007. ICASSP 2007, volume 2.
Liu, B., Jeremic, A., and Wong, K. (2014). Optimal dis-
tributed detection of multiple hypotheses using blind
algorithm. IEEE Trand. on Aerospace and Electronic
Systems, 50:1190–1203.
Moakher, M. (2005). A differential geometric approach
to the geometric mean of symmetric positive-definite
matrices. SIAM Journal on Matrix Analysis and Ap-
plications, 26(3):735–747.
Shawe-Taylor, J. and Cristianini, N. (2004). Kernel methods
for pattern analysis. Cambridge university press.
Varshney, P. (1986). Optimal data fusion in multiple sen-
sor detection systems. IEEE Trans. on Aerospace and
Electronic Systems, pages 98–101.
Classification of HCI Datasets Using Information Fusion and Weighted Frechet Distance
343
